
Profit Margin KPI: A Practical Guide for Australian SMEs
Master profit margin KPIs for your Australian business. Learn formulas, benchmarks, targets, and common pitfalls to improve your bottom line in 2026.
Ansh Malhotra

A business can report a profit and still leave its owner checking the bank balance before approving the next supplier payment. Revenue looks healthy, the income statement is in the black, and yet wages, stock purchases, tax obligations and overdue invoices keep absorbing the cash.
That tension usually means the business is measuring profit without understanding how profit is created and when it becomes cash. A profit margin KPI gives you that missing lens. It shows whether pricing, direct costs and operating decisions are producing enough room to fund the business, pay the owner and support the next stage of growth.
Table of Contents
Why Your Business Looks Profitable But Feels Broke
A founder might see strong sales and an acceptable net profit at month-end, then discover that most of the money is sitting in inventory or unpaid invoices. The business has earned revenue in accounting terms, but the bank account hasn't received the cash. Meanwhile, suppliers still expect payment on their terms, staff need to be paid, and the next stock order can't wait for every customer to settle.
That isn't a contradiction. Accounting profit and cash conversion answer different questions. Profit asks whether income exceeded recognised expenses during a period. Cash conversion asks whether the business turned that activity into money available for immediate obligations.

Margin is a control lever
The profit margin KPI sits between the ledger and the operating decisions that shape the ledger. A falling gross margin can point to supplier price increases, discounting, an unfavourable product mix or a pricing model that no longer reflects delivery costs. A weak operating margin can show that wages, rent, software, freight or overheads are absorbing the gross profit.
Australian historical business-profit data illustrates why owners shouldn't treat margin as a decorative reporting figure. The typical Australian business recorded a profit margin of 11%, while 73% of businesses made a profit, 2% broke even and 25% recorded a loss, according to historical Australian business-profit data from the Public Accountants Australia and New Zealand. Those figures describe an uneven market where modest deterioration can have serious consequences for businesses operating with limited room between profit and loss.
A margin KPI doesn't tell you everything. It won't, on its own, show whether a customer has paid, whether stock is moving or whether a loan repayment is due. It does, however, reveal whether each dollar of sales is creating enough economic value before cash timing complicates the picture.
Practical rule: Treat margin as an early warning signal, then investigate the cash and operational cause behind the movement.
The questions that make the number useful
A monthly margin report should lead to decisions, not a quick glance followed by filing. Ask:
Pricing: Are customers paying enough to cover current direct and delivery costs?
Product mix: Which products, services or customer segments are pulling the overall margin up or down?
Cost control: Which cost line changed, and was the change temporary or structural?
Cash timing: Has profit been converted into cash, or is it trapped in inventory and receivables?
Owner return: Does the business generate enough margin to fund a proper wage and reinvestment?
The useful metric isn't always the highest margin. A product with a strong gross margin may sell slowly, require extensive support or tie up cash in stock. A lower-margin offering may produce faster cash conversion and better capacity utilisation. Founders need to assess margin quality, not just margin size.
The Four Profit Margin KPIs You Need to Know
A sales increase can hide a weaker business. If direct costs rise faster than revenue, gross margin falls. If overheads grow faster than gross profit, operating margin contracts. If interest and tax absorb the remaining result, net margin may leave little room for error. Australian SMEs should separate the four main profit margin KPIs and connect each one to a specific management decision.
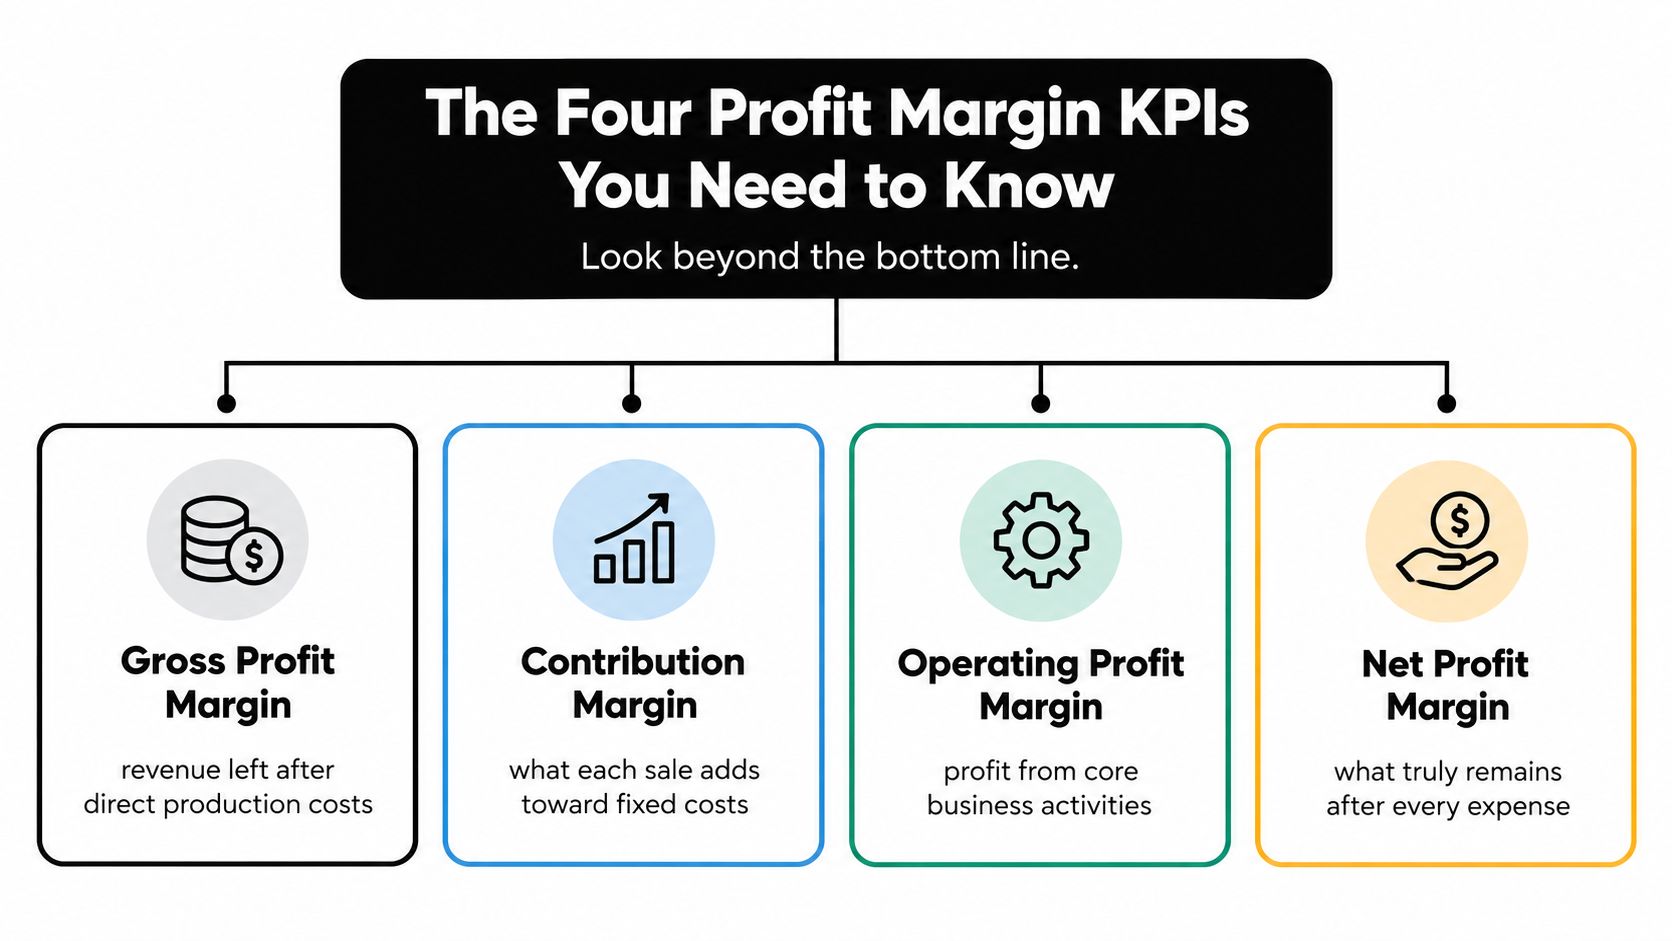
Gross profit margin
Gross profit margin measures the revenue left after direct costs such as materials, stock, manufacturing inputs, or directly attributable delivery costs. The basic formula is:
Gross profit margin = (Revenue minus cost of goods sold) divided by revenue
Use it to review pricing, purchasing, product mix, and delivery economics. If revenue rises while gross margin falls, the extra sales may be generating accounting profit while consuming more cash through stock purchases, subcontractor costs, or supplier payments.
For example, if a business records revenue of R and cost of goods sold of C, its gross profit margin is (R - C) / R. The accounting system needs a consistent definition of cost of goods sold. If freight, subcontractors, or project delivery costs move between direct costs and overheads from month to month, the KPI loses comparability.
A clean cost classification makes the result more useful. This cost structure for estimators explains how direct and indirect costs can be separated for estimating and review. You can also check the calculation method against this guide to how to calculate gross profit margin.
Gross margin is an accounting measure, not a cash-conversion measure. A sale can show a satisfactory margin while cash remains tied up in inventory or unpaid invoices. Review the margin alongside stock days, receivable collections, and supplier terms before treating growth as financially healthy.
Contribution margin
Contribution margin shows what remains from a sale after its variable costs, before fixed costs are paid. The formula is:
Contribution margin = (Revenue minus variable costs) divided by revenue
Variable costs change with activity. Depending on the business model, they may include transaction fees, sales commissions, job-specific labour, packaging, or delivery charges. Contribution margin answers a different question from gross margin: does the next sale contribute enough to cover fixed operating costs?
A business can report a healthy gross margin and still have a weak contribution margin if commissions, fulfilment, or delivery costs sit outside product cost. This KPI supports decisions about discounted jobs, new sales channels, customer acquisition, and marketing spend. A discount may increase volume while reducing the contribution available to pay wages, rent, and software.
Operating profit margin
Operating profit margin measures profit from core business activities after operating expenses, before financing and tax effects. The formula is:
Operating profit margin = Operating profit divided by revenue
This measure brings wages, rent, technology, insurance, administration, and other operating expenses into view. It shows whether the operating model works after the costs required to run the business, rather than only after the cost of producing or delivering a sale.
The Reserve Bank of Australia describes a technical operating-profit-margin measure based on year-ended operating revenue less operating costs and wages. Its series covers roughly 250,000 GST-remitting companies, with the latest March 2024 observation seasonally adjusted, as explained in the RBA analysis of small-business economic and financial conditions.
For founders, a falling operating margin usually points to a controllable operating issue. Check labour utilisation, price increases from suppliers, recurring software, rent, and administrative headcount. A stable operating margin can still coexist with weak cash conversion if working capital absorbs the operating result.
Net profit margin
Net profit margin shows what remains after all recognised expenses, including interest, tax, and other non-operating charges. The formula is:
Net profit margin = Net profit divided by revenue
This is the closest of the four measures to the owner's final accounting result. It matters for retained earnings, debt capacity, distributions, and long-term viability, but it should not replace the earlier KPIs. Net margin identifies the size of the final result. Gross and contribution margins help explain whether pricing, delivery economics, or overhead allocation created it.
Use the four measures together. If gross margin falls, examine pricing, purchasing, and direct delivery costs. If gross margin holds while operating margin declines, investigate overhead growth. If operating margin remains sound but net margin weakens, review finance costs, tax, and other non-operating items. If all four look healthy while the bank balance stays under pressure, examine how quickly profit converts into cash.
Australian Profit Margin Benchmarks by Sector
A personal-care provider and a building-materials business can report very different margins while both operating well. Stock levels, purchasing terms, labour requirements and competitive pressure shape the result. A founder who compares gross margin without considering those factors may cut a profitable offer or pursue a percentage that restricts cash.
Australian sector data shows the range. Xero reports a 36.0% average gross profit margin for small businesses across all industries in Q2 2025. The reported sector figures were 48.44% for personal care, 28.38% for building materials, 45.89% for health and medical supplies, and 39.12% for food and beverage excluding manufacturing, according to Xero's Australian gross-profit-margin benchmark guide.
These are gross-margin benchmarks, not targets for final profit. Gross margin is calculated before wages, rent, software, finance costs and tax. A business below the sector average can still produce a stronger operating result if it turns inventory quickly, controls overhead and collects invoices on time. Conversely, a high gross margin can deliver little usable cash when stock purchases, long payment terms or heavy fixed costs absorb the result.
Benchmark the right layer
Use the sector figure as a starting point. Then compare it with your own history, customer mix and operating model.
Question | What the comparison can reveal |
|---|---|
Is gross margin below the sector norm? | Pricing pressure, supplier costs, discounting or a different product mix |
Is gross margin stable while operating margin falls? | Rising wages, rent, administration or other overheads |
Is operating margin acceptable while cash remains restricted? | Stock purchases, receivables or payment timing |
Is net margin volatile? | Interest, tax, one-off expenses or changes outside core operations |
A separate Australian reference point comes from historical business-profit data. The typical business recorded an 11% profit margin, while 73% were profitable, 2% broke even and 25% recorded a loss, based on the Public Accountants Australia and New Zealand source cited in this Australian discussion of good profit margins. Treat those figures as context rather than a target. They show how widely profitability and resilience can differ between businesses.
Set a target that reflects your decisions
Start with the result required to fund owner remuneration, tax, debt commitments, reinvestment and a sensible buffer. Work backwards to test whether pricing, direct costs and overheads can support it. Then check whether the resulting accounting profit converts into cash at a pace that matches supplier and payroll commitments.
Segment the analysis where it changes decisions. A trade business can compare service types by travel profile and labour intensity. An ecommerce business can separate categories by advertising, fulfilment and return costs. An agency can review clients, delivery teams and scope variation.
Do not raise the percentage by rejecting profitable work without checking capacity and cash. Margin is a decision tool. Its value comes from showing which prices, costs and operating choices need attention.
The Cash Flow Trap, Margin Versus Cash Conversion
A $50,000 wholesale order can show a healthy margin and still create a cash gap. If the supplier allows 30-day terms but the customer pays in 45 days, the business carries the funding burden for at least 15 days after the supplier invoice falls due. At a 35% gross margin, the sale may be profitable, yet $50,000 remains tied up in stock and receivables before the cash is available.

The immediate operating levers are a customer deposit, a progress payment, or a lower stock reorder point. A deposit can fund the purchase. A progress payment can shorten the gap between delivery and collection. A reorder point based on confirmed demand can reduce the amount of cash sitting in unsold inventory. Choose the lever that fits the customer and supplier relationship, then measure whether it shortens the cash cycle.
The same timing issue affects Australian service businesses. A project may carry a sound margin while wages are paid weekly and the client pays only after a milestone, approval process or dispute is resolved. The profit and the bank receipt belong to different dates, so project budgets should include the expected payment date, not only the contracted value.
Track the working-capital causes
Review margin alongside the working-capital items that determine when profit becomes usable cash:
Inventory: Flag slow-moving or over-ordered stock, and link replenishment to demand rather than optimism.
Receivables: Issue profitable invoices promptly, confirm payment terms and follow up overdue balances.
Payables: Record supplier terms accurately, while avoiding dependence on late payments as permanent funding.
Timing: Map payroll, tax, loan and major supplier commitments against expected receipts.
Financing: Keep borrowing costs separate from operating performance so funding pressure does not obscure trading results.
Use the cash conversion cycle guide to connect inventory days, receivable days and payable terms with the time required to recover cash from trading activity. The calculation matters because it identifies where a sale remains unavailable for the next obligation.
A healthy margin funds the business only after the underlying activity becomes cash.
Pair every material margin movement with a cash explanation. If margin rises because fewer goods were purchased, check whether purchasing improved or replenishment was only delayed. If net profit rises with higher invoicing, inspect the receivables ledger before treating the increase as available cash.
Use the following video as a prompt for a team discussion about reported margin and available cash:
Review the income statement and balance sheet together. The income statement shows economic performance, the balance sheet shows where cash is tied up, and the bank account shows whether the business can meet its next obligations.
Setting Targets and Monitoring Your KPIs Effectively
A useful KPI routine starts with a target that reflects the business model, then creates a short path from variance to action. Don't set one margin goal for the entire company if customer segments, products or service lines have different economics.
Define the calculation first. Decide which costs belong in cost of goods sold, variable costs and operating expenses. Keep that treatment consistent across periods. If the chart of accounts changes without explanation, a movement in gross margin may reflect bookkeeping rather than business performance.
Build a management view
A practical dashboard should display:
Gross margin by product or service: Use this to investigate pricing and direct-cost movement.
Contribution margin by channel or customer: Use this before approving discounts or additional selling costs.
Operating margin: Use this to manage wages, overhead and operational capacity.
Net margin: Use this to assess the final accounting result.
Cash conversion indicators: Use these to identify stock and receivables that prevent profit from reaching the bank.
The RBA conference evidence supports using BAS data to operationalise gross profit margin. BAS reporting captures sales and cost of goods sold quarterly, so it can reveal margin compression from input-cost inflation or pricing lag earlier than annual accounts, as described in the RBA conference paper on firm-level profit margins.
BAS data isn't a substitute for monthly management accounts. It is a valuable checkpoint. Use your accounting platform for regular reporting, then reconcile the broader view against BAS information and investigate differences before they become normalised.
Turn variance into an owner
A percentage change isn't an action. Assign every material variance to a specific cause and person:
Pricing variance: Review quotes, discount approvals and price-list changes.
Input-cost variance: Compare supplier invoices and landed costs against the assumptions used in pricing.
Wage variance: Separate headcount, pay-rate and utilisation changes.
Mix variance: Identify whether customers bought lower-margin products or services.
Cash variance: Trace inventory purchases, overdue invoices and payment timing.
A dashboard tool can automate calculations, but automation won't decide whether a price increase will lose a customer or whether excess stock should be discounted. For field-service operators assessing systems, a practical guide to lawn care business software can help frame the connection between job management, invoicing and financial reporting.
Review the KPI at a consistent rhythm. During a period of cost volatility or rapid growth, investigate more frequently. At each review, record the movement, the cause, the decision and the person responsible. The next period should show whether the action worked.
Nexist can provide a finance engine with forecasting, performance reporting and KPI workflows for founders who want margin and cash reviewed together. The important principle is the same whether you use Xero, MYOB, a spreadsheet or another dashboard: the report must trigger a management decision.
Common Mistakes in Profit Margin Reporting
The first mistake is treating margin as one number. Gross margin, contribution margin, operating margin and net margin answer different questions. Combining them into a single percentage hides whether the problem sits in purchasing, pricing, delivery, overhead or financing.
The second mistake is accepting a benchmark without checking the business model. Sector variation in Australian gross margins is substantial, so an owner should compare like with like and use internal trends as the main test of progress. A target copied from another industry can encourage unhelpful discounting or unnecessary cost cuts.
Errors that distort the decision
Inconsistent cost classification: Moving freight or subcontractor costs between direct costs and overheads changes the apparent margin without changing the economics.
Ignoring product mix: An overall margin can move because customers bought different items, not because every price or supplier cost changed.
Relying on annual accounts: Annual reporting can reveal the result too late to correct pricing or purchasing decisions. BAS-based review can provide a more timely view of sales and cost-of-goods movements, as discussed earlier.
Confusing profit with cash: A profitable invoice isn't the same as a collected invoice, and inventory isn't available cash.
Tracking without ownership: A dashboard that doesn't assign an action to a person becomes a historical record rather than a control system.
The final trap is improving a KPI cosmetically. Delaying maintenance, reducing necessary service, underpaying the owner or cutting stock indiscriminately may lift a short-term result while weakening the business. Good margin management improves the underlying economics and makes cash conversion more reliable.
If your profit margin looks acceptable but cash keeps disappearing, Nexist can help connect pricing, inventory, receivables, forecasting and KPI reporting into a practical finance system. Book a business scorecard review to identify the margin leaks and working-capital decisions that deserve attention first.
profit margin kpi, Australian SME, gross profit, operating margin, net profit

" width="24px"/><g d="M 0 24.129 L 0 0.129 L 24 0.129 L 24 24.129 Z M 0 24.129 L 0 0.129 L 24 0.129 L 24 24.129 Z M 24 3 C 24 1.344 22.656 0 21 0 L 3 0 C 1.344 0 0 1.344 0 3 L 0 21 C 0 22.656 1.344 24 3 24 L 21 24 C 22.656 24 24 22.656 24 21 Z M 6.883 8.375 L 2.863 8.375 L 2.863 20.467 L 6.883 20.467 Z M 4.899 2.545 C 3.524 2.545 2.625 3.449 2.625 4.634 C 2.625 5.795 3.496 6.724 4.846 6.724 L 4.872 6.724 C 6.273 6.724 7.146 5.795 7.146 4.634 C 7.12 3.449 6.274 2.545 4.899 2.545 Z M 16.747 8.09 C 14.614 8.09 13.659 9.263 13.124 10.086 L 13.124 8.374 L 9.105 8.374 C 9.159 9.508 9.105 20.466 9.105 20.466 L 13.124 20.466 L 13.124 13.713 C 13.124 13.352 13.15 12.99 13.257 12.732 C 13.547 12.01 14.209 11.262 15.319 11.262 C 16.773 11.262 17.355 12.372 17.355 13.996 L 17.355 20.466 L 21.374 20.466 L 21.374 13.532 C 21.374 9.818 19.391 8.09 16.747 8.09 Z" fill="transparent" height="24.12890599668026px" id="dSFdkJotL" width="24px"><path d="M 0 24 L 0 0 L 24 0 L 24 24 Z" fill="transparent" height="24px" id="wscNJE44G" transform="translate(0 0.129)" width="24px"/><g d="M 0 24.129 L 0 0.129 L 24 0.129 L 24 24.129 Z M 24 3 C 24 1.344 22.656 0 21 0 L 3 0 C 1.344 0 0 1.344 0 3 L 0 21 C 0 22.656 1.344 24 3 24 L 21 24 C 22.656 24 24 22.656 24 21 Z M 6.883 8.375 L 2.863 8.375 L 2.863 20.467 L 6.883 20.467 Z M 4.899 2.545 C 3.524 2.545 2.625 3.449 2.625 4.634 C 2.625 5.795 3.496 6.724 4.846 6.724 L 4.872 6.724 C 6.273 6.724 7.146 5.795 7.146 4.634 C 7.12 3.449 6.274 2.545 4.899 2.545 Z M 16.747 8.09 C 14.614 8.09 13.659 9.263 13.124 10.086 L 13.124 8.374 L 9.105 8.374 C 9.159 9.508 9.105 20.466 9.105 20.466 L 13.124 20.466 L 13.124 13.713 C 13.124 13.352 13.15 12.99 13.257 12.732 C 13.547 12.01 14.209 11.262 15.319 11.262 C 16.773 11.262 17.355 12.372 17.355 13.996 L 17.355 20.466 L 21.374 20.466 L 21.374 13.532 C 21.374 9.818 19.391 8.09 16.747 8.09 Z" fill="transparent" height="24.12890599668026px" id="sTpjGo1tb" width="24px"><path d="M 0 24 L 0 0 L 24 0 L 24 24 Z" fill="transparent" height="24px" id="s7ffpmKOD" transform="translate(0 0.129)" width="24px"/><g d="M 24 3 C 24 1.344 22.656 0 21 0 L 3 0 C 1.344 0 0 1.344 0 3 L 0 21 C 0 22.656 1.344 24 3 24 L 21 24 C 22.656 24 24 22.656 24 21 Z M 6.883 8.375 L 2.863 8.375 L 2.863 20.467 L 6.883 20.467 Z M 4.899 2.545 C 3.524 2.545 2.625 3.449 2.625 4.634 C 2.625 5.795 3.496 6.724 4.846 6.724 L 4.872 6.724 C 6.273 6.724 7.146 5.795 7.146 4.634 C 7.12 3.449 6.274 2.545 4.899 2.545 Z M 16.747 8.09 C 14.614 8.09 13.659 9.263 13.124 10.086 L 13.124 8.374 L 9.105 8.374 C 9.159 9.508 9.105 20.466 9.105 20.466 L 13.124 20.466 L 13.124 13.713 C 13.124 13.352 13.15 12.99 13.257 12.732 C 13.547 12.01 14.209 11.262 15.319 11.262 C 16.773 11.262 17.355 12.372 17.355 13.996 L 17.355 20.466 L 21.374 20.466 L 21.374 13.532 C 21.374 9.818 19.391 8.09 16.747 8.09 Z" fill="transparent" height="24.000006px" id="D0ecaHEcW" transform="translate(0 0)" width="24px"><path d="M 24 3 C 24 1.344 22.656 0 21 0 L 3 0 C 1.344 0 0 1.344 0 3 L 0 21 C 0 22.656 1.344 24 3 24 L 21 24 C 22.656 24 24 22.656 24 21 Z" fill="rgb(55, 184, 218)" height="24.000006px" id="IPLFE6zXx" width="24px"/><path d="M 4.02 0 L 0 0 L 0 12.092 L 4.02 12.092 Z" fill="rgb(255, 255, 255)" height="12.09201px" id="FWhtzAyuY" transform="translate(2.863 8.375)" width="4.02px"/><path d="M 2.274 0 C 0.899 0 0 0.904 0 2.089 C 0 3.25 0.871 4.179 2.221 4.179 L 2.247 4.179 C 3.648 4.179 4.521 3.25 4.521 2.089 C 4.495 0.904 3.649 0 2.274 0 Z" fill="rgb(255, 255, 255)" height="4.17876px" id="VmOsKv4kO" transform="translate(2.625 2.545)" width="4.52095px"/><path d="M 7.641 0 C 5.509 0 4.554 1.173 4.019 1.996 L 4.019 0.284 L 0 0.284 C 0.053 1.419 0 12.376 0 12.376 L 4.019 12.376 L 4.019 5.623 C 4.019 5.262 4.045 4.9 4.151 4.642 C 4.442 3.92 5.103 3.172 6.214 3.172 C 7.667 3.172 8.25 4.282 8.25 5.907 L 8.25 12.376 L 12.269 12.376 L 12.269 5.442 C 12.269 1.728 10.286 0 7.641 0 Z" fill="rgb(255, 255, 255)" height="12.37626px" id="n1XUbhaq0" transform="translate(9.105 8.09)" width="12.268830000000001px"/></g></g></g></g></svg>)