
What Is a Good Profit Margin for Australian SMEs
What is a good profit margin for Australian SMEs? Learn how to calculate gross, operating and net margins, realistic benchmarks, and proven ways to lift yours.
Ansh Malhotra

For most Australian SMEs, a net margin around 6% to 7% is typical, and “good” usually means materially above that, depending on your industry and business size. There isn't one universal target that works for a café, consultancy, ecommerce brand and manufacturer.
You've probably seen the pattern. Revenue on the Xero dashboard is climbing, invoices are going out faster, and the sales team is celebrating. Yet the offset account barely moves, payroll still feels tight, and the BAS keeps draining the cash buffer.
That's the trap. Turnover is not wealth. Margin is the lens that shows how much of each sales dollar your business keeps.
A $1.5 million business with disciplined costs and strong pricing can leave its owner better off than a $3 million business that leaks money through labour, freight, discounts, rent, stock and slow collections. A café might generate $1.2 million in sales and retain only a thin slice after food, wages, rent and utilities. A consultancy might generate $600,000 with far fewer direct costs and retain a much larger share.
The rest of this guide separates gross margin, operating margin and net margin, then applies Australian SME benchmarks from CA ANZ, the ATO, the ABS, the FWC and the RBA. You'll see why gross margin can look healthy while net profit remains weak, which benchmarks are useful, and what to change when the numbers don't support the business.
Table of Contents
Why Revenue Growth Does Not Always Mean More Cash
A founder can grow sales and still become poorer. The usual causes are not mysterious. Customers pay late, stock gets purchased before it sells, discounts eat into pricing, and every new dollar of turnover brings extra labour or fulfilment cost with it.
Revenue tells you what customers agreed to buy. Profit margin tells you what remains after the costs required to deliver those sales. That distinction matters more as a business scales because growth often increases the amount of cash trapped in receivables, inventory and work in progress.
CFO rule: Never approve growth simply because the revenue line is rising. Check what each additional dollar contributes after its full cost to serve.
Consider two businesses. The café has busy weekends, a growing delivery channel and impressive annual sales, but food waste, casual wages, rent and platform charges consume most of the gross profit. The consultancy sells fewer projects, but its delivery model has a lighter direct-cost base. The consultancy's revenue is lower, yet its owner may have more cash available for tax, reinvestment and personal drawings.
That's why margin analysis must sit beside revenue reporting. A sales report can tell you which customers bought. It can't tell you whether those customers were worth serving.
Founders should also look beyond their own ledger. Revenue leakage can sit inside missed renewals, unbilled work, inconsistent pricing and contract terms, which is why a practical resource on revenue operations for mid-market can help identify problems between selling and collecting.
The first layer is gross margin, which tests the economics of your products or services. The second is operating margin, which shows what remains after running the business. The third is net margin, which captures the result after finance costs, tax and other items. If your cash feels tighter than your sales suggest, start with those three lines and then trace the result into debtor and inventory movements.
For a practical cash review, use this guide on how to improve cash flow alongside your margin report. Profit and cash belong in the same management conversation.
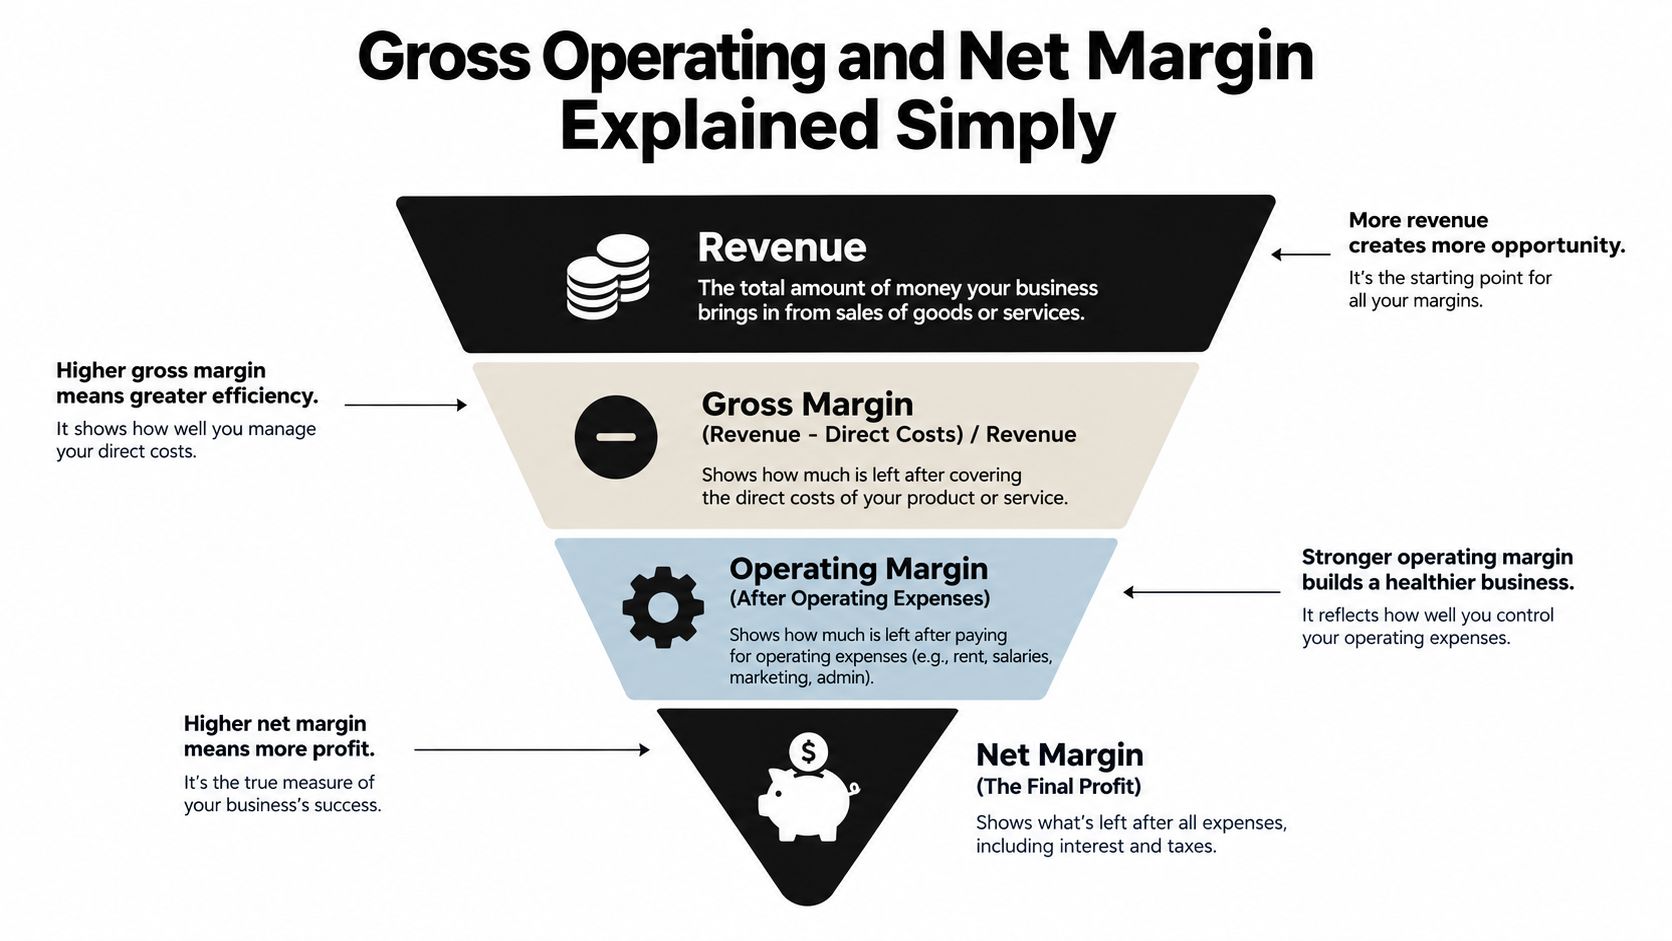
Gross Operating and Net Margin Explained Simply
Think of the income statement as a funnel. Revenue enters at the top, then direct costs, operating expenses, finance costs and tax narrow the amount that survives.
Gross margin tests the offer
Gross margin = revenue minus direct costs, divided by revenue.
Direct costs include the costs directly connected to delivering the sale, such as inventory, materials, freight into stock or delivery labour. If you sell a product for $100 and the direct cost is $40, the gross profit is $60 and the gross margin is 60%.
Gross margin answers a commercial question: does this product, service or job generate enough contribution before overheads? A weak result usually points to pricing, supplier cost, discounts, wastage or job estimation.
Nexist's guide to calculating gross profit margin is useful when you need to review margin by SKU, service line or job type rather than relying on one blended figure.
Operating margin tests the machine
Operating margin = revenue minus direct costs and operating expenses, divided by revenue.
Operating expenses include wages, rent, marketing, insurance, software, administration and other costs required to run the business. Operating margin shows whether the organisation can convert gross profit into a sustainable result before interest and tax.
A business can have excellent product economics and still produce a weak operating margin if the team carries unnecessary subscriptions, excessive management layers, underused premises or inefficient processes.
Net margin tests what survives
Net margin = profit after all expenses, divided by revenue.
This includes interest, tax and relevant one-off costs. Net margin is the closest of the three measures to the return available to the owner, although it still needs to be reconciled with cash flow, debt repayments and capital expenditure.
Take a Sydney ecommerce brand with $2 million in revenue, $1.1 million in cost of goods sold, $520,000 in operating expenses, and $60,000 in interest and tax. Gross profit is $900,000, producing a 45% gross margin. After operating expenses, operating profit is $380,000, or a 19% operating margin. After the stated interest and tax costs, $320,000 remains, which is a 16% net margin.
The point is not the exact outcome of this example. It's the direction of travel. Revenue starts at 100%, then shrinks as each cost layer is recognised. Gross margin checks pricing and product economics. Operating margin checks cost discipline. Net margin shows the final accounting result, but the bank balance still depends on when customers pay and when stock and suppliers consume cash.
Australian Benchmarks Founders Should Actually Use
The question “what is a good profit margin?” is incomplete without sector and business size. Australian evidence doesn't support copying a single target from an overseas software company or a generic online article.
CA ANZ's Australian profitability and risk benchmarks report median net operating profit margins of 6% for micro businesses, 7% for small businesses and 7% for medium businesses. The same benchmark reports median gross profit margins of 72% for micro businesses, 64% for small businesses and 62% for medium businesses. Those figures expose the gap between a strong gross result and the much smaller amount left after wages, overheads and other operating costs. See the ATO small business benchmarks for the relevant Australian benchmark framework.
Business size | Typical gross margin | Typical operating margin | Typical net margin |
|---|---|---|---|
Micro businesses | 72% | Not provided in the benchmark data | 6% |
Small businesses | 64% | Not provided in the benchmark data | 7% |
Medium businesses | 62% | Not provided in the benchmark data | 7% |
These are medians, not promises or targets. A business with a 7% net margin may be operating normally for its peer group, but that doesn't mean the result is comfortable. If the owner is carrying excessive debt, relying on slow-paying customers or funding stock purchases through expensive finance, a normal margin can still produce severe cash pressure.
The ABS and FWC use operating profit before tax divided by sales and service income as the operating-margin framework. Across selected industries, the five-year average OPBT margin was 20.9% for all businesses and 18.9% for small businesses. In 2021–22, the figures were 16.3% for all businesses and 13.6% for small businesses. These figures relate to selected industries, so they're a reference point rather than a universal SME target. The underlying methodology is available through the Australian Bureau of Statistics industry methodology.
The RBA's March 2025 analysis also found that median operating profit margins for small businesses were broadly stable or slightly improved across most industries. That reinforces the practical conclusion: benchmark your trailing twelve-month results against businesses with a comparable model, cost base and stage. For a broader explanation of benchmarking for ROI improvement, focus on comparable inputs rather than vanity comparisons.
How Margins Differ Across Australian Industries
Industry structure determines how much profit can survive. A business that carries stock, leases a site and employs a large frontline team cannot use the same margin expectations as a specialist consultancy.
Australian benchmark data supports that caution, but the verified figures available here provide national size benchmarks rather than a complete sector-by-sector margin table. The ranges below are therefore qualitative operating profiles, not invented Australian statistics.
Sector | Typical gross margin | Typical net margin | Main cost driver |
|---|---|---|---|
Hospitality and cafés | Often constrained by food and beverage input costs | Usually thin after wages, rent and wastage | Labour, rent, food costs and delivery fees |
Ecommerce and retail | Can look strong before fulfilment and overheads | Often much thinner than gross margin suggests | Inventory, freight, marketing, returns and storage |
Professional services | Usually stronger because direct delivery costs are lighter | Can be strong when utilisation and pricing are controlled | Staff capacity, non-billable time and overhead |
Trades and construction | Varies by job type and materials | Depends heavily on estimating and labour recovery | Labour, materials, rework and debtor timing |
Light manufacturing | Pressured by materials and production capacity | Sensitive to utilisation and fixed-cost absorption | Inputs, machinery, labour and production overhead |
Hospitality and retail need a cash view
A café may post an attractive gross margin on individual menu items, yet lose that advantage through wage costs, rent, spoilage and delivery commissions. Ecommerce brands face a similar issue. The gross margin on a product can look healthy while fulfilment, returns, advertising and inventory carrying costs leave little net profit.
CA ANZ's benchmark gap illustrates the danger. Median gross margins range from 62% to 72% across micro, small and medium businesses, while median net operating margins sit at 6% to 7%. The difference is where most founders lose visibility.
Services need utilisation discipline
Professional services often avoid large inventory commitments, but that doesn't make every client profitable. Unbilled senior time, underquoted work, scope creep and idle capacity reduce operating margin. A consultancy should calculate contribution by client, project and employee capacity, not only by total monthly revenue.
Trades and manufacturing require the same job-level discipline. A quote that covers materials but misses travel, supervision, rework or collection delays can create revenue without an adequate return.
Practical rule: Find your sector and operating model first. Judge your margin against similar businesses, not against a generic national average.
Common Misconceptions That Distort the Numbers
Founders rarely misread profit because they can't do arithmetic. They misread it because the accounting view answers a different question from the one they're asking.

Myth one, revenue growth equals success
Wrong assumption: More sales automatically mean a healthier business.
Correct view: Growth creates value only when the incremental work produces an acceptable margin and converts into cash. A discount-heavy campaign can increase turnover while reducing the contribution available for wages and overheads.
Myth two, gross margin equals profitability
Wrong assumption: A high gross margin proves the business is profitable.
Correct view: Gross margin stops before operating expenses. CA ANZ's Australian benchmarks show median gross margins of 72% for micro businesses, 64% for small businesses and 62% for medium businesses, while median net operating margins are only 6%, 7% and 7% respectively. The gap exposes the cost of running the business after the product is sold. See the CA ANZ benchmark report available through the Australian small business profitability data.
Myth three, the industry average is your target
Wrong assumption: Matching the median means you're doing well.
Correct view: A benchmark is a diagnostic reference. Your business may need a higher margin because it carries debt, has seasonal cash needs or must fund an expansion plan.
Myth four, profit equals cash
Wrong assumption: A profitable P&L means the bank account should be full.
Correct view: Debtors, stock, prepayments, supplier timing and loan repayments can absorb cash while accounting profit remains positive. Review profit with a cash conversion report.
Myth five, tax profit is the management answer
Wrong assumption: The taxable result is the only number worth managing.
Correct view: Owner wages, superannuation, one-off write-downs and financing arrangements can distort the operating picture. Track gross, operating and net margins consistently, then reconcile them to cash.
Myth six, competitor pricing sets your margin
Wrong assumption: You must match the market price.
Correct view: Competitor pricing may set a ceiling, but it doesn't define your cost to serve. If the price doesn't cover your direct and operating costs, copying it copies someone else's problem.
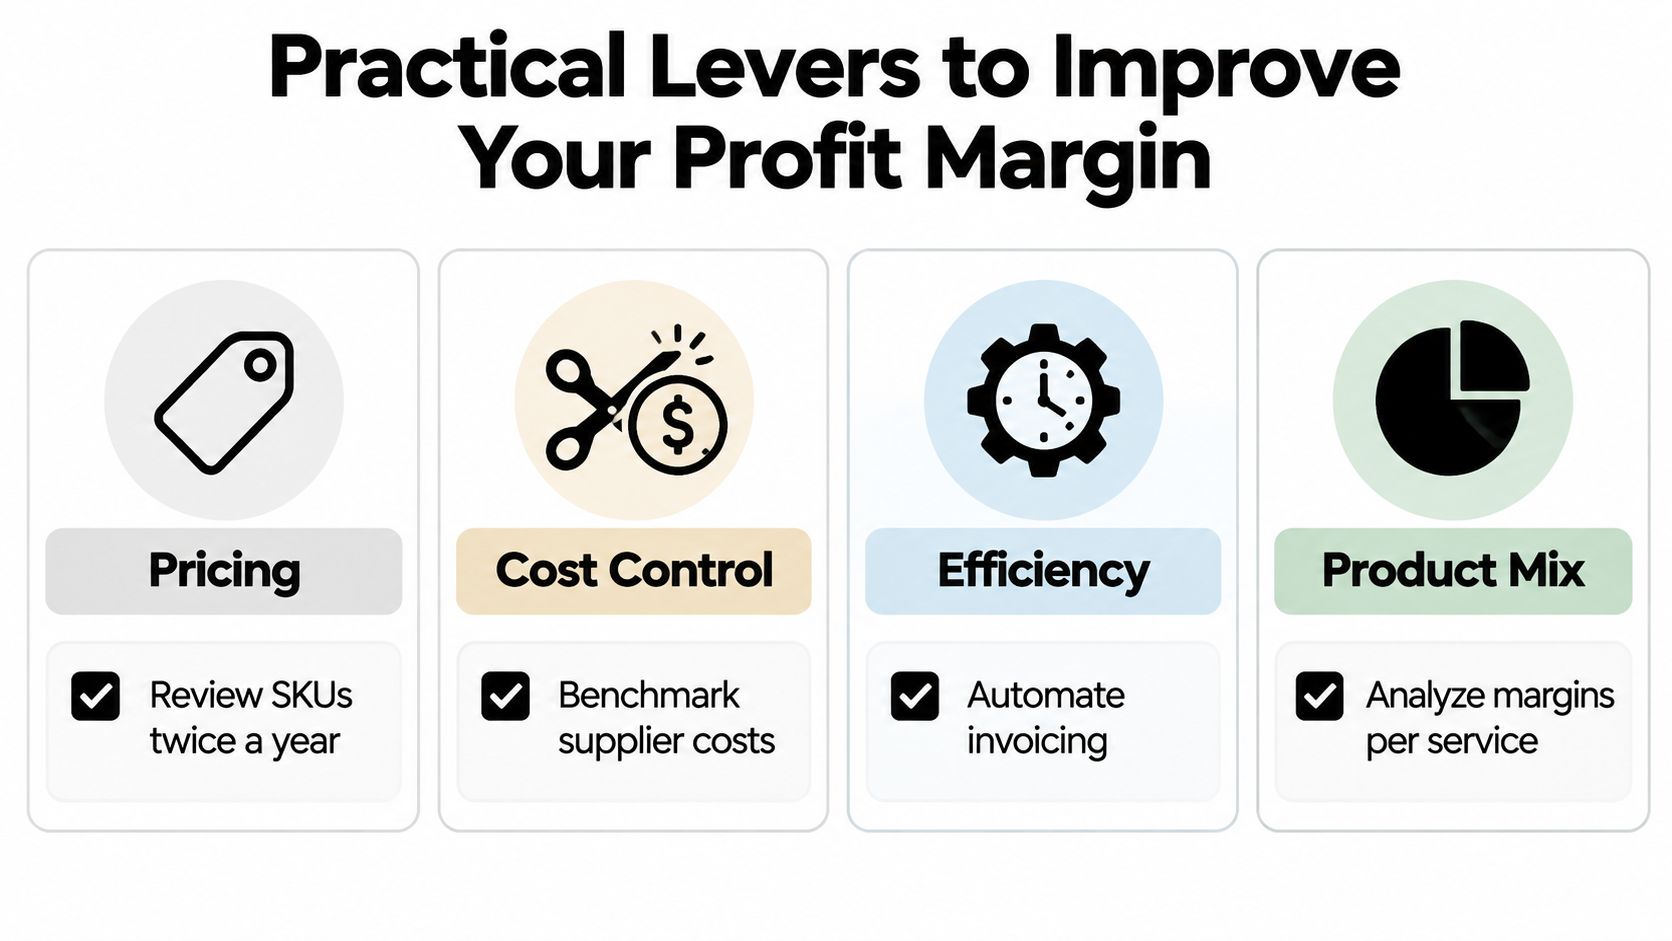
Practical Levers to Improve Your Profit Margin
Margin improvement doesn't require a dramatic restructure. It requires decisions at the point where money enters, moves through and leaves the business.
Start with pricing
Review every SKU, service line and job type. A price that was acceptable when supplier rates, wages or freight were lower may now be destroying contribution.
During the next quarter:
Reprice deliberately: Review your catalogue and client agreements, then test a controlled price increase where the value and demand support it.
Remove bad discounts: Stop approving discounts that take an order below its full cost to serve.
Quote from contribution: Show direct cost, delivery time, overhead allocation and target profit before sending a proposal.
The metric to watch is gross margin by product, client or job, not only the blended business result. A business can hide a loss-making service inside a profitable average.
Reduce direct cost without damaging delivery
For inventory businesses, review supplier terms, rebates, minimum orders, freight and landed cost. For trades and manufacturing, check whether estimates recover labour, materials, rework and site time.
A 90-day procurement review should identify the inputs that consume the most cash, obtain alternate quotes and compare the supplier's full delivered cost. Don't chase a cheaper unit price if it creates defects, delays or returns. The right outcome is a lower reliable cost to serve.
Remove operating waste
Pull every recurring expense from Xero or your bank feed and classify it by purpose. Software subscriptions, contractor spend, rent, insurance and payment fees should each have an owner and a reason to remain.
Automate repetitive invoicing and approvals where the control is sound. A focused review of how to boost profits with efficiency can help identify process waste, but don't buy another tool until you know which manual step is costing you time.
Improve mix and collection
Some customers, products and projects are structurally less profitable. Rank them by contribution and cash behaviour, then decide whether to reprice, redesign, bundle or exit.
Useful actions for the quarter include:
Lift average order value: Bundle complementary products or introduce sensible minimum order values.
Tighten quote to collect: Put deposits, milestones and payment terms into the proposal before work starts.
Drop low-contribution work: Free capacity for customers and services that produce a stronger return.
Review client profitability: Include meetings, revisions, travel, support and payment delays in the calculation.
Use value-based pricing strategy when the customer's outcome is worth more than the hours or materials used to deliver it.
The exact lift will depend on your starting point, cost structure and customer response. Don't promise yourself a percentage improvement before you've measured the baseline. Set a specific margin goal, implement one change, and verify the result in the next monthly close.
Connecting Margin to Cash Flow and the KPIs That Matter
A margin becomes useful when it helps you decide whether the business can fund payroll, tax, suppliers, debt and reinvestment. A profitable business can still run short of cash if customers pay slowly or stock sits unsold.
A trades business collecting invoices on long terms can experience more pressure than an ecommerce business collecting payment at checkout, even if both report the same net margin. The accounting percentage is identical, but the timing of cash inflows and outflows is not.
Track these measures monthly:
KPI | Healthy range | Watch for | Action if breached |
|---|---|---|---|
Gross margin percentage | Stable against your approved budget and peer benchmark | Falling margin by SKU, client or job | Recheck pricing, discounts, supplier cost and wastage |
Operating margin percentage | Consistent after wages and overheads | Revenue rises while operating profit stalls | Review labour utilisation, subscriptions, rent and marketing |
Net margin percentage | Above your relevant Australian size and sector reference point | Profit is thin or volatile | Reforecast, reprice and test the cost base |
Debtor days | Within agreed customer terms | Collections move materially beyond terms | Call overdue accounts, tighten credit and change payment milestones |
Stock turn | Consistent with the product cycle | Old stock and slower movement | Stop replenishment, clear aged stock and reset purchasing |
Cash conversion cycle | Stable or improving | Cash remains tied up for longer | Coordinate collections, supplier terms and inventory buying |
Don't adopt arbitrary “healthy” numbers without understanding your model. The meaningful benchmark is your approved operating plan, customer terms and historic trend, then the Australian peer data where it matches.
For an Australian SME, a monthly dashboard should show the three margin lines beside accounts receivable, inventory, accounts payable and cash at bank. If net margin improves while debtor days and stock balances worsen, you haven't solved the cash problem. You've shifted it into the balance sheet.
Margin without cash conversion is an accounting illusion. The business survives on collected cash, not reported intention.
Building a Margin Discipline That Lasts
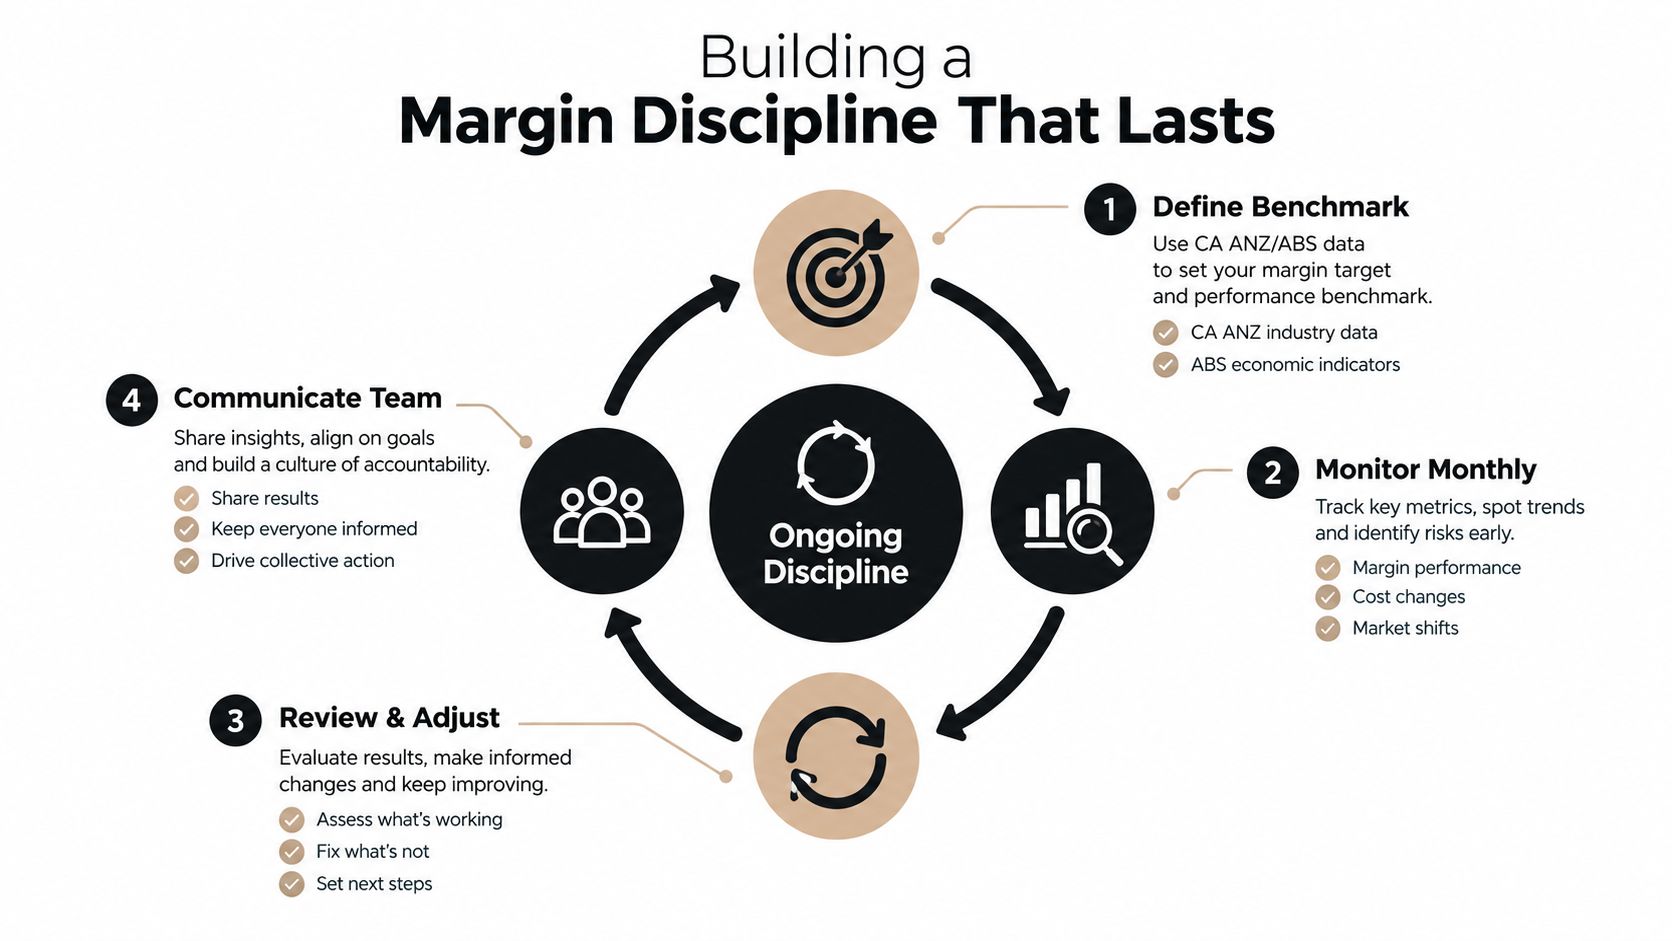
A good margin isn't a once-a-year number discovered during tax preparation. It's a management discipline that connects pricing, delivery, staffing, purchasing and collections.
Start by selecting a benchmark that fits your size and operating model. CA ANZ provides a useful Australian reference, while the ABS and FWC operating-profit framework helps you compare operating performance more consistently. Treat the RBA's small-business margin observations as context, not as a target detached from your own cost structure.
Then install a simple operating rhythm:
Close monthly: Review gross, operating and net margin using the same definitions every month.
Investigate movement: Explain changes by product, customer, team, supplier and expense category.
Review pricing quarterly: Check whether prices still cover current cost to serve and the value delivered.
Pair growth with margin: Reject sales plans that don't show contribution and collection timing.
Communicate the priorities: Make sure the team knows whether the current constraint is price, labour recovery, stock or debtor collection.
A one-page dashboard is enough if it contains the right information. Include revenue, gross margin, operating margin, net margin, debtor days, stock movement where relevant, cash at bank and the actions assigned to each variance.
Set an improvement objective that reflects your starting point and capacity. A mature business doesn't need an elaborate finance department to build discipline, but it does need an owner who reviews the numbers before approving more spending, hiring or discounting.
The answer to “what is a good profit margin?” is the margin that funds payroll, tax, debt service and reinvestment without constant stress. For most Australian SMEs, 6% to 7% net margin is a practical normal benchmark, but your real target must reflect your sector, size, risk and ambitions. Stop chasing revenue as the headline result. Manage the margin that remains and the cash that arrives.
If your margins look acceptable but cash still feels tight, visit Nexist for practical support with forecasting, KPI reporting, pricing, inventory, receivables and cash-flow management. The team can help turn your monthly accounts into a clear action plan, so you know which leaks to fix before approving the next round of growth.
profit margin, gross margin, net margin, margin benchmarks, cash flow

" width="24px"/><g d="M 0 24.129 L 0 0.129 L 24 0.129 L 24 24.129 Z M 0 24.129 L 0 0.129 L 24 0.129 L 24 24.129 Z M 24 3 C 24 1.344 22.656 0 21 0 L 3 0 C 1.344 0 0 1.344 0 3 L 0 21 C 0 22.656 1.344 24 3 24 L 21 24 C 22.656 24 24 22.656 24 21 Z M 6.883 8.375 L 2.863 8.375 L 2.863 20.467 L 6.883 20.467 Z M 4.899 2.545 C 3.524 2.545 2.625 3.449 2.625 4.634 C 2.625 5.795 3.496 6.724 4.846 6.724 L 4.872 6.724 C 6.273 6.724 7.146 5.795 7.146 4.634 C 7.12 3.449 6.274 2.545 4.899 2.545 Z M 16.747 8.09 C 14.614 8.09 13.659 9.263 13.124 10.086 L 13.124 8.374 L 9.105 8.374 C 9.159 9.508 9.105 20.466 9.105 20.466 L 13.124 20.466 L 13.124 13.713 C 13.124 13.352 13.15 12.99 13.257 12.732 C 13.547 12.01 14.209 11.262 15.319 11.262 C 16.773 11.262 17.355 12.372 17.355 13.996 L 17.355 20.466 L 21.374 20.466 L 21.374 13.532 C 21.374 9.818 19.391 8.09 16.747 8.09 Z" fill="transparent" height="24.12890599668026px" id="dSFdkJotL" width="24px"><path d="M 0 24 L 0 0 L 24 0 L 24 24 Z" fill="transparent" height="24px" id="wscNJE44G" transform="translate(0 0.129)" width="24px"/><g d="M 0 24.129 L 0 0.129 L 24 0.129 L 24 24.129 Z M 24 3 C 24 1.344 22.656 0 21 0 L 3 0 C 1.344 0 0 1.344 0 3 L 0 21 C 0 22.656 1.344 24 3 24 L 21 24 C 22.656 24 24 22.656 24 21 Z M 6.883 8.375 L 2.863 8.375 L 2.863 20.467 L 6.883 20.467 Z M 4.899 2.545 C 3.524 2.545 2.625 3.449 2.625 4.634 C 2.625 5.795 3.496 6.724 4.846 6.724 L 4.872 6.724 C 6.273 6.724 7.146 5.795 7.146 4.634 C 7.12 3.449 6.274 2.545 4.899 2.545 Z M 16.747 8.09 C 14.614 8.09 13.659 9.263 13.124 10.086 L 13.124 8.374 L 9.105 8.374 C 9.159 9.508 9.105 20.466 9.105 20.466 L 13.124 20.466 L 13.124 13.713 C 13.124 13.352 13.15 12.99 13.257 12.732 C 13.547 12.01 14.209 11.262 15.319 11.262 C 16.773 11.262 17.355 12.372 17.355 13.996 L 17.355 20.466 L 21.374 20.466 L 21.374 13.532 C 21.374 9.818 19.391 8.09 16.747 8.09 Z" fill="transparent" height="24.12890599668026px" id="sTpjGo1tb" width="24px"><path d="M 0 24 L 0 0 L 24 0 L 24 24 Z" fill="transparent" height="24px" id="s7ffpmKOD" transform="translate(0 0.129)" width="24px"/><g d="M 24 3 C 24 1.344 22.656 0 21 0 L 3 0 C 1.344 0 0 1.344 0 3 L 0 21 C 0 22.656 1.344 24 3 24 L 21 24 C 22.656 24 24 22.656 24 21 Z M 6.883 8.375 L 2.863 8.375 L 2.863 20.467 L 6.883 20.467 Z M 4.899 2.545 C 3.524 2.545 2.625 3.449 2.625 4.634 C 2.625 5.795 3.496 6.724 4.846 6.724 L 4.872 6.724 C 6.273 6.724 7.146 5.795 7.146 4.634 C 7.12 3.449 6.274 2.545 4.899 2.545 Z M 16.747 8.09 C 14.614 8.09 13.659 9.263 13.124 10.086 L 13.124 8.374 L 9.105 8.374 C 9.159 9.508 9.105 20.466 9.105 20.466 L 13.124 20.466 L 13.124 13.713 C 13.124 13.352 13.15 12.99 13.257 12.732 C 13.547 12.01 14.209 11.262 15.319 11.262 C 16.773 11.262 17.355 12.372 17.355 13.996 L 17.355 20.466 L 21.374 20.466 L 21.374 13.532 C 21.374 9.818 19.391 8.09 16.747 8.09 Z" fill="transparent" height="24.000006px" id="D0ecaHEcW" transform="translate(0 0)" width="24px"><path d="M 24 3 C 24 1.344 22.656 0 21 0 L 3 0 C 1.344 0 0 1.344 0 3 L 0 21 C 0 22.656 1.344 24 3 24 L 21 24 C 22.656 24 24 22.656 24 21 Z" fill="rgb(55, 184, 218)" height="24.000006px" id="IPLFE6zXx" width="24px"/><path d="M 4.02 0 L 0 0 L 0 12.092 L 4.02 12.092 Z" fill="rgb(255, 255, 255)" height="12.09201px" id="FWhtzAyuY" transform="translate(2.863 8.375)" width="4.02px"/><path d="M 2.274 0 C 0.899 0 0 0.904 0 2.089 C 0 3.25 0.871 4.179 2.221 4.179 L 2.247 4.179 C 3.648 4.179 4.521 3.25 4.521 2.089 C 4.495 0.904 3.649 0 2.274 0 Z" fill="rgb(255, 255, 255)" height="4.17876px" id="VmOsKv4kO" transform="translate(2.625 2.545)" width="4.52095px"/><path d="M 7.641 0 C 5.509 0 4.554 1.173 4.019 1.996 L 4.019 0.284 L 0 0.284 C 0.053 1.419 0 12.376 0 12.376 L 4.019 12.376 L 4.019 5.623 C 4.019 5.262 4.045 4.9 4.151 4.642 C 4.442 3.92 5.103 3.172 6.214 3.172 C 7.667 3.172 8.25 4.282 8.25 5.907 L 8.25 12.376 L 12.269 12.376 L 12.269 5.442 C 12.269 1.728 10.286 0 7.641 0 Z" fill="rgb(255, 255, 255)" height="12.37626px" id="n1XUbhaq0" transform="translate(9.105 8.09)" width="12.268830000000001px"/></g></g></g></g></svg>)