
How to Calculate Gross Profit Margin & Stop Cash Leaks
Learn how to calculate gross profit margin with our step-by-step guide for AU businesses. Includes formulas, examples, and tips to improve your profitability.
Ansh Malhotra

You're probably looking at a sales report that says the business is moving. Orders are going out, jobs are getting invoiced, revenue looks respectable, and yet the bank balance keeps feeling tight. Payroll lands, supplier bills stack up, BAS is around the corner, and somehow the business that looks busy on paper doesn't feel cash-rich in real life.
That usually isn't a revenue problem. It's a margin visibility problem.
Founders often track sales first and profit second. The trouble is that gross profit margin tells you whether each sale is leaving enough behind to fund wages, rent, software, debt, tax, and growth. If that number is wrong, every decision built on it is shaky. Pricing looks better than it is. Inventory looks healthier than it is. Expansion feels affordable when it isn't.
If you want to regain control, you need more than the textbook formula. You need the true gross profit margin. That means calculating it properly, then finding the hidden costs that make reported margins look fine while cash leaks out of the business.
Table of Contents
Why Your Revenue Is High But Your Bank Balance Is Low
A common pattern looks like this. A founder finishes the month with strong top-line sales, then opens Xero or QuickBooks and sees a result that doesn't match the effort. There's movement everywhere, but no breathing room. The team is flat out and the cash position is still tense.
That gap usually sits in the space between revenue and gross profit.
A retailer can sell plenty and still lose cash if freight-in, damaged stock, and discounting aren't captured properly. A trade business can stay booked out and still underperform if fuel surcharges, consumables, and job-specific labour drift below the line. A manufacturer can think margins are stable while overtime, scrap, and poor inventory records distort the picture.
Gross profit margin is often the first clean answer to the question founders keep asking: “Where is the money actually going?”
Your bank balance is shaped by more than volume. It's shaped by what each sale leaves behind after direct costs. If you don't know that number with confidence, it's hard to fix pricing, stock turns, supplier terms, or capacity decisions.
The businesses that get traction here stop treating margin as a year-end accounting metric. They use it as an operating control. They review it often, compare it by product or job type, and connect it to working capital. If you also want a broader cash lens, this guide to the cash conversion cycle is useful because margin and timing usually interact.
What this looks like in real life
High sales, low cash: You're making revenue, but direct costs are chewing through too much of each dollar.
Busy team, weak profit: Labour is productive on paper, but job costing misses materials, freight, or rework.
Strong reported margin, ongoing stress: The formula may be technically run, but the inputs are wrong.
When founders tell us “sales are fine, cash isn't,” gross profit margin is usually where the main diagnosis starts.
The Gross Profit Margin Formula Demystified
A founder can quote a 45% gross margin and still feel cash pressure every month. In our work, that usually means the formula was applied cleanly, but the inputs were not. Gross profit margin only helps if it reflects the actual economics of what you sold.
Gross Profit Margin = (Net Sales - COGS) / Net Sales × 100
That formula is straightforward. The judgement sits in two places. What counts as net sales, and what belongs in COGS.

Start with net sales, not top-line revenue
Use the sales number you kept.
Net sales equals total sales less returns, discounts, allowances, rebates, and credit notes. This matters in any business with promotions, wholesale deductions, customer claims, or post-sale adjustments. If those amounts stay in revenue, the margin result is overstated before you even look at costs.
A practical sequence looks like this:
Pull total sales for the period.
Subtract returns and credit notes.
Subtract discounts, rebates, and allowances.
Use the result as net sales.
One rule keeps founders out of trouble. If the customer did not pay the full selling price in economic terms, do not leave the full amount in revenue for margin reporting.
Get COGS right or your margin is fiction
COGS errors create a false sense of control. We see this most often in Australian SMEs that carry stock, run job-based delivery, or absorb service costs into overhead because it is easier in the accounting file.
The Australian Taxation Office guidance on trading stock and cost treatment draws a clear line between direct costs tied to goods sold and broader operating expenses. For margin purposes, include costs directly connected to producing, acquiring, or delivering what was sold. Keep rent, admin, and marketing below gross profit.
Usually included in COGS
Direct materials: inventory, components, ingredients, and job-specific materials
Direct labour: wages tied to production, installation, or service delivery
Freight-in and direct packaging: costs to get saleable stock ready for sale
Import and landed costs: duties or other direct acquisition costs where relevant
Usually excluded from COGS
Office rent and general occupancy
Marketing and advertising
Admin salaries and finance costs
Software used across the whole business
Insurance and other general overheads
The "true" gross profit margin starts to separate from the accounting version. If stock is misvalued, slow-moving inventory is left at unrealistic costs, or service businesses bury delivery labour in overhead, reported margin looks stronger than the business feels in cash terms. That is why inventory treatment matters. If your stock values are drifting, review these inventory valuation methods for SME reporting and decision-making.
For founders in consumer goods, channel deductions can distort margin even when the headline formula looks fine. Retailer charges, promo funding, and fulfilment complexity can turn a profitable-looking SKU into a weak channel result. This overview of master CPG channel economics is a useful companion if you sell across multiple routes to market.
The formula itself is not the problem. Cost classification, stock valuation, and revenue clean-up determine whether the number helps you make better decisions or just gives false comfort.
Calculating COGS for Your Business Model
A founder can sell $2 million a year and still price half their work too low because COGS is built for the wrong business model.
We see this often. Retail operators leave landed costs out. Trade businesses count materials but miss delivery labour, rework, and site travel. Manufacturers mix production costs with general factory overhead, then wonder why product margins move around without a clear reason.
The fix is to define COGS around how revenue is earned.
Typical COGS components by business type
Business Type | Includes in COGS | Excludes from COGS |
|---|---|---|
Retail and ecommerce | Purchase cost of inventory, freight-in, import-related direct costs, packaging directly tied to saleable stock | Warehouse rent, marketing, admin wages, ecommerce apps used across the business |
Trade and service | Direct labour on jobs, job-specific materials, consumables directly tied to delivery, relevant variable job costs | Office admin, quoting time not assigned as direct delivery, general vehicles overhead not allocated as direct cost |
Small manufacturing | Raw materials, direct labour, production-related direct costs tied to output | Corporate overhead, sales salaries, general admin, non-production occupancy costs |
Retail and ecommerce
In product businesses, COGS starts with the supplier invoice, but it should not end there.
A usable gross margin for decision-making usually includes:
purchase price from the supplier
freight-in and other inbound shipping costs
packaging required to make stock saleable
direct import costs such as duties and customs-related charges where relevant
The trade-off is simple. If you keep COGS too narrow, margin looks better than cash reality. If you push broad fulfilment or head-office costs into COGS, product profitability gets blurred and pricing decisions get worse.
Inventory discipline matters here. A clean stock file, consistent receipts, and timely write-downs do more for margin accuracy than another dashboard. If your stock numbers are drifting, review these inventory valuation methods for SME reporting and decision-making before you trust the gross profit line.
Trade and service businesses
For trade and service businesses, COGS is really the cost to deliver the job.
That usually means:
direct labour hours spent doing the work
materials and parts used on the job
consumables tied to delivery
travel or site costs that rise with each job
subcontractor costs linked to that revenue
predictable rework or call-back cost, where it is part of normal delivery
Many Australian SMEs leak cash. The quote includes labour and materials, but the actual job also includes travel time, small consumables, equipment wear, disposal fees, and occasional return visits. None of those costs are dramatic on their own. Across a month, they can wipe out the margin you thought you had.
A practical test we use with founders is this: if you sold one fewer job next month, would this cost fall as well? If yes, it likely belongs in cost of sale. If no, it is probably overhead.
Job-costing accuracy also depends on coding discipline. If supplier bills sit in the inbox for two weeks or get posted to generic accounts, direct costs disappear into overhead and job margin reporting becomes guesswork. Better processes help. If you are tightening finance operations, AI-driven AP workflow automation is worth a look because consistent bill capture makes direct-cost reporting far more reliable.
Small manufacturing
Manufacturing needs the clearest line of the three because small classification errors get repeated across every unit.
COGS usually includes:
raw materials consumed in production
direct production labour
batch-level or unit-level costs tied closely to output
production inputs that rise as volume rises
The judgment call is overhead. Factory rent, production supervision, maintenance, and utilities may be real costs of running the business, but they do not all belong in gross margin reporting the same way. The right answer depends on what decision you are trying to make.
For short-term pricing and product mix decisions, founders often need a tighter view of direct production cost first. For longer-term profitability analysis, some allocated production overhead may also matter. What matters most is consistency. If one month includes setup labour and the next month leaves it in overhead, your margin trend is no longer useful.
What works and what doesn't
What works
mapping direct costs by SKU, job, or batch
setting clear rules for freight, consumables, and subcontractors
reviewing cost coding monthly, not at year-end
tracing margin problems back to the operational source, such as stock shrinkage, rework, or underquoted labour
What doesn't
using one COGS rule across different revenue streams
relying on memory to assign labour after the month has closed
parking direct costs in miscellaneous expense accounts
treating reported margin as real margin without checking where cash is leaking
Founders rarely need a new formula. They need a cost map that shows the true gross profit margin by product, job, and batch.
Uncovering Hidden Costs That Erode Your Margin
A founder sees a 38% gross margin in the report, then wonders why cash is tight at the end of the month. In our work, that gap usually comes from costs sitting in the wrong place, or not being captured at all.
Reported margin and true margin are often different numbers.
The pattern is consistent across Australian SMEs. Inventory businesses miss stock losses, write-downs, and freight adjustments. Service and ecommerce businesses often bury delivery effort, rework, merchant fees, or fulfilment handling in overhead, then assume gross margin is healthy because the formula still works on paper.
This checklist captures the leaks that basic margin guides usually miss:

The inventory trap
The inventory trap starts when stock on the balance sheet no longer reflects what you can sell.
Obsolete items, damaged units, expired inputs, shrinkage, and supplier quality issues all reduce real gross profit. If those losses stay parked in inventory at full value, COGS is understated and margin looks stronger than it is. Founders then price too aggressively, reorder the wrong lines, and assume a product category is carrying the business when it is really leaking cash.
For inventory-heavy businesses, we want a month-end process that forces the issue:
Review slow-moving SKUs: Stock that has not moved for a defined period needs a valuation check.
Identify damaged, expired, or unsellable units: If it will not sell at full price, do not carry it at full cost.
Post write-downs in the month they are found: Delaying the adjustment only delays the decision.
Reconcile count variances to margin reports: If physical stock and system stock do not match, the reported margin is not reliable.
This matters most in businesses with long lead times or imported inventory. The cash goes out early, the accounting profit arrives later, and weak stock discipline hides the problem until the bank balance forces attention.
Hidden service costs
Service businesses have a different version of the same problem. The margin leak is usually time.
A job can look profitable at quote stage and still miss target margin once you include unbilled revisions, implementation support, client handover time, travel, warranty work, or senior staff fixing junior errors. If those costs sit in salaries or overhead with no job link, gross margin overstates what the work is delivering.
We see this a lot in agencies, trades, consulting, and hybrid product-service businesses. Revenue is booked cleanly. Labour leakage is not.
A practical test is simple. Compare quoted hours to delivered hours by job or client type. If one service line repeatedly needs extra effort to complete, the issue is rarely the formula. It is scope control, pricing, or delivery efficiency. That is usually the point where a value-based pricing strategy for growing SMEs becomes more useful than another round of small cost cuts.
The COGS inflation error
The opposite mistake also creates bad decisions. Some founders push too many costs into COGS and depress margin artificially.
Broad warehouse overhead, general storage, admin support, software subscriptions, and business-wide operations costs should not all sit in gross margin reporting. If they do, you can end up treating a viable product line as unprofitable, cutting the wrong SKU, or discounting to chase volume that was never the issue.
For ecommerce businesses, fulfilment economics need particular care. Pick-and-pack costs tied directly to each order may belong in your direct cost view. General warehousing overhead usually does not. If your team sells through Amazon or a similar channel, the practical benchmarks in Online Brand Growth FBA insights are useful for separating channel-specific direct costs from broader operating spend.
Gross margin should answer one question clearly. What did it cost to deliver this sale, product, or job? If the cost exists whether or not that sale happened, test it carefully before pushing it into COGS.
A short explainer can help if your team needs a visual walkthrough of the concept:
A simple sheet formula you can use
You do not need complex software to pressure-test your numbers. A plain spreadsheet is enough if the coding rules are clear.
Use fields like:
Net Sales
Opening Inventory
Purchases
Freight-In
Direct Labour
Closing Inventory
Stock Write-Downs
Then calculate:
COGS = Opening Inventory + Purchases + Freight-In + Direct Labour - Closing Inventory + Stock Write-Downs
Gross Profit = Net Sales - COGS
Gross Profit Margin = Gross Profit / Net Sales
Keep the model simple. The core work is not in spreadsheet design. It is in getting every recurring cash leak into the right line so your gross profit margin reflects how the business earns money.
How to Analyse and Improve Your Gross Profit Margin
A founder sees strong sales in the monthly report, then opens the bank account and wonders where the cash went. Gross profit margin analysis should answer that question fast.
Once you have a margin number that reflects reality, the job is to test whether it is commercially strong enough for your model. A healthy margin is not the same in every business. An importer carrying slow stock, a trade business with rework, and an ecommerce brand paying marketplace fees can all post the same headline margin and have very different cash outcomes.
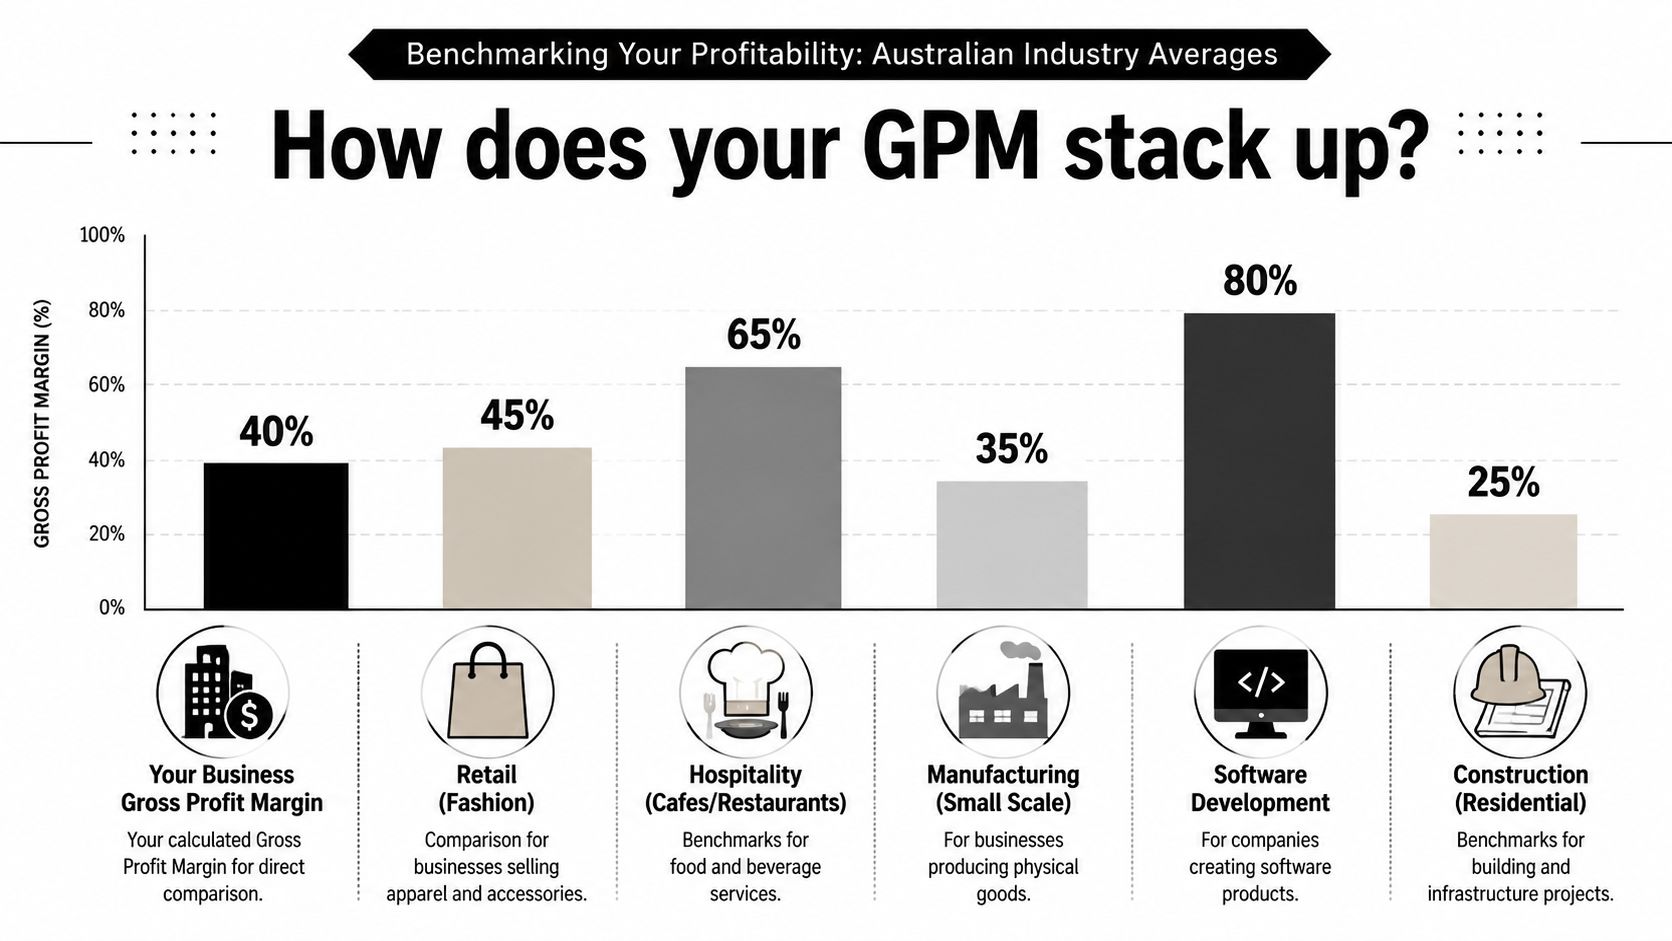
Use benchmarks carefully
Industry benchmarks are a reference point, not a pricing strategy.
If your margin sits below peers, do not stop at "we need to sell more." Check whether the problem is price, product mix, delivery cost, or bad cost capture. In Australian SMEs, we often find the underlying issue is hidden inside the inventory trap or service delivery leakage. Stock arrives, cash leaves, sales look fine, and margin still disappoints because write-downs, rush freight, warranty claims, or unbilled labour never made it into the true cost of sale.
A high-looking margin also needs scrutiny. It can mean strong pricing power. It can also mean returns are understated, direct labour is missing, or old stock is still sitting on the balance sheet at values no buyer would pay.
Use a few hard questions:
Which product lines or jobs create the most gross profit dollars, not just the best percentage margin?
Where does margin drop after discounts, remakes, freight surprises, or fulfilment fees?
Which customers buy profitable work, and which ones create admin and delivery drag?
How much cash is tied up in stock that is technically "profitable" on paper but moving too slowly to fund the business?
What to change when margin is too thin
There are four levers worth pulling, and each comes with trade-offs.
Fix pricing where complexity is high: Start with the offers that absorb more labour, more support, or more customisation than your quote assumes. A small price increase on the wrong SKU will not save margin. Rebuilding price around cost-to-serve usually does more. If you need to rethink how you set price in the first place, our guide to value-based pricing strategy is the right next step.
Reduce direct cost creep: Supplier increases, packaging changes, inbound freight, and wastage often creep in without anyone resetting target margins. Good operators review these line by line. They do not wait for year-end accounts to reveal the damage.
Improve mix, not just volume: More revenue from weak-margin products can put extra pressure on cash and operations. We regularly advise founders to push the offers that generate stronger gross profit with less delivery friction, and redesign or drop the ones that consume working capital. If you sell through marketplaces, channel-level tools like these Online Brand Growth FBA insights help test margin after fulfilment and platform costs.
Stop leakage at the source: Rework, spoilage, inaccurate picking, underquoted jobs, and urgent freight all hit gross profit before overhead is even considered. These are operating habits, not accounting issues. They need process fixes, ownership, and weekly review.
The fastest improvement usually comes from better discipline, not a heroic sales target.
Review margin in layers
Monthly margin review is the minimum. Weekly is better when input costs move fast or stock turns are tight.
Review gross profit in layers:
By month to catch deterioration early
By product, service line, or job type to find where margin is being lost
By customer or channel to expose discounting, fulfilment complexity, or support-heavy accounts
By cash impact to separate profitable sellers from stock or jobs that absorb working capital
That last layer matters. Founders often focus on percentage margin and miss the cash story underneath. A product can show an acceptable gross margin and still hurt the business if it ties up cash in slow inventory, creates frequent returns, or needs too much handling.
Gross profit margin becomes useful when it changes decisions. It should tell you what to reprice, what to stop selling, what to buy differently, and where cash is leaking out of an otherwise busy business.
Common Margin Calculation Pitfalls and FAQs
Most gross margin mistakes aren't mathematical. They're classification mistakes, timing mistakes, or reporting shortcuts that get repeated until everyone trusts the wrong number.
Fast list of mistakes
Mixing COGS and overheads: Storage and warehousing fees are a common example. As noted earlier, many ecommerce businesses put these into COGS when they belong in operating expenses.
Ignoring returns and allowances: Using gross sales instead of net sales overstates the result.
Leaving out stock write-downs: Margin looks healthy while dead stock builds.
Using rough labour estimates: Trade and service businesses often understate delivery cost when time isn't allocated cleanly.
FAQs
What is a good gross profit margin for my industry?
It depends on your model, pricing power, and delivery structure. Use industry ranges as context, then compare against your own history, product mix, and cash needs.
How is gross profit different from net profit?
Gross profit is revenue minus direct costs. Net profit sits further down the P&L after operating expenses, finance costs, tax, and other non-direct items are accounted for.
How often should I calculate gross profit margin?
Monthly is the minimum for most SMEs. If you're inventory-heavy, project-based, or dealing with volatile input costs, more frequent review gives you earlier warning.
What's the most common ecommerce mistake?
Misclassifying storage costs. The earlier Salesforce reference noted that 42% of ecommerce businesses incorrectly treat storage warehousing fees as COGS, which artificially depresses margins by 5.3%.
Can I calculate gross profit margin in a spreadsheet?
Yes. For many SMEs, a disciplined spreadsheet works well if inventory, labour, and direct cost coding are accurate.
If you want a second set of eyes on your numbers, Nexist helps Australian founders find the actual margin, fix cash leaks, and build reporting that leads to better decisions. If your business feels busy but cash still feels tight, that usually isn't random. It's a signal.
gross profit margin, calculate gross profit, business profitability, cogs formula, financial metrics

" width="24px"/><g d="M 0 24.129 L 0 0.129 L 24 0.129 L 24 24.129 Z M 0 24.129 L 0 0.129 L 24 0.129 L 24 24.129 Z M 24 3 C 24 1.344 22.656 0 21 0 L 3 0 C 1.344 0 0 1.344 0 3 L 0 21 C 0 22.656 1.344 24 3 24 L 21 24 C 22.656 24 24 22.656 24 21 Z M 6.883 8.375 L 2.863 8.375 L 2.863 20.467 L 6.883 20.467 Z M 4.899 2.545 C 3.524 2.545 2.625 3.449 2.625 4.634 C 2.625 5.795 3.496 6.724 4.846 6.724 L 4.872 6.724 C 6.273 6.724 7.146 5.795 7.146 4.634 C 7.12 3.449 6.274 2.545 4.899 2.545 Z M 16.747 8.09 C 14.614 8.09 13.659 9.263 13.124 10.086 L 13.124 8.374 L 9.105 8.374 C 9.159 9.508 9.105 20.466 9.105 20.466 L 13.124 20.466 L 13.124 13.713 C 13.124 13.352 13.15 12.99 13.257 12.732 C 13.547 12.01 14.209 11.262 15.319 11.262 C 16.773 11.262 17.355 12.372 17.355 13.996 L 17.355 20.466 L 21.374 20.466 L 21.374 13.532 C 21.374 9.818 19.391 8.09 16.747 8.09 Z" fill="transparent" height="24.12890599668026px" id="dSFdkJotL" width="24px"><path d="M 0 24 L 0 0 L 24 0 L 24 24 Z" fill="transparent" height="24px" id="wscNJE44G" transform="translate(0 0.129)" width="24px"/><g d="M 0 24.129 L 0 0.129 L 24 0.129 L 24 24.129 Z M 24 3 C 24 1.344 22.656 0 21 0 L 3 0 C 1.344 0 0 1.344 0 3 L 0 21 C 0 22.656 1.344 24 3 24 L 21 24 C 22.656 24 24 22.656 24 21 Z M 6.883 8.375 L 2.863 8.375 L 2.863 20.467 L 6.883 20.467 Z M 4.899 2.545 C 3.524 2.545 2.625 3.449 2.625 4.634 C 2.625 5.795 3.496 6.724 4.846 6.724 L 4.872 6.724 C 6.273 6.724 7.146 5.795 7.146 4.634 C 7.12 3.449 6.274 2.545 4.899 2.545 Z M 16.747 8.09 C 14.614 8.09 13.659 9.263 13.124 10.086 L 13.124 8.374 L 9.105 8.374 C 9.159 9.508 9.105 20.466 9.105 20.466 L 13.124 20.466 L 13.124 13.713 C 13.124 13.352 13.15 12.99 13.257 12.732 C 13.547 12.01 14.209 11.262 15.319 11.262 C 16.773 11.262 17.355 12.372 17.355 13.996 L 17.355 20.466 L 21.374 20.466 L 21.374 13.532 C 21.374 9.818 19.391 8.09 16.747 8.09 Z" fill="transparent" height="24.12890599668026px" id="sTpjGo1tb" width="24px"><path d="M 0 24 L 0 0 L 24 0 L 24 24 Z" fill="transparent" height="24px" id="s7ffpmKOD" transform="translate(0 0.129)" width="24px"/><g d="M 24 3 C 24 1.344 22.656 0 21 0 L 3 0 C 1.344 0 0 1.344 0 3 L 0 21 C 0 22.656 1.344 24 3 24 L 21 24 C 22.656 24 24 22.656 24 21 Z M 6.883 8.375 L 2.863 8.375 L 2.863 20.467 L 6.883 20.467 Z M 4.899 2.545 C 3.524 2.545 2.625 3.449 2.625 4.634 C 2.625 5.795 3.496 6.724 4.846 6.724 L 4.872 6.724 C 6.273 6.724 7.146 5.795 7.146 4.634 C 7.12 3.449 6.274 2.545 4.899 2.545 Z M 16.747 8.09 C 14.614 8.09 13.659 9.263 13.124 10.086 L 13.124 8.374 L 9.105 8.374 C 9.159 9.508 9.105 20.466 9.105 20.466 L 13.124 20.466 L 13.124 13.713 C 13.124 13.352 13.15 12.99 13.257 12.732 C 13.547 12.01 14.209 11.262 15.319 11.262 C 16.773 11.262 17.355 12.372 17.355 13.996 L 17.355 20.466 L 21.374 20.466 L 21.374 13.532 C 21.374 9.818 19.391 8.09 16.747 8.09 Z" fill="transparent" height="24.000006px" id="D0ecaHEcW" transform="translate(0 0)" width="24px"><path d="M 24 3 C 24 1.344 22.656 0 21 0 L 3 0 C 1.344 0 0 1.344 0 3 L 0 21 C 0 22.656 1.344 24 3 24 L 21 24 C 22.656 24 24 22.656 24 21 Z" fill="rgb(55, 184, 218)" height="24.000006px" id="IPLFE6zXx" width="24px"/><path d="M 4.02 0 L 0 0 L 0 12.092 L 4.02 12.092 Z" fill="rgb(255, 255, 255)" height="12.09201px" id="FWhtzAyuY" transform="translate(2.863 8.375)" width="4.02px"/><path d="M 2.274 0 C 0.899 0 0 0.904 0 2.089 C 0 3.25 0.871 4.179 2.221 4.179 L 2.247 4.179 C 3.648 4.179 4.521 3.25 4.521 2.089 C 4.495 0.904 3.649 0 2.274 0 Z" fill="rgb(255, 255, 255)" height="4.17876px" id="VmOsKv4kO" transform="translate(2.625 2.545)" width="4.52095px"/><path d="M 7.641 0 C 5.509 0 4.554 1.173 4.019 1.996 L 4.019 0.284 L 0 0.284 C 0.053 1.419 0 12.376 0 12.376 L 4.019 12.376 L 4.019 5.623 C 4.019 5.262 4.045 4.9 4.151 4.642 C 4.442 3.92 5.103 3.172 6.214 3.172 C 7.667 3.172 8.25 4.282 8.25 5.907 L 8.25 12.376 L 12.269 12.376 L 12.269 5.442 C 12.269 1.728 10.286 0 7.641 0 Z" fill="rgb(255, 255, 255)" height="12.37626px" id="n1XUbhaq0" transform="translate(9.105 8.09)" width="12.268830000000001px"/></g></g></g></g></svg>)