
Working Capital Cycle: Free Trapped Cash for SMEs
Learn how Australian SMEs can optimise the working capital cycle to unlock trapped cash and improve liquidity in 2026.
Ansh Malhotra

Australia's median cash conversion cycle reached 71 days in FY24, up from 58 days in FY21, before improving to 62 days in FY25, based on analysis of more than 500 Australian public companies (KPMG's Australian working capital trends). That gap is more than an accounting ratio. It represents cash sitting in stock, waiting in customer accounts, or leaving the bank before suppliers need to be paid.
For Australian SMEs, the pattern is familiar. Sales rise, gross profit looks acceptable, yet the bank balance stays stubbornly flat. The working capital cycle explains why. It shows how long the business funds the journey from paying for inventory or delivering work to collecting cash from the customer.
Table of Contents
Why Australian Businesses Are Losing Millions to Working Capital Drag
A company can report a profit and still run short of cash. The gap appears when stock is purchased, wages and freight are paid, and customer invoices are issued well before those invoices are settled. The working capital cycle measures how long the business funds that operating journey.
KPMG's review of Australian public companies found the median cash conversion cycle rose from 58 days in FY21 to 71 days in FY24, then fell to 62 days in FY25 (KPMG's analysis). The FY25 snapshot recorded median DSO of 46 days, DIO of 68 days and DPO of 52 days. Receivables and inventory therefore held cash longer than supplier terms released it.
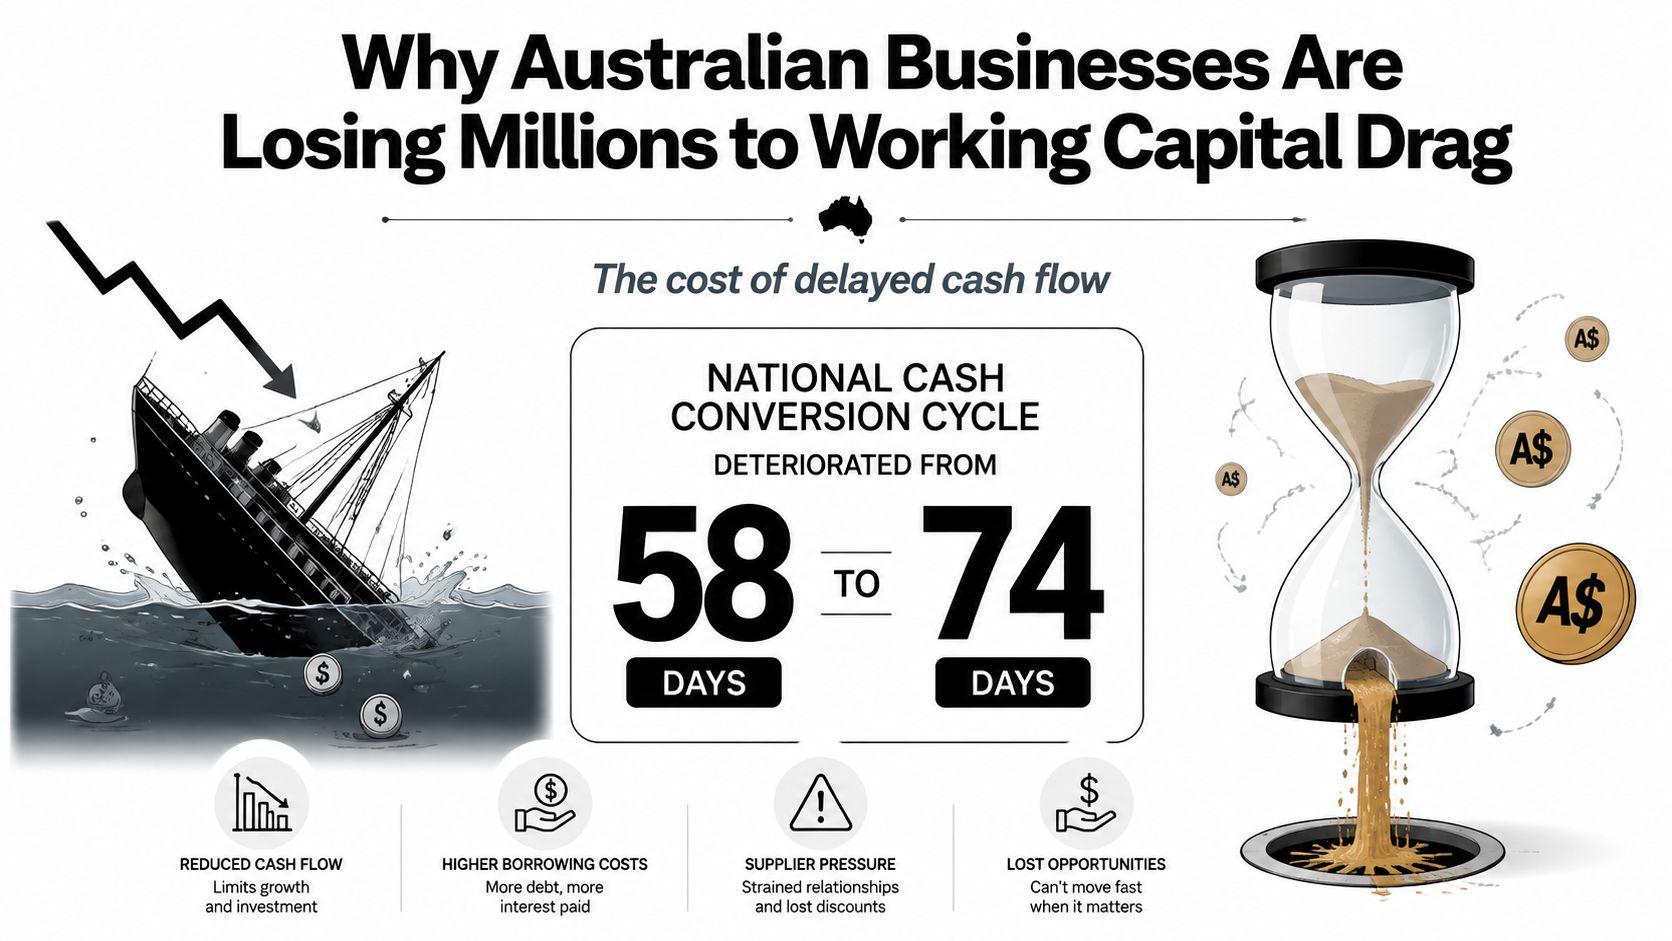
The public-company median is a warning, not an SME forecast. A Melbourne-based distributor with $400k in inventory and $180k in overdue invoices can have healthy sales and still face a severe funding squeeze. If stock turns slowly while customers pay late, growth increases the cash requirement before it improves the bank balance.
Stock depth is often the quietest cash drain
Receivables appear in an aged debtor report, so a founder can see which customers owe money and for how long. Inventory is harder to challenge. It remains an asset on the balance sheet, but slow-moving stock is cash parked in products that may not sell soon, or may need discounting.
Australian working capital analysis reported that a 0.4-day increase in average Days Working Capital locked up an additional $754 million across the companies reviewed (Octet's Australian working capital analysis). The same review found 57% of total companies experienced an increase in net working capital in FY23, so more cash was absorbed by operations rather than released.
Practical rule: Revenue growth is not self-funding when the business buys stock well before customers pay.
Use a 90-day cash review to expose the drag. Start with an inventory ageing report, rank items by weeks since sale and cash value, then compare purchase quantities with actual demand. Review the receivables ledger beside promised payment dates, not only invoice due dates. A deeper buy may protect availability, but it also raises exposure to softer demand, obsolete products and excess variants. Each item must justify its place in the cash cycle.
The Working Capital Cycle Formula Explained
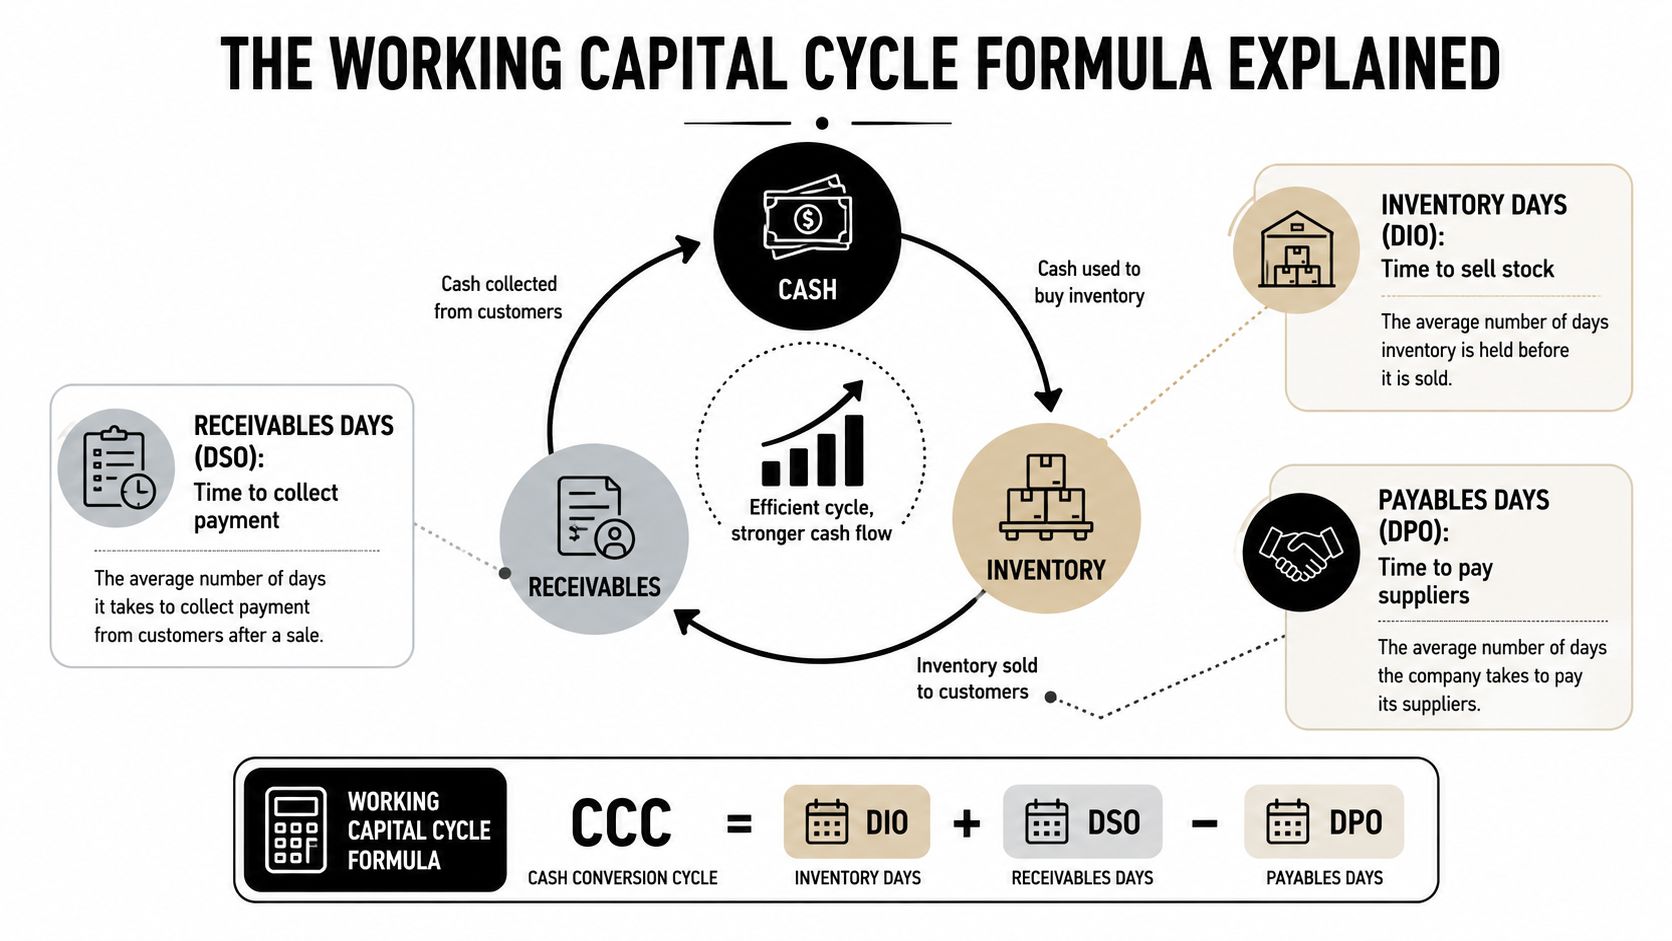
The formula is straightforward:
CCC = DIO + DSO - DPO
Each component measures a different part of the journey. Looking only at the final number can hide the operational problem, so calculate all three.
DIO measures how long stock stays in the business
Days Inventory Outstanding, or DIO, estimates how many days inventory remains unsold. Use average inventory, rather than a single closing balance where possible, and divide it by cost of goods sold for the period, then multiply by the number of days in that period.
A high DIO may indicate slow-moving products, excessive safety stock, large purchase batches or unreliable demand planning. A lower DIO generally releases cash, but reducing it too aggressively can damage availability. The calculation tells you where to investigate, not which stock to cut automatically.
DSO measures the wait for customer cash
Days Sales Outstanding, or DSO, measures the average time between a credit sale and collection. Divide average accounts receivable by the relevant credit sales, then apply the number of days in the period.
A business with card payments may have limited receivables, while a wholesale operation can carry substantial customer-funded credit. Review DSO alongside the ageing profile. An acceptable average can conceal a small group of overdue accounts creating most of the pressure.
DPO shows how much supplier timing helps
Days Payable Outstanding, or DPO, estimates how long the business takes to pay suppliers. Divide average accounts payable by cost of goods sold, then apply the period length.
DPO isn't an invitation to pay late. It shows whether the business is using the payment terms it has negotiated. Paying every invoice immediately can shorten the cycle unnecessarily, while paying after the due date can trigger loss of trust, reduced terms or supply disruption.
Suppose an Australian ecommerce business calculates DIO at 75 days, DSO at 8 days and DPO at 30 days. Its CCC is 53 days, because 75 plus 8 minus 30 equals 53. The important conclusion isn't just the total. Inventory is the dominant lever, so improving payment processing won't solve the main cash constraint.
Founders dealing with direct-to-consumer timing gaps may also find this resource useful for learning how to fix DTC cash flow timing gaps. For a broader explanation of the metric and its business implications, compare your calculation with the cash conversion cycle guide.
Working Capital Benchmarks for Australian SMEs
Benchmarks should prompt questions, not dictate targets. A retailer, manufacturer and electrical contractor can all have healthy businesses with very different working capital cycles because their inventory, billing and supplier arrangements work differently.
Australian public-company data provides a useful local reference point. In FY25, Australian retail businesses recorded average DWC of 41.2 days, but the improvement was driven mainly by a 4.1-day increase in DPO to 53.2 days. At the same time, DIO rose by 4.1 days to 112.8 days, with inventory holdings increasing by about 5% (McGrathNicol's FY25 working capital report).
That combination matters. Supplier terms can make the headline result look better while stock depth continues to consume cash. If demand slows, the business may have to discount products or carry the inventory for longer, reversing the apparent improvement.
Metric | Retail and Wholesale | Manufacturing | Service and Trade |
|---|---|---|---|
Main cash pressure | Inventory depth, customer credit and seasonal buying | Raw materials, work in progress and finished goods | Receivables, payroll timing and unbilled work |
DIO focus | SKU turns, ageing stock and purchase quantities | Production scheduling and batch sizes | Often limited, unless materials are held |
DSO focus | Wholesale accounts, trade customers and marketplace settlements | Project invoices, progress claims and account customers | Invoice issue dates, approvals and debtor follow-up |
DPO focus | Supplier terms and landed-cost timing | Component suppliers and production inputs | Subcontractors, software and operating vendors |
Healthy direction | Reduce slow stock without harming availability | Match production to demand and confirmed orders | Invoice promptly and collect to agreed terms |
Compare the business model, not just the number
Inventory-heavy businesses should start with DIO. A warehouse full of products that sell slowly can absorb more cash than a modest improvement in collections can recover. Service and trade businesses usually have less stock exposure, so DSO and work-in-progress controls deserve more attention.
Agriculture, food and beverage businesses show what disciplined inventory work can achieve. McGrathNicol reported that the sector improved average DWC by 18.3 days to 91.4 days, mainly by reducing DIO by 17.1 days to 127.4 days. The same report said sampled companies released $8.2 billion in locked-up cash by shortening their cycles (McGrathNicol's agriculture, food and beverage analysis).
The lesson for an SME isn't to copy a large-company benchmark. It's to identify which component dominates, then set an internal target that protects service levels and supplier confidence.
Spotting Cash Leaks in Your Business Operations
A wholesale distributor can lose cash in three ordinary places without making an obvious mistake. It buys too much stock, gives customers generous terms, and pays suppliers as soon as invoices arrive.
Take a distributor with a broad product catalogue and a warehouse team focused on avoiding stockouts. The purchasing manager orders extra units because a supplier offers a better batch price. Sales staff accept extended customer terms to win an account. Accounts payable then pays approved invoices immediately because the process is simple.
None of those decisions looks reckless in isolation. Together, they lengthen the working capital cycle and make the business fund its customers and inventory at the same time.
Leak one is stock that sells too slowly
Start with the inventory report, not the general ledger. Sort products by units sold, gross margin and the time since the last sale. The cash issue often sits in the long tail, where each item seems inexpensive but the combined balance is material.
Ask three questions:
What has stopped moving? Identify products with no recent sales and determine whether they need a promotion, return, bundle or write-down.
What is over-ordered? Compare purchase quantities with actual sell-through rather than relying on supplier discounts.
What is held for comfort? Separate genuine safety stock from stock kept because the business has always carried it.
Cutting every slow mover isn't the answer. A critical spare part may justify a low turnover because it protects an important customer relationship. The decision should connect inventory value to margin, service and replenishment risk.
Leak two is customer-funded credit
A customer that pays well beyond agreed terms is using the distributor's cash. Review the ageing report by customer, salesperson and invoice type, rather than relying on an average debtor figure. The accounts receivable ageing report guide can help structure that review.
The practical response might include deposits for customised orders, credit limits, staged billing or a collections call before the due date. Strong customers deserve a professional process too. Clear documentation and consistent follow-up protect the relationship better than an unexpected escalation after months of silence.
Leak three is voluntary supplier float
Paying early may be sensible when a discount exceeds the value of retaining cash, or when a strategic supplier needs certainty. Otherwise, schedule payment for the agreed due date and preserve the available float. That isn't the same as paying late. It's using the commercial terms already negotiated.
Rank the three leaks by cash released, customer impact and implementation effort. In most product businesses, stock depth deserves attention before a blanket collections campaign because it can affect a larger portion of the operating cycle.
Proven Strategies to Optimise Your Working Capital
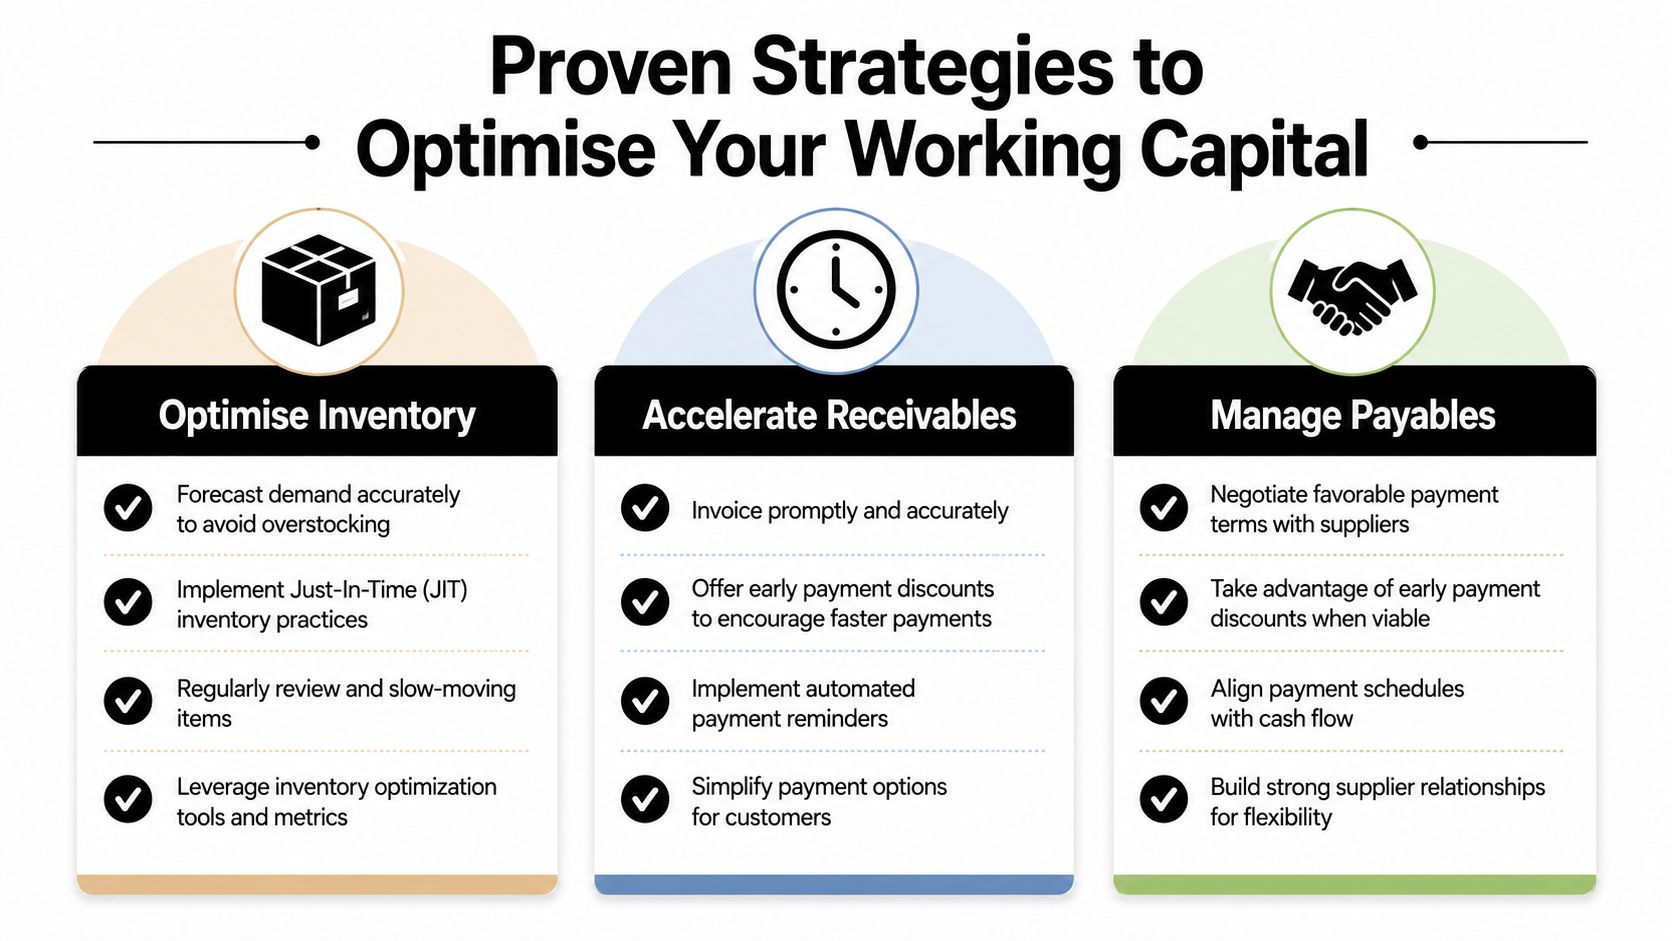
Optimisation works when the operational owner changes the behaviour that created the cash delay. A finance spreadsheet can identify the problem, but purchasing, sales, warehouse and accounts payable teams must change the underlying decisions.
Reduce inventory without damaging fulfilment
Begin with a SKU-level review. Classify products by movement, margin, strategic importance and replenishment reliability. A slow-moving product might be discontinued, bundled or ordered in smaller quantities, while a high-contribution product may justify deliberate safety stock.
Improve the buying rhythm before demanding a broad stock reduction. Ask suppliers about smaller purchase orders, split deliveries, minimum order changes and lead-time commitments. Better forecasting should use actual sell-through, promotions, seasonality and purchase order history, not a single optimistic sales plan.
The right inventory target is the lowest level that protects the customer promise, not the lowest balance the warehouse can tolerate.
The timeline depends on the lever. A stock freeze on weak items can start immediately, while supplier changes and forecasting improvements require repeated planning cycles. Measure DIO, aged stock value, stockouts, backorders and gross margin by SKU together.
Accelerate receivables through process discipline
Send invoices as soon as the contractual milestone is met. Make purchase order references, delivery evidence and payment instructions easy to find. For project work, use deposits and progress claims so the business isn't waiting until completion to bill the full value.
Give account managers ownership of disputed invoices. A collections team shouldn't chase a customer when the internal issue is a missing delivery record or an incorrect invoice. Early-payment discounts can help in selected cases, but calculate the cost against the cash benefit rather than offering them by default.
For businesses bridging inventory purchases and customer settlement, a practical guide to supply chain funding can add context to the financing decision. Funding should support a sound cycle, not conceal weak purchasing or collections.
Use payables terms without burning trust
Create a payment calendar that distinguishes due-date payments, early-payment opportunities and critical suppliers. Negotiate improved terms with evidence of reliable ordering and payment history. Suppliers are more receptive when the request supports a predictable purchasing relationship rather than a one-sided cash grab.
Automated approval and payment workflows can prevent both early and late payments. Australian SMEs reviewing this lever may also benefit from an overview of accounts payable automation in Australia.
Your 90-Day Working Capital Improvement Roadmap
A 90-day programme should create visibility first, then change the decisions producing the delay. Don't begin with a complicated dashboard if the business can't agree on its inventory balance, overdue invoices or supplier terms.
Month one builds the baseline
Pull trailing financial data and calculate DIO, DSO, DPO and CCC. Reconcile the numbers to the balance sheet, then segment them by product category, customer group and supplier where the systems allow it.
Set a weekly cash meeting with one owner for each lever. The dashboard should include:
Inventory: Stock value, aged stock, purchase orders due and stockouts.
Receivables: Current invoices, overdue invoices, disputes and promised payment dates.
Payables: Due invoices, available terms, critical suppliers and scheduled payments.
Cash outlook: A rolling 13-week view showing expected receipts, purchases, payroll, tax and debt commitments.
The first month should also pause unnecessary buying, issue outstanding invoices and contact material overdue accounts. These actions create a cleaner baseline before larger policy changes begin.
Month two accelerates the highest-value lever
Choose one dominant constraint. If DIO is the problem, review the slowest products, cancel or defer suitable purchase orders and test smaller replenishment batches. If DSO dominates, tighten credit approval, introduce milestone billing and assign dispute resolution to named people.
If DPO is unusually short, map supplier terms against actual payment dates. Ask strategic suppliers for revised terms, but protect the relationships that keep the business operating.
Month three makes the change repeatable
Document purchasing thresholds, credit rules, invoice approval steps and payment calendars. Add the cycle metrics to the monthly management pack and review movement against operational measures such as fulfilment, margin, disputed invoices and supplier service.
Don't set a target that rewards the wrong behaviour. A falling DIO paired with frequent stockouts is not an improvement. A lower DSO achieved through aggressive customer treatment may damage revenue. The final month should confirm that cash improvement is durable, commercially sensible and owned by the team.
Common Working Capital Mistakes to Avoid
The first mistake is treating supplier delay as the primary solution. Stretching payments beyond agreed terms can create late fees, lost discounts, reduced limits or cash-on-delivery demands. If you're building supplier credibility, understand the commercial requirements for qualifying for Net 30 vendors, then use terms properly rather than treating them as permission to pay late.
The second mistake is cutting inventory without separating waste from resilience. Removing a slow-moving product may release cash, but cutting a critical component can create missed orders and emergency freight. Keep service-level requirements visible beside DIO and stock value.
The third mistake is offering early-payment discounts without testing the economics. A discount only makes sense when the cash arrives earlier and the benefit outweighs the margin given away. Otherwise, collect to the agreed date and improve the invoicing process instead.
Working capital optimisation is also not a one-off clean-up. Product ranges change, customers renegotiate terms, suppliers alter lead times and growth changes the amount of cash required. Review the working capital cycle regularly, investigate movement in each component and make operational owners accountable for the result.
Nexist helps Australian founders connect inventory timing, receivables, payables and forecasting to the cash available in the bank. Visit Nexist to arrange a practical review of your working capital cycle and turn the biggest cash leaks into an executable improvement plan.
working capital cycle, cash flow management, cash conversion cycle, SME finance Australia, inventory optimisation

" width="24px"/><g d="M 0 24.129 L 0 0.129 L 24 0.129 L 24 24.129 Z M 0 24.129 L 0 0.129 L 24 0.129 L 24 24.129 Z M 24 3 C 24 1.344 22.656 0 21 0 L 3 0 C 1.344 0 0 1.344 0 3 L 0 21 C 0 22.656 1.344 24 3 24 L 21 24 C 22.656 24 24 22.656 24 21 Z M 6.883 8.375 L 2.863 8.375 L 2.863 20.467 L 6.883 20.467 Z M 4.899 2.545 C 3.524 2.545 2.625 3.449 2.625 4.634 C 2.625 5.795 3.496 6.724 4.846 6.724 L 4.872 6.724 C 6.273 6.724 7.146 5.795 7.146 4.634 C 7.12 3.449 6.274 2.545 4.899 2.545 Z M 16.747 8.09 C 14.614 8.09 13.659 9.263 13.124 10.086 L 13.124 8.374 L 9.105 8.374 C 9.159 9.508 9.105 20.466 9.105 20.466 L 13.124 20.466 L 13.124 13.713 C 13.124 13.352 13.15 12.99 13.257 12.732 C 13.547 12.01 14.209 11.262 15.319 11.262 C 16.773 11.262 17.355 12.372 17.355 13.996 L 17.355 20.466 L 21.374 20.466 L 21.374 13.532 C 21.374 9.818 19.391 8.09 16.747 8.09 Z" fill="transparent" height="24.12890599668026px" id="dSFdkJotL" width="24px"><path d="M 0 24 L 0 0 L 24 0 L 24 24 Z" fill="transparent" height="24px" id="wscNJE44G" transform="translate(0 0.129)" width="24px"/><g d="M 0 24.129 L 0 0.129 L 24 0.129 L 24 24.129 Z M 24 3 C 24 1.344 22.656 0 21 0 L 3 0 C 1.344 0 0 1.344 0 3 L 0 21 C 0 22.656 1.344 24 3 24 L 21 24 C 22.656 24 24 22.656 24 21 Z M 6.883 8.375 L 2.863 8.375 L 2.863 20.467 L 6.883 20.467 Z M 4.899 2.545 C 3.524 2.545 2.625 3.449 2.625 4.634 C 2.625 5.795 3.496 6.724 4.846 6.724 L 4.872 6.724 C 6.273 6.724 7.146 5.795 7.146 4.634 C 7.12 3.449 6.274 2.545 4.899 2.545 Z M 16.747 8.09 C 14.614 8.09 13.659 9.263 13.124 10.086 L 13.124 8.374 L 9.105 8.374 C 9.159 9.508 9.105 20.466 9.105 20.466 L 13.124 20.466 L 13.124 13.713 C 13.124 13.352 13.15 12.99 13.257 12.732 C 13.547 12.01 14.209 11.262 15.319 11.262 C 16.773 11.262 17.355 12.372 17.355 13.996 L 17.355 20.466 L 21.374 20.466 L 21.374 13.532 C 21.374 9.818 19.391 8.09 16.747 8.09 Z" fill="transparent" height="24.12890599668026px" id="sTpjGo1tb" width="24px"><path d="M 0 24 L 0 0 L 24 0 L 24 24 Z" fill="transparent" height="24px" id="s7ffpmKOD" transform="translate(0 0.129)" width="24px"/><g d="M 24 3 C 24 1.344 22.656 0 21 0 L 3 0 C 1.344 0 0 1.344 0 3 L 0 21 C 0 22.656 1.344 24 3 24 L 21 24 C 22.656 24 24 22.656 24 21 Z M 6.883 8.375 L 2.863 8.375 L 2.863 20.467 L 6.883 20.467 Z M 4.899 2.545 C 3.524 2.545 2.625 3.449 2.625 4.634 C 2.625 5.795 3.496 6.724 4.846 6.724 L 4.872 6.724 C 6.273 6.724 7.146 5.795 7.146 4.634 C 7.12 3.449 6.274 2.545 4.899 2.545 Z M 16.747 8.09 C 14.614 8.09 13.659 9.263 13.124 10.086 L 13.124 8.374 L 9.105 8.374 C 9.159 9.508 9.105 20.466 9.105 20.466 L 13.124 20.466 L 13.124 13.713 C 13.124 13.352 13.15 12.99 13.257 12.732 C 13.547 12.01 14.209 11.262 15.319 11.262 C 16.773 11.262 17.355 12.372 17.355 13.996 L 17.355 20.466 L 21.374 20.466 L 21.374 13.532 C 21.374 9.818 19.391 8.09 16.747 8.09 Z" fill="transparent" height="24.000006px" id="D0ecaHEcW" transform="translate(0 0)" width="24px"><path d="M 24 3 C 24 1.344 22.656 0 21 0 L 3 0 C 1.344 0 0 1.344 0 3 L 0 21 C 0 22.656 1.344 24 3 24 L 21 24 C 22.656 24 24 22.656 24 21 Z" fill="rgb(55, 184, 218)" height="24.000006px" id="IPLFE6zXx" width="24px"/><path d="M 4.02 0 L 0 0 L 0 12.092 L 4.02 12.092 Z" fill="rgb(255, 255, 255)" height="12.09201px" id="FWhtzAyuY" transform="translate(2.863 8.375)" width="4.02px"/><path d="M 2.274 0 C 0.899 0 0 0.904 0 2.089 C 0 3.25 0.871 4.179 2.221 4.179 L 2.247 4.179 C 3.648 4.179 4.521 3.25 4.521 2.089 C 4.495 0.904 3.649 0 2.274 0 Z" fill="rgb(255, 255, 255)" height="4.17876px" id="VmOsKv4kO" transform="translate(2.625 2.545)" width="4.52095px"/><path d="M 7.641 0 C 5.509 0 4.554 1.173 4.019 1.996 L 4.019 0.284 L 0 0.284 C 0.053 1.419 0 12.376 0 12.376 L 4.019 12.376 L 4.019 5.623 C 4.019 5.262 4.045 4.9 4.151 4.642 C 4.442 3.92 5.103 3.172 6.214 3.172 C 7.667 3.172 8.25 4.282 8.25 5.907 L 8.25 12.376 L 12.269 12.376 L 12.269 5.442 C 12.269 1.728 10.286 0 7.641 0 Z" fill="rgb(255, 255, 255)" height="12.37626px" id="n1XUbhaq0" transform="translate(9.105 8.09)" width="12.268830000000001px"/></g></g></g></g></svg>)