Management Accounting: Boost Cash Flow & Scale
Master management accounting to unlock cash flow, control margins and scale your Australian SME with practical frameworks and KPIs.
Ansh Malhotra

More reports won't automatically improve cash flow. If your team receives a polished monthly profit and loss statement but still pays suppliers before collecting from customers, buys stock without a clear sell-through decision, or discovers margin erosion after the cash has left the bank, the reporting process isn't the control system.
Management accounting works when it changes behaviour. It connects costing, forecasting, performance analysis and operational decisions to the timing of cash movements. That matters in Australian SMEs, particularly businesses carrying inventory, funding growth through supplier credit, or operating with little room for collection delays.
Australian management accounting has deep roots. European accounting practices, including cost accounting, arrived with early British settlers in the late 18th century, while the 1851 gold discovery accelerated adoption in mining-related companies. The Adelaide Society of Accountants became the first Australian accounting body in 1885, and a dedicated representative voice for management accountants emerged much later, with the Institute of Certified Management Accountants forming in 1996. CMA Australia's historical account places the profession within Australia's broader economic development.
Table of Contents
Why More Reports Will Not Fix Your Cash Flow
The common advice is simple: improve visibility, produce better reports and make better decisions. That advice is incomplete. Many founders already have accounting software, bank feeds, aged receivables reports, inventory reports and monthly financial statements. The problem is that those reports often arrive after the decision window has closed.
A report can tell you that receivables are rising. It won't chase the overdue invoice, change the customer's payment terms or stop a new order from being accepted without a deposit. A stock report can identify slow-moving products. It won't prevent the next purchase order unless someone has assigned a decision rule and an owner.
That execution gap is expensive because cash leaks through ordinary operating activity:
Collections drift: Invoices go out late, payment terms aren't enforced, and overdue accounts receive attention only when the bank balance becomes uncomfortable.
Inventory accumulates: Buyers respond to supplier discounts or optimistic sales forecasts without measuring stock velocity, margin by SKU or the cash cost of holding excess units.
Pricing weakens: Teams protect revenue by accepting low-margin work, discounting inconsistently or failing to pass through freight, labour and supplier cost increases.
Buffers disappear: Owners treat forecast cash as available cash, then discover that tax, payroll, supplier commitments and debt repayments compete for the same funds.
A 2025 UNSW and CommBank survey found that nearly 80% of Australian small and medium businesses experienced a cash-flow impact in the previous 12 months. The reported drivers included declining revenue, low cash reserves and seasonality, while only 15% to 27% of SMEs reportedly had minimal or no cash buffer, according to UNSW's coverage of the survey. The practical message isn't that every business needs more dashboards. It's that many businesses need faster intervention.
Practical rule: Every important report should trigger an action, an owner and a deadline. If it doesn't, it's information, not control.
Management accounting should therefore operate as a decision rhythm. Review cash commitments frequently, assign collection actions to named people, approve purchasing against demand and liquidity, and escalate variances before they become monthly surprises. The finance function's value isn't measured by how many pages it produces. It's measured by whether managers change what they do while there's still time to improve the outcome.
The Core Components of Management Accounting
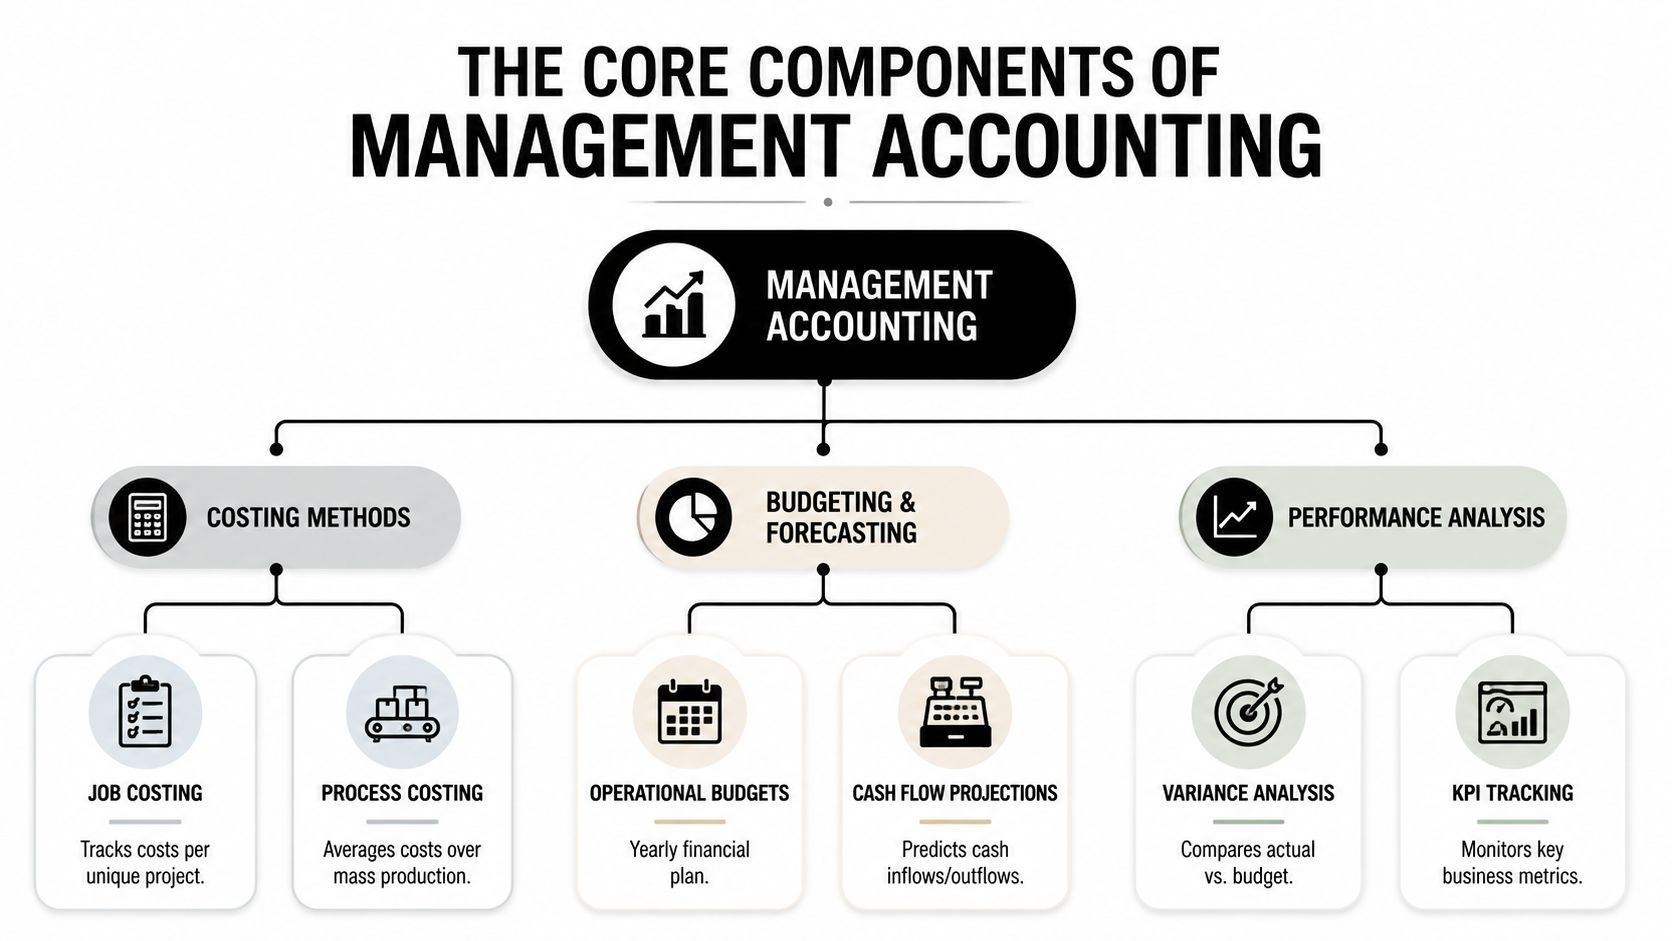
Management accounting is a connected system rather than a collection of reports. Costing explains what a product, job or service consumes. Budgeting allocates resources. Forecasting updates expectations. Performance analysis shows where reality is departing from the plan, and cash-flow analysis reveals whether profit is arriving in time to fund operations.
Costing that reflects how work happens
A manufacturer producing custom orders needs job costing. Each job should carry its direct materials, direct labour, freight and an appropriate share of overhead. If the quoted price is compared only with the materials invoice, the business can mistake busy production for profitable production.
A business producing large volumes of similar goods may use process costing, which averages costs across a production process. An ecommerce brand needs a more granular view, often combining SKU-level purchase cost, inbound freight, fulfilment, payment fees, returns and promotional discounts. Activity-based costing can help where overheads arise from distinct activities, such as picking, customer support or complex production changeovers.
Budgets and forecasts serve different purposes
A budget sets the financial plan. It gives managers a reference point for hiring, purchasing, marketing and investment decisions. A rolling forecast updates the expected result as sales, costs, stock and collections change. A flexible budget is useful when activity levels move, because it compares performance against the costs that should have applied to the actual volume rather than against a fixed annual assumption.
A service business should forecast project revenue, labour availability, subcontractor costs and completion timing. An inventory-heavy business must include purchase orders, lead times, landed costs and expected payment dates. Revenue growth without a cash funding view can create pressure rather than progress.
Performance analysis makes the system useful
A monthly report should show more than revenue and net profit. It should connect gross margin, contribution margin, debtor days, stock days, supplier days, labour utilisation, order profitability and forecast cash to operational owners. Variance analysis then asks why the result differs from plan and what decision follows.
For specialised businesses, financial treatment also needs careful design. A startup working through eligible research and development activity may need to distinguish project costs, payroll allocation and supporting records, making a practical resource such as R&D accounting for Australian startups useful when building a disciplined cost-capture process.
The components reinforce one another. Costing improves pricing. Pricing changes alter gross margin. Margin and sales volume affect purchases and staffing. Purchases and staffing affect cash timing. A management accounting system is working when those links are visible before the bank account forces the conversation.
Mastering the Cash Conversion Cycle
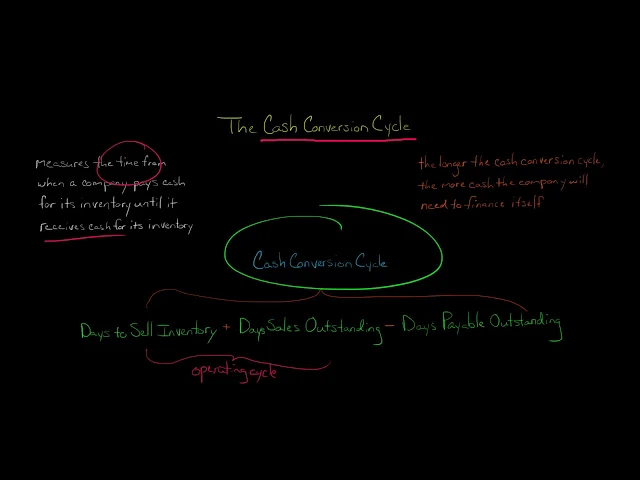
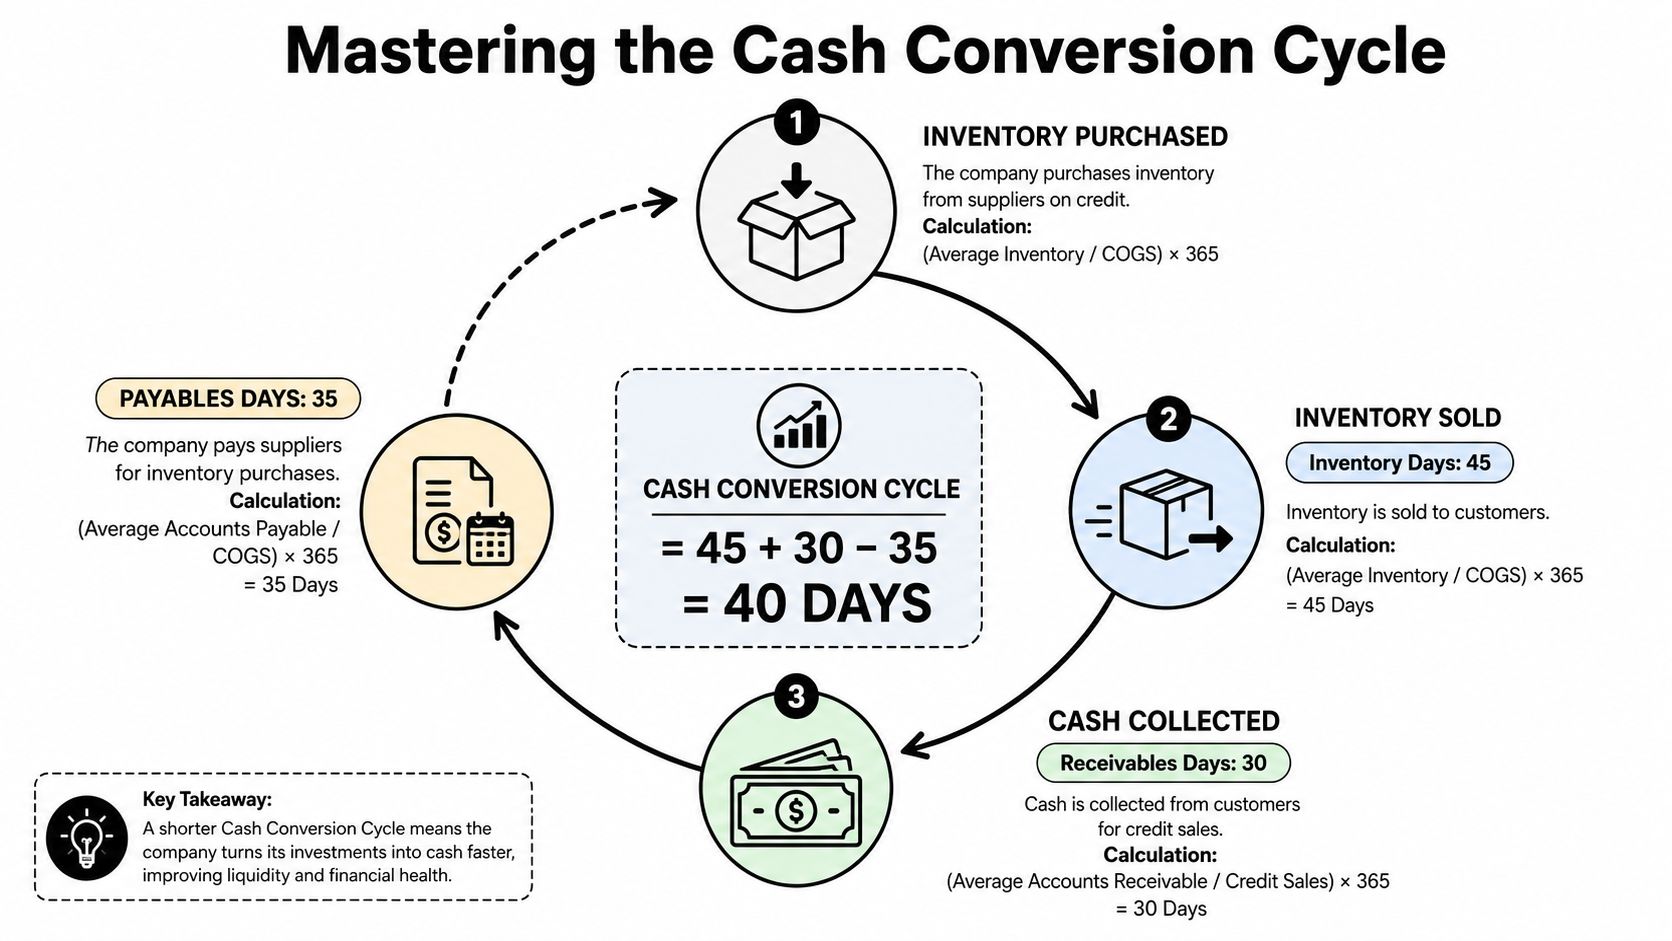
For inventory-heavy Australian SMEs, the cash conversion cycle is one of the clearest measures of how long operating cash remains unavailable. The formula is:
CCC = DSO + DIO − DPO
The three inputs describe different parts of the operating cycle:
Days sales outstanding, or DSO: Average trade receivables divided by revenue, multiplied by 365.
Days inventory outstanding, or DIO: Average inventory divided by cost of goods sold, multiplied by 365.
Days payable outstanding, or DPO: Average trade creditors divided by cost of goods sold, multiplied by 365.
Calculate it consistently
Use average balances where possible, and keep the definitions stable from one reporting period to the next. Revenue belongs in the DSO calculation, while cost of goods sold belongs in the DIO and DPO calculations. Mixing monthly balances with annualised figures or using inconsistent stock values can make the result look precise while hiding a measurement problem.
The calculation becomes useful when you segment it. Review DSO by customer, channel and invoice type. Review DIO by SKU, category and supplier. Review DPO by supplier and payment term. A single company-wide result can conceal one customer that pays slowly or one product range that absorbs disproportionate cash.
KPMG's Australian working-capital analysis describes these measures as a way to quantify how long cash is trapped in receivables and stock before recovery, with consequences for funding requirements, covenant headroom and external finance needs. The Australian working-capital analysis from KPMG supports using the CCC as an operating control, not just a finance ratio.
Turn the result into operating rules
If DSO is deteriorating, tighten credit approval, invoice at contract milestones, send reminders before due dates and require escalation for overdue balances. If DIO is expanding, stop replenishment on weak products, review purchase quantities and separate committed stock from speculative stock. If DPO is shorter than agreed supplier terms, correct the payment process, but never delay payment outside those terms without communication.
A lower CCC doesn't come from pressuring one team. It comes from coordinating sales terms, purchasing, inventory decisions and accounts payable.
For a worked explanation of the metric and its operational uses, see Nexist's cash conversion cycle guide. A strong weekly review asks not only whether the CCC moved, but which component moved, why it moved and who must act before the next review.
Benchmarking Against Industry Standards
Internal targets can become comfortable, especially when managers compare this month with last month. The Australian Taxation Office's small business benchmarks provide an external reference point for comparing financial performance with similar businesses in the same industry. The ATO small business benchmarks are organised around industry codes and calculated for each business activity, which makes them relevant to segmented reporting.
Benchmarking isn't a pass-or-fail exercise. A variance is a question. If a gross margin sits outside the relevant range, investigate product mix, discounting, freight recovery, stock write-offs and cost allocation before concluding that the business is inefficient. If labour costs are high, examine scheduling, rework, overtime, utilisation and revenue quality rather than cutting people without understanding the cause.
Use variance as a diagnostic signal
Variance Type | Likely Cause | Action Required |
|---|---|---|
Gross margin below the relevant benchmark range | Pricing erosion, input-cost increases, discounting or stock adjustments | Recalculate product and job margins, review pricing authority and validate landed costs |
Labour expense above the relevant benchmark range | Low utilisation, overtime, rework or weak scheduling | Compare paid hours with productive output and review roster or project controls |
Cost of goods sold inconsistent with activity | Shrinkage, purchase coding errors, stock valuation issues or product mix changes | Reconcile inventory movements and test high-volume product categories |
Receivables performance weaker than expected | Late invoicing, loose terms or ineffective follow-up | Assign collection ownership, introduce ageing triggers and review customer credit limits |
Operating expenses rising without matching output | Process leakage, duplicated tools or uncontrolled discretionary spend | Map the cost centre, set approval rules and test whether the expense supports contribution |
A multi-division SME shouldn't rely on one blended margin. Map actuals to the correct business activity, then review each division against its relevant benchmark context. The process can strengthen BAS, tax and cash-flow planning because unexplained variance becomes visible before it is buried in a consolidated result.
For logistics operators, a KPI dashboard needs to connect financial outcomes with operational drivers such as trips, utilisation, fuel, maintenance and debtor performance. A practical reference on structuring that view is the Haulier.AI KPI dashboard guide.
Automating Management Accounting with AI
AI shouldn't be the starting point. Clean data, clear ownership and defined decision rules come first. Once those foundations exist, automation can shorten the distance between a transaction and an intervention.
CPA Australia's 2025 business technology research reports that AI usage rose sharply between 2022 and 2025, approaching near-universal adoption by 2025, while data analytics and visualisation use also continued to rise. CPA Australia's 2025 business technology report places the emphasis on practical use, not technology for its own sake.
Automate exceptions before summaries
Start with tasks where a rule can identify an exception:
Collections: Flag invoices approaching or exceeding agreed terms, then create a follow-up task for the responsible account owner.
Margin control: Alert managers when actual purchase costs, discounts or fulfilment charges push an order or SKU below its approved margin floor.
Inventory: Trigger review when stock cover, sales velocity or ageing moves outside the purchasing policy.
Cash forecasting: Pull bank, receivables, payables, payroll and committed purchase data into a frequently refreshed forecast.
Reporting: Generate a concise management pack that highlights movements, exceptions and required decisions rather than reproducing every transaction.
The best automation doesn't remove judgement. It removes repetitive copying, matching and searching so the finance lead can investigate causes and decide what to do. A collection alert is useful only if someone can approve a payment plan, suspend further credit or contact the customer.
Automation principle: Automate the route to a decision, not the decision itself.
Before selecting a platform, teams should compare top financial reporting software against their data sources, permissions, audit trail and reporting needs. The right tool should make exceptions easier to see without creating another disconnected dashboard.
Businesses also need process automation beyond finance. Nexist's guide to automating business processes is relevant where approvals, handovers and recurring operational tasks are creating the delay that finance reports later reveal.
Building Your Management Accounting System
A workable system starts with ownership, not software. Decide who prepares the data, who reviews it, who speaks with operational managers and who has authority to change pricing, purchasing or credit decisions. An in-house bookkeeper may maintain transaction accuracy, while an external CFO or hybrid finance team can provide forecasting, commercial analysis and accountability.

Build the data structure before the dashboard
Clean the chart of accounts and establish cost centres that match how managers make decisions. Add project codes for jobs, product or category codes for inventory, and clear tracking for freight, labour, returns, discounts and payment fees. If the accounting structure cannot distinguish profitable work from unprofitable work, a visual dashboard will only display an organised version of the same ambiguity.
Connect the cloud accounting platform to the systems that contain operational truth. Depending on the business, that may include inventory management, point-of-sale, payroll, ecommerce, customer relationship management and payment platforms. Test the flow from source transaction to management report before relying on it for decisions.
Set a cadence people can sustain
Use a weekly cash review for bank position, expected receipts, overdue debtors, supplier commitments, payroll, tax and near-term purchasing. Produce a monthly performance report covering revenue, gross margin, operating costs, profit, working capital and forecast movement. Hold a quarterly strategic review for pricing, capacity, debt, capital expenditure, scenario planning and profit targets.
A three-way forecast links the profit and loss statement, balance sheet and cash flow. The Nexist three-way forecast resource can help owners understand why a profitable month may still create a funding requirement.
Roll out in controlled stages
Assign ownership: Name the person responsible for each report and each action arising from it.
Clean historical data: Resolve duplicated suppliers, uncoded transactions, unreliable stock balances and inconsistent customer terms.
Define the measures: Choose KPIs that connect directly to decisions, such as margin by product, DSO, DIO, DPO, utilisation or project variance.
Create trigger rules: Specify what happens when a measure moves outside tolerance. A trigger without a response is just another alert.
Train the team: Explain why staff must code transactions correctly, approve purchases promptly and record operational drivers.
Review and refine: Remove reports nobody uses, improve definitions and adjust the cadence as the business changes.
The most common implementation failure is trying to perfect every historical number before introducing a usable control cycle. Establish a reliable baseline, label known limitations and improve the system through repeated operating reviews.
Real-World Management Accounting Fixes
The following scenarios illustrate how the mechanics work in practice. They use the supplied examples as specific illustrations, not as universal outcomes.
An ecommerce brand had cash tied up in stock that was moving too slowly. Management introduced SKU-level margin analysis, reviewed product velocity and discontinued slow-moving inventory. DIO fell from 95 days to 62 days, releasing $180,000 in trapped cash. The important intervention wasn't a more attractive inventory report. It was the decision to connect margin, stock ageing and purchasing authority.
A manufacturing business faced pricing erosion across product lines. Its team compared actual job costs with internal benchmarks and identified lines where material, labour and overhead consumption no longer matched the selling price. The business responded with a 12% price increase on underperforming product lines, using cost evidence to support a commercial correction instead of applying a blanket increase.
A service business had customers paying slowly, with DSO at 48 days. It introduced automated payment reminders and milestone-based invoicing, bringing DSO down to 31 days and removing the need for a line of credit. The lesson is that invoicing design and follow-up discipline can matter as much as the forecast itself.
What these examples have in common
Each business selected a measure connected to a specific leak:
Stock: DIO exposed cash trapped in inventory.
Manufacturing: Job-cost variance exposed weak pricing.
Services: DSO exposed a collections and billing process problem.
Each intervention also had an owner and an operational response. The ecommerce team changed the range and purchasing behaviour. The manufacturer changed pricing. The service business changed billing timing and collection follow-up.
Management accounting fails when it stops at diagnosis. A founder may know that stock is slow, jobs are underpriced or invoices are overdue, yet still postpone the decision because nobody has defined the threshold for action. The system becomes valuable when the measure creates a prompt to change purchasing, pricing, invoicing or customer terms.
Your Next Steps to Financial Control
Start this week with a short, practical control cycle:
Audit reporting gaps: List the decisions you're making without timely margin, stock, debtor or cash information.
Calculate your CCC: Separate DSO, DIO and DPO so you can identify the component creating pressure.
Find three cash leaks: Look for overdue receivables, excess stock, weak pricing, uncontrolled purchasing or process delays.
Use ATO benchmarks: Map monthly actuals to the relevant industry activity and investigate material variances.
Set trigger rules: Decide who acts when collections, stock, margin or cash moves outside the agreed range.
Book a finance review: Turn the findings into a forecast, action register and reporting cadence.
Management accounting isn't a one-off reporting project. It's an operating discipline that keeps pricing, purchasing, collections and cash decisions connected. The right virtual CFO partner can help set profit targets, build the roadmap and implement the routines that make the numbers useful.
Nexist helps Australian founders turn management accounting into hands-on cash control through forecasting, performance reporting, KPI design, working-capital reviews and process automation. Visit Nexist to discuss your cash leaks, margin priorities and the management system needed to scale with greater control.
management accounting, SME finance, cash flow, virtual CFO, KPIs

" width="24px"/><g d="M 0 24.129 L 0 0.129 L 24 0.129 L 24 24.129 Z M 0 24.129 L 0 0.129 L 24 0.129 L 24 24.129 Z M 24 3 C 24 1.344 22.656 0 21 0 L 3 0 C 1.344 0 0 1.344 0 3 L 0 21 C 0 22.656 1.344 24 3 24 L 21 24 C 22.656 24 24 22.656 24 21 Z M 6.883 8.375 L 2.863 8.375 L 2.863 20.467 L 6.883 20.467 Z M 4.899 2.545 C 3.524 2.545 2.625 3.449 2.625 4.634 C 2.625 5.795 3.496 6.724 4.846 6.724 L 4.872 6.724 C 6.273 6.724 7.146 5.795 7.146 4.634 C 7.12 3.449 6.274 2.545 4.899 2.545 Z M 16.747 8.09 C 14.614 8.09 13.659 9.263 13.124 10.086 L 13.124 8.374 L 9.105 8.374 C 9.159 9.508 9.105 20.466 9.105 20.466 L 13.124 20.466 L 13.124 13.713 C 13.124 13.352 13.15 12.99 13.257 12.732 C 13.547 12.01 14.209 11.262 15.319 11.262 C 16.773 11.262 17.355 12.372 17.355 13.996 L 17.355 20.466 L 21.374 20.466 L 21.374 13.532 C 21.374 9.818 19.391 8.09 16.747 8.09 Z" fill="transparent" height="24.12890599668026px" id="dSFdkJotL" width="24px"><path d="M 0 24 L 0 0 L 24 0 L 24 24 Z" fill="transparent" height="24px" id="wscNJE44G" transform="translate(0 0.129)" width="24px"/><g d="M 0 24.129 L 0 0.129 L 24 0.129 L 24 24.129 Z M 24 3 C 24 1.344 22.656 0 21 0 L 3 0 C 1.344 0 0 1.344 0 3 L 0 21 C 0 22.656 1.344 24 3 24 L 21 24 C 22.656 24 24 22.656 24 21 Z M 6.883 8.375 L 2.863 8.375 L 2.863 20.467 L 6.883 20.467 Z M 4.899 2.545 C 3.524 2.545 2.625 3.449 2.625 4.634 C 2.625 5.795 3.496 6.724 4.846 6.724 L 4.872 6.724 C 6.273 6.724 7.146 5.795 7.146 4.634 C 7.12 3.449 6.274 2.545 4.899 2.545 Z M 16.747 8.09 C 14.614 8.09 13.659 9.263 13.124 10.086 L 13.124 8.374 L 9.105 8.374 C 9.159 9.508 9.105 20.466 9.105 20.466 L 13.124 20.466 L 13.124 13.713 C 13.124 13.352 13.15 12.99 13.257 12.732 C 13.547 12.01 14.209 11.262 15.319 11.262 C 16.773 11.262 17.355 12.372 17.355 13.996 L 17.355 20.466 L 21.374 20.466 L 21.374 13.532 C 21.374 9.818 19.391 8.09 16.747 8.09 Z" fill="transparent" height="24.12890599668026px" id="sTpjGo1tb" width="24px"><path d="M 0 24 L 0 0 L 24 0 L 24 24 Z" fill="transparent" height="24px" id="s7ffpmKOD" transform="translate(0 0.129)" width="24px"/><g d="M 24 3 C 24 1.344 22.656 0 21 0 L 3 0 C 1.344 0 0 1.344 0 3 L 0 21 C 0 22.656 1.344 24 3 24 L 21 24 C 22.656 24 24 22.656 24 21 Z M 6.883 8.375 L 2.863 8.375 L 2.863 20.467 L 6.883 20.467 Z M 4.899 2.545 C 3.524 2.545 2.625 3.449 2.625 4.634 C 2.625 5.795 3.496 6.724 4.846 6.724 L 4.872 6.724 C 6.273 6.724 7.146 5.795 7.146 4.634 C 7.12 3.449 6.274 2.545 4.899 2.545 Z M 16.747 8.09 C 14.614 8.09 13.659 9.263 13.124 10.086 L 13.124 8.374 L 9.105 8.374 C 9.159 9.508 9.105 20.466 9.105 20.466 L 13.124 20.466 L 13.124 13.713 C 13.124 13.352 13.15 12.99 13.257 12.732 C 13.547 12.01 14.209 11.262 15.319 11.262 C 16.773 11.262 17.355 12.372 17.355 13.996 L 17.355 20.466 L 21.374 20.466 L 21.374 13.532 C 21.374 9.818 19.391 8.09 16.747 8.09 Z" fill="transparent" height="24.000006px" id="D0ecaHEcW" transform="translate(0 0)" width="24px"><path d="M 24 3 C 24 1.344 22.656 0 21 0 L 3 0 C 1.344 0 0 1.344 0 3 L 0 21 C 0 22.656 1.344 24 3 24 L 21 24 C 22.656 24 24 22.656 24 21 Z" fill="rgb(55, 184, 218)" height="24.000006px" id="IPLFE6zXx" width="24px"/><path d="M 4.02 0 L 0 0 L 0 12.092 L 4.02 12.092 Z" fill="rgb(255, 255, 255)" height="12.09201px" id="FWhtzAyuY" transform="translate(2.863 8.375)" width="4.02px"/><path d="M 2.274 0 C 0.899 0 0 0.904 0 2.089 C 0 3.25 0.871 4.179 2.221 4.179 L 2.247 4.179 C 3.648 4.179 4.521 3.25 4.521 2.089 C 4.495 0.904 3.649 0 2.274 0 Z" fill="rgb(255, 255, 255)" height="4.17876px" id="VmOsKv4kO" transform="translate(2.625 2.545)" width="4.52095px"/><path d="M 7.641 0 C 5.509 0 4.554 1.173 4.019 1.996 L 4.019 0.284 L 0 0.284 C 0.053 1.419 0 12.376 0 12.376 L 4.019 12.376 L 4.019 5.623 C 4.019 5.262 4.045 4.9 4.151 4.642 C 4.442 3.92 5.103 3.172 6.214 3.172 C 7.667 3.172 8.25 4.282 8.25 5.907 L 8.25 12.376 L 12.269 12.376 L 12.269 5.442 C 12.269 1.728 10.286 0 7.641 0 Z" fill="rgb(255, 255, 255)" height="12.37626px" id="n1XUbhaq0" transform="translate(9.105 8.09)" width="12.268830000000001px"/></g></g></g></g></svg>)