How to Calculate EBITDA: A Practical Guide 2026
Learn how to calculate EBITDA for your Australian SME. Our 2026 guide covers the formula, examples, and common pitfalls to avoid.
Ansh Malhotra

You're heading into a bank meeting, preparing a sale conversation, or trying to understand why a profitable business still feels short of cash. Someone asks for EBITDA, and the first instinct is to open the Xero profit and loss statement, find net profit, and start adding back whatever looks inconvenient.
That approach produces a number quickly, but not necessarily a number you can defend. How to calculate EBITDA properly in an Australian SME depends on clean P&L classifications, documented add-backs, and a clear decision about whether you're reporting standard EBITDA or a normalised management measure.
Table of Contents
What EBITDA Measures for Australian Founders
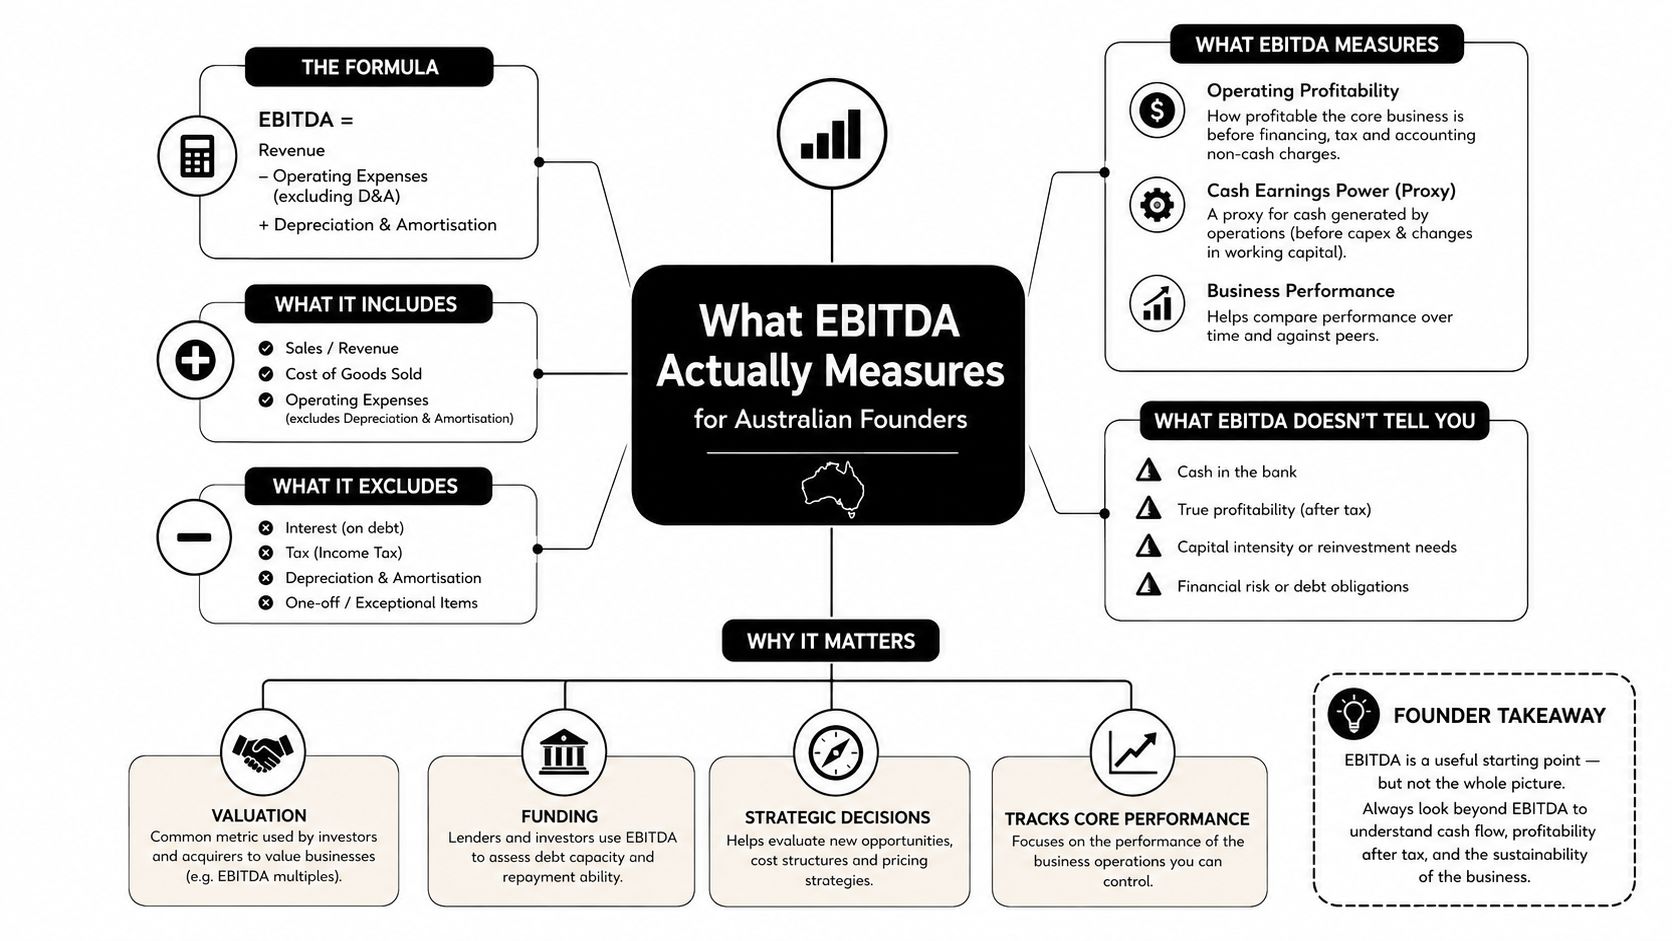
EBITDA means earnings before interest, tax, depreciation and amortisation. It isolates trading performance before financing choices, income tax, and accounting charges that spread asset costs across their useful lives. That can help compare businesses with different loan balances, tax structures, or asset bases, provided the underlying accounts are classified consistently.
A founder preparing figures for a lender might see net profit reduced by loan interest, income tax, depreciation on equipment, and amortisation of an intangible asset. Each cost belongs in the P&L and affects the business. EBITDA removes them temporarily so the founder can assess earnings generated by day-to-day operations before those influences.
EBITDA does not replace net profit. Net profit remains the bottom-line result after all expenses, while EBITDA is a management metric for examining operating performance. In Australia, EBITDA is not standardised under Australian Accounting Standards or IFRS. Two businesses can therefore produce different EBITDA figures from similar financial statements if they classify costs or define adjustments differently.
What EBITDA removes
The standard add-backs are:
Interest: The cost of borrowing, reflecting the business's capital structure.
Tax: Income tax expense, reflecting tax circumstances and entity structure.
Depreciation: The accounting allocation of tangible asset costs.
Amortisation: The accounting allocation of intangible asset costs.
These costs remain real. The business still needs to service debt, pay tax, replace equipment, and maintain intangible assets. EBITDA presents earnings before those items, rather than claiming they have no financial effect.
Practical rule: Treat EBITDA as a consistent operating lens, not as cash in the bank.
The calculation is only as reliable as the source accounts. A finance cost posted to the wrong account, an incomplete depreciation schedule, or a one-off gain recorded as ordinary revenue can distort the result. Review the Xero-style P&L line by line, preserve the reconciliation from reported P&L to EBITDA, and label any management adjustments separately. That record lets a lender, buyer, or adviser see whether the figure is standard EBITDA or a normalised measure built for decision-making.
The Two Formulas That Produce the Same Number
A Xero-style P&L can produce the same EBITDA through two routes. Start with net profit or operating profit, then add back the costs excluded by the chosen starting point. Neither is more correct, provided the accounts and adjustments are defined consistently.
Path A from net profit
Net profit includes interest, income tax, depreciation, and amortisation. Add those four items back:
EBITDA = Net profit + interest + tax + depreciation + amortisation
Use the following P&L inputs:
P&L line | Amount |
|---|---|
Net profit | AUD 1,200,000 |
Interest | AUD 150,000 |
Tax | AUD 300,000 |
Depreciation | AUD 400,000 |
Amortisation | AUD 50,000 |
EBITDA | AUD 2,100,000 |
The arithmetic is:
AUD 1,200,000 + AUD 150,000 + AUD 300,000 + AUD 400,000 + AUD 50,000 = AUD 2,100,000
This route works well when the net profit line is reliable and the interest, tax, depreciation, and amortisation accounts are easy to isolate. Check that tax is an expense in the same reporting period, and do not add back operating costs just because they are unusual or large.
Path B from operating profit
Operating profit generally sits above interest and income tax in the P&L. If depreciation and amortisation are included in operating expenses, add them back:
EBITDA = Operating profit + depreciation + amortisation
Using the same underlying figures, operating profit is AUD 1,650,000, calculated as EBITDA of AUD 2,100,000 less depreciation of AUD 400,000 and amortisation of AUD 50,000.
The calculation is:
AUD 1,650,000 + AUD 400,000 + AUD 50,000 = AUD 2,100,000
The methods reconcile because operating profit has already excluded interest and tax. A mismatch points to a classification problem. Finance costs may sit inside operating expenses, tax may be included in the operating result, or depreciation may have been posted outside the expected account group. Trace the ledger rather than forcing the two figures to agree.
Australian tax law uses a defined EBITDA construct in a specific context. Division 820 of the Income Tax Assessment Act 1997 sets out an entity EBITDA calculation based on net profit adjusted for tax, relevant third-party interest, depreciation, and amortisation. That measure supports thin-capitalisation and related tax calculations. It is not automatically the same as the management EBITDA used in an SME dashboard or sale process.
For a wider view of profitability measures, compare EBITDA with gross and operating margins using these profit margin formulas for B2B.
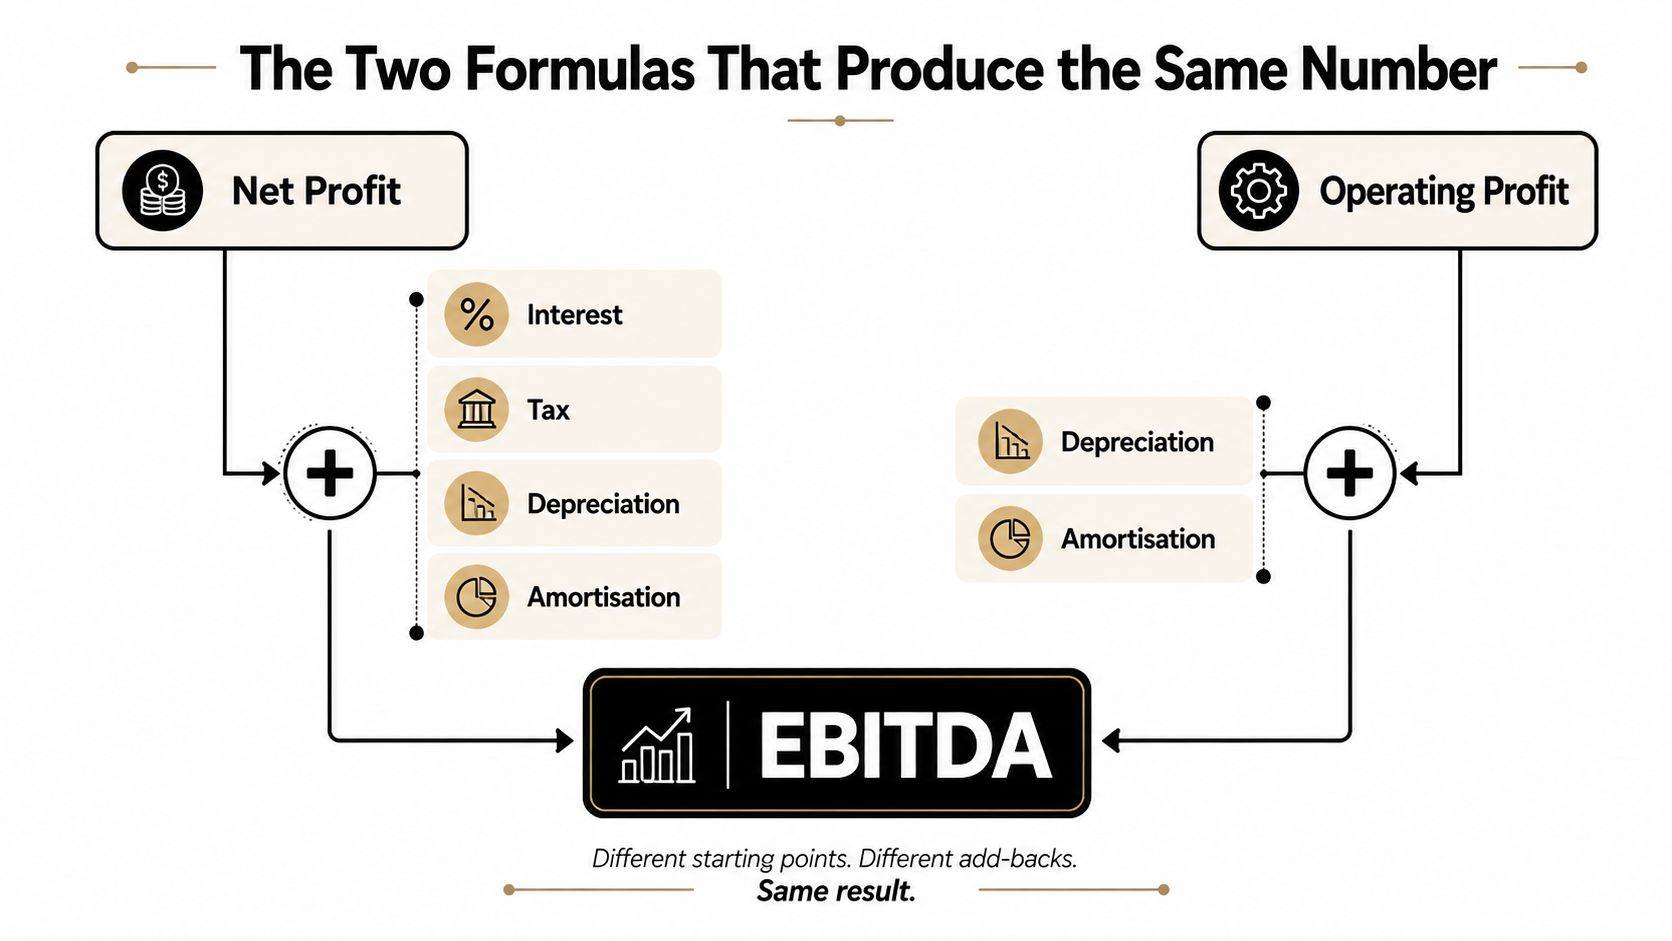
The diagram makes the reconciliation visible.
Preparing the Inputs from Your P&L
A trustworthy EBITDA calculation starts before the formula. Pull the reports that support each line, then reconcile the accounts rather than relying on a single total from accounting software. Your working papers should normally include the P&L, general ledger detail, fixed-asset register, and amortisation schedules.
A useful starting point is a clean explanation of what a profit and loss statement contains. Once you understand the P&L structure, map each line to the EBITDA bridge.
Build the source list
Begin with revenue and cost of goods sold. These establish the gross profit, but neither is an EBITDA add-back. Keep them in the calculation because EBITDA measures earnings after the costs required to deliver the revenue.
Then review operating expenses line by line:
Payroll and wages: Leave genuine employee costs in EBITDA. Don't remove them because they're large.
Rent and utilities: Keep normal premises and service costs in the operating result.
Marketing and software: These are operating costs unless a separate, documented adjustment is appropriate.
Depreciation: Pull the expense from the fixed-asset register or depreciation report.
Amortisation: Pull the expense from the intangible asset schedule.
Finance costs: Identify interest separately, including interest on loans and other borrowing arrangements.
Income tax expense: Add back the income tax expense when using the net-profit route.
Investigate classifications before adding
Xero-style P&Ls can look tidy while still hiding classification problems. A finance lease may place interest and depreciation in different accounts, and one portion may sit inside an operating expense group. Owner wages may be a legitimate market salary, a discretionary payment, or a mixture of salary and drawings. Treating every owner-related payment as an add-back will overstate operating performance.
One-off gains also need attention. An asset disposal gain or insurance receipt shouldn't be treated as recurring trading revenue merely because it appears above the profit line. Likewise, a stock write-down may be a genuine operating cost, even if it feels unusual in the current period.
Before calculating: Export the detailed P&L, mark the four standard add-backs, trace depreciation and amortisation to supporting schedules, and document anything outside standard EBITDA separately.
The final input checklist is simple:
Confirm the reporting period and accounting basis.
Identify net profit and operating profit.
Separate interest from other finance income or costs.
Confirm income tax expense.
Tie depreciation to the fixed-asset register.
Tie amortisation to the relevant intangible schedule.
Investigate unusual gains, losses, leases, owner payments, and stock adjustments.
If the accounts aren't clean enough to support that trail, the problem isn't the EBITDA formula. It's the reporting system underneath it.
Standard Add-Backs Versus Normalisation Adjustments
The most important discipline in EBITDA reporting is separating standard EBITDA from adjusted EBITDA. Standard EBITDA adds back interest, tax, depreciation, and amortisation. Adjusted EBITDA starts with that result and then applies separately documented normalisation adjustments.
The distinction matters because optional adjustments can be subjective. Australian guidance on calculating EBITDA and adjusted figures highlights the risk of treating owner wages, one-off expenses, and non-operating items as standard add-backs. They aren't part of the core four-item formula.
The standard bridge
A standard reconciliation should show:
Interest: Add back relevant interest expense when starting from net profit.
Tax: Add back income tax expense when starting from net profit.
Depreciation: Add back the expense recorded for tangible assets.
Amortisation: Add back the expense recorded for intangible assets.
That bridge should be repeatable across periods. If the same cost appears every month, it usually belongs in EBITDA, even if the owner dislikes the cost or believes it could be reduced.
The separate adjustment schedule
A normalisation adjustment may be defensible when it represents a clearly identifiable, non-recurring, non-operating, or owner-specific item. Examples can include a one-off legal matter, documented relocation costs, a restructuring expense, or owner remuneration above a supportable market level. The test isn't whether the adjustment improves the number. The test is whether you can explain why the cost doesn't represent the ongoing operation and support that explanation with records.
Treatment | Examples | Documentation needed |
|---|---|---|
Standard EBITDA add-back | Interest, tax, depreciation, amortisation | P&L and supporting schedules |
Potential normalisation | One-off legal matter, unusual relocation, restructuring | Invoices, contracts, board or management explanation |
Usually retained | Ordinary wages, rent, software, marketing, freight | Normal operating records |
High-risk adjustment | Recurring personal or discretionary costs | Clear business purpose and consistent policy |
Owner wages require particular care. A buyer replacing the owner may need to adjust remuneration to a market level, but that doesn't mean the entire salary disappears from operating costs. The defensible approach is usually to retain a reasonable ongoing wage and document only the difference as a potential adjustment.
An abnormal stock write-down may also require analysis. If it reflects an isolated event, a buyer may want to understand the result without it. If it reveals weak purchasing controls or recurring obsolescence, adding it back hides a real operating issue.
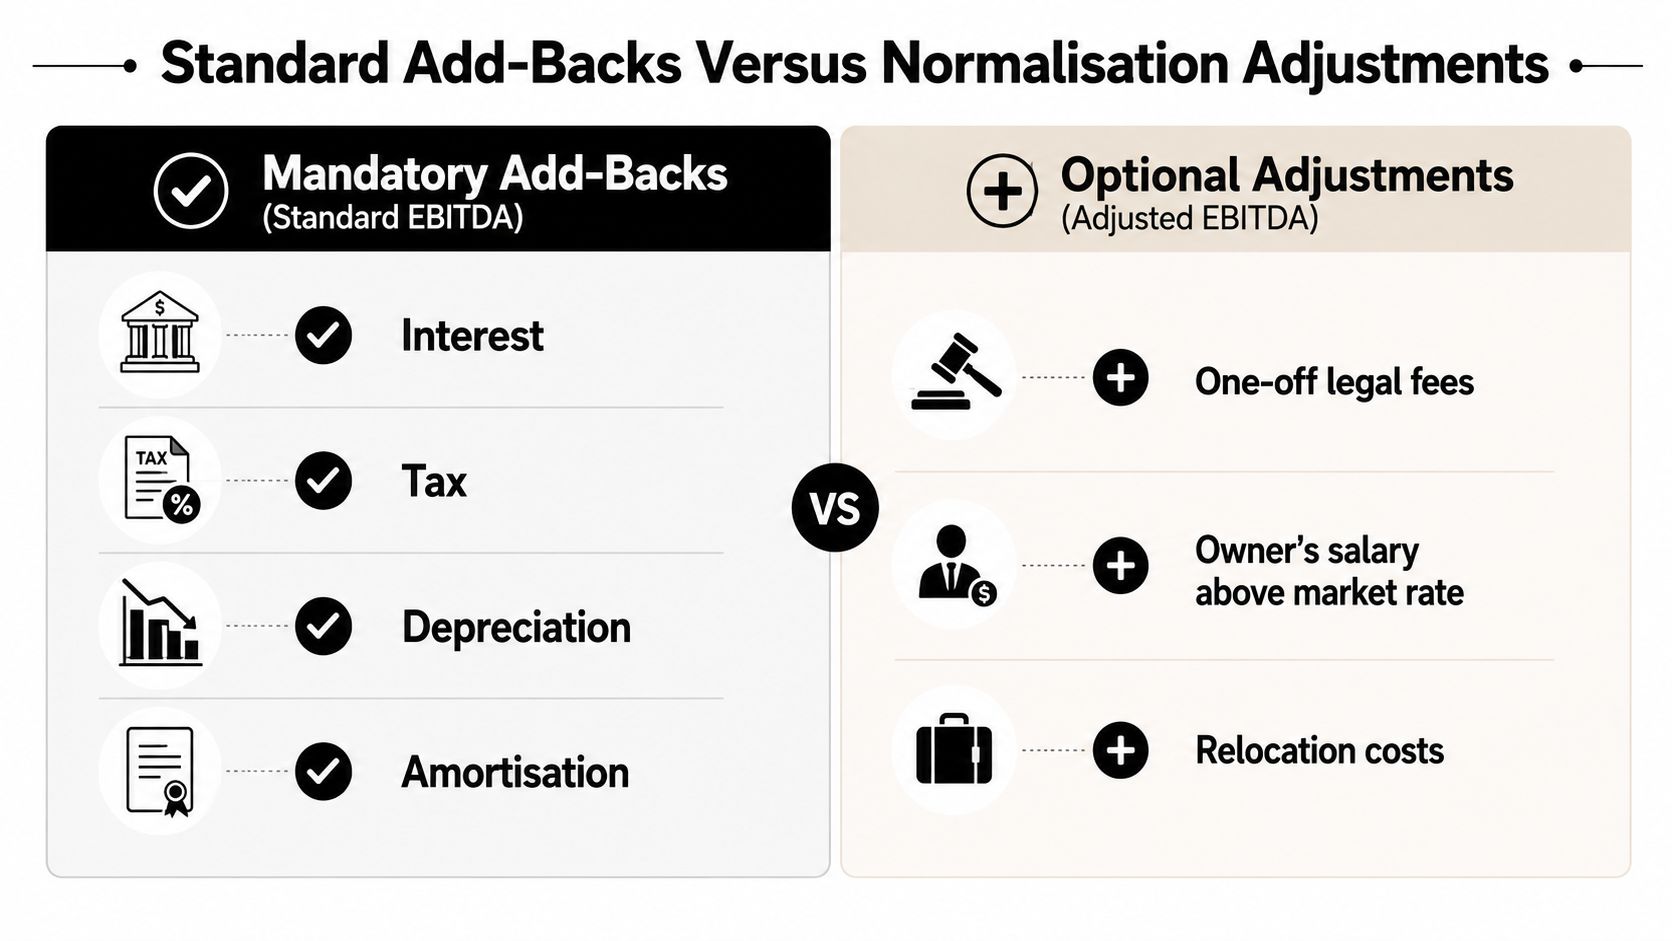
Keep both figures visible. Standard EBITDA supports consistency. Adjusted EBITDA supports a specific commercial discussion, but only when every adjustment is transparent.
Worked Examples Across Common Business Types
The formula stays constant, but the interpretation changes with the business model. The examples below use hypothetical P&Ls to show the calculation mechanics. The EBITDA margin is calculated as EBITDA divided by revenue, so the percentage is specific to each example rather than an industry benchmark.
Line item | Ecommerce (AUD) | Retail (AUD) | Services (AUD) |
|---|---|---|---|
Revenue | 1,000,000 | 1,000,000 | 1,000,000 |
COGS or direct delivery costs | 500,000 | 550,000 | 150,000 |
Operating expenses before D&A | 330,000 | 330,000 | 650,000 |
Depreciation | 30,000 | 40,000 | 10,000 |
Amortisation | 10,000 | 5,000 | 5,000 |
Interest | 20,000 | 25,000 | 15,000 |
Tax | 30,000 | 15,000 | 30,000 |
Net profit | 80,000 | 35,000 | 140,000 |
EBITDA | 120,000 | 80,000 | 155,000 |
EBITDA margin | 12% | 8% | 15.5% |
Ecommerce
The ecommerce brand starts with net profit of AUD 80,000. Add interest of AUD 20,000, tax of AUD 30,000, depreciation of AUD 30,000, and amortisation of AUD 10,000.
AUD 80,000 + AUD 20,000 + AUD 30,000 + AUD 30,000 + AUD 10,000 = AUD 170,000
That arithmetic doesn't match the table because the listed P&L lines need to reconcile. The operating route provides the correct result from the stated operating structure:
AUD 1,000,000 revenue − AUD 500,000 direct costs − AUD 330,000 operating expenses = AUD 170,000 operating profit
Add depreciation and amortisation, and EBITDA becomes AUD 210,000. This exposes an important practical issue: a worked example is only useful when every line agrees. The table therefore needs correction before use. A clean calculation should never proceed with contradictory source figures.
Retail
Retail businesses often require closer review of stock movements, write-downs, rent, and wages. A stock adjustment that reflects ordinary shrinkage or obsolescence remains part of operating performance. Removing it without evidence can make the shop look healthier than it is.
Services
Professional services businesses usually have fewer inventory complications, but owner labour can dominate the result. Drawings aren't automatically an EBITDA expense or add-back. First identify whether the payment is salary, distribution, or a personal transaction recorded incorrectly. Then decide whether any remuneration adjustment belongs in a separate normalisation schedule.
The practical lesson is simple: calculate the number, then interrogate the cost structure behind it. A higher margin doesn't automatically mean a stronger business if revenue quality, working capital, labour capacity, or asset replacement needs have been ignored.
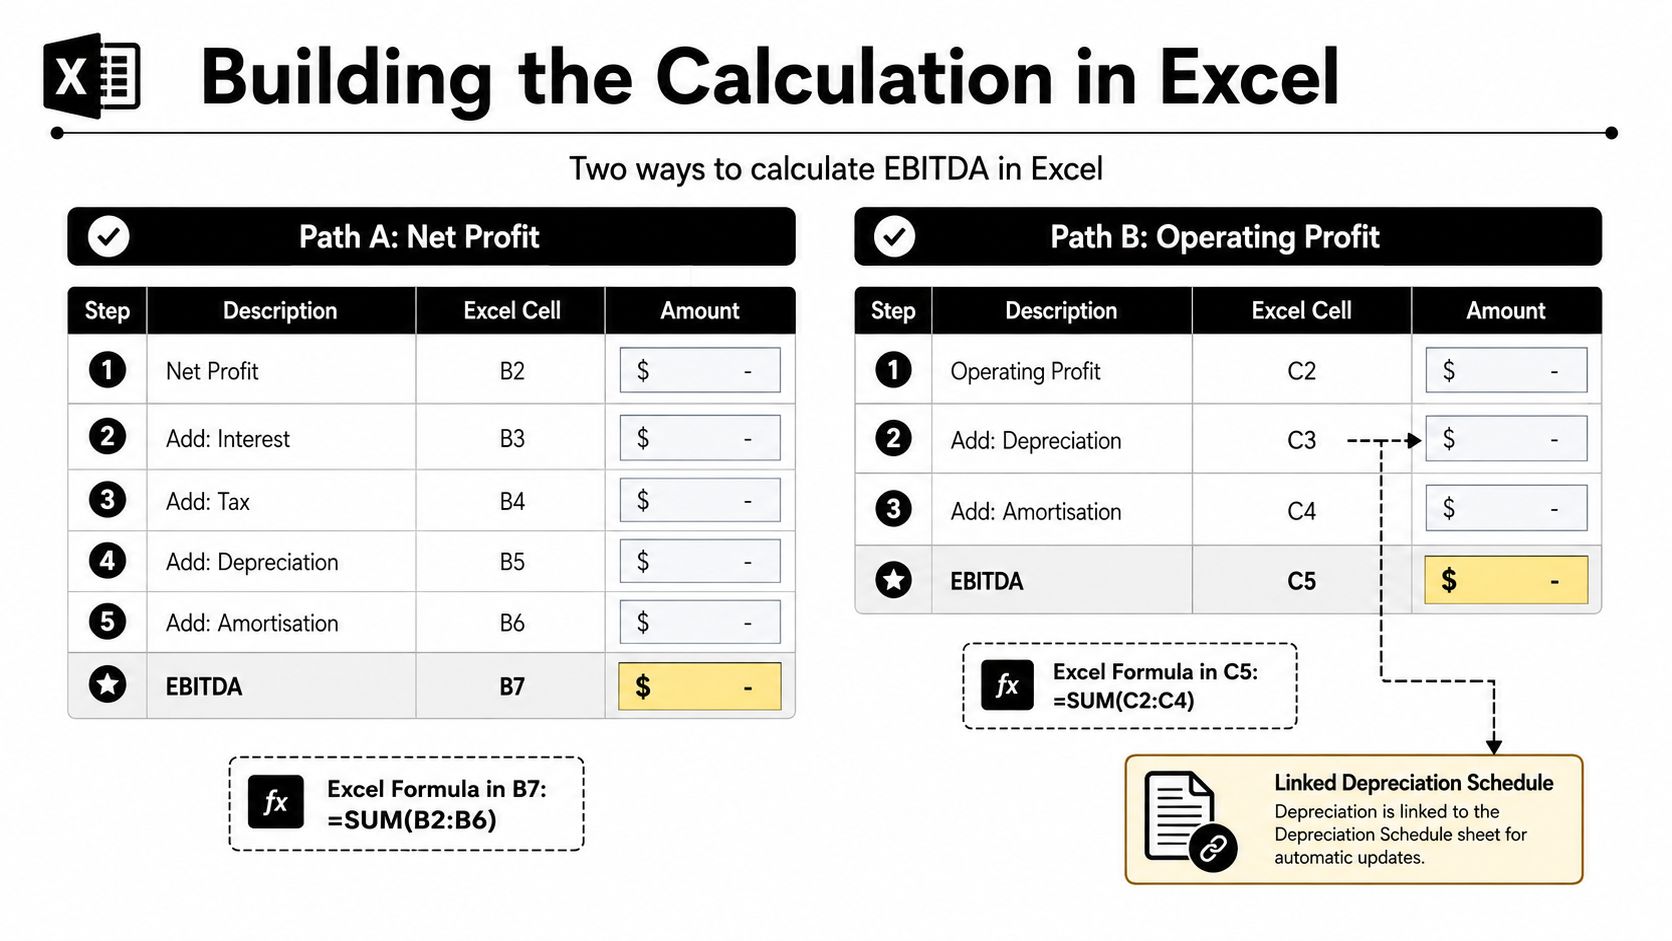
Building the Calculation in Excel
A spreadsheet becomes useful when it preserves the audit trail. Don't type one EBITDA number into a blank cell. Create a bridge that links to the P&L and supporting schedules, then use the same structure each month.
Set up a simple worksheet with the following cells:
Cell | Label | Input |
|---|---|---|
B2 | Net profit | P&L net profit |
B3 | Interest | Finance cost detail |
B4 | Tax | Income tax expense |
B5 | Depreciation | Fixed-asset schedule |
B6 | Amortisation | Intangible schedule |
B7 | EBITDA | Formula |
B9 | Operating profit | P&L operating profit |
B10 | Depreciation | Linked schedule |
B11 | Amortisation | Linked schedule |
B12 | EBITDA | Formula |
For the net-profit route, enter:
=SUM(B2:B6)
For the operating-profit route, enter:
=SUM(B9:B11)
The two EBITDA cells should agree. If they don't, use the difference as an investigation flag rather than forcing one result to match the other.
Add a rolling view
For a monthly tracker, put each month in a column and each P&L line in a row. If January begins in column B and December ends in column M, your monthly EBITDA row can calculate each period independently. A trailing-twelve-month figure can then sum the latest twelve monthly EBITDA cells.
For example, if the current twelve months occupy C14:N14, use:
=SUM(C14:N14)
When the next month arrives, shift the range forward by one column. For a more durable workbook, use a structured Excel Table and a rolling window based on the reporting date rather than manually changing ranges.
Keep a separate tab for:
P&L imports: The source figures by month.
Depreciation schedule: Asset additions, disposals, and monthly expense.
Amortisation schedule: Intangible balances and expense.
Adjustments: Each proposed normalisation with an explanation and evidence.
Dashboard: EBITDA, EBITDA margin, and rolling trends.
A forecasting workbook can help you extend this monthly structure into planning. Use this financial forecasting template resource as a reference for organising forecast inputs and outputs.
Avoid hard-coding adjustments into the EBITDA formula. If an owner wage adjustment is buried inside =SUM(B2:B6)+45000, nobody reviewing the file can tell whether it's recurring, approved, or supported. Put it on the adjustment tab, label it clearly, and show standard EBITDA separately from adjusted EBITDA.
Benchmarking EBITDA and Common Pitfalls
A standalone EBITDA number tells you little. Start with EBITDA margin, then compare the result against the correct industry context and reporting structure. The ATO small business benchmarks provide industry comparisons for Australian firms, and the ATO advises businesses operating multiple activities to calculate each business separately.
That matters for a group running, for example, a retail operation and a consulting arm. Combining them can produce a blended margin that doesn't represent either activity. Select the correct industry code, separate the relevant P&Ls, and compare like with like.
Inventory-heavy businesses need a different reading from service businesses. Ecommerce, retail, wholesale, and manufacturing EBITDA can be affected by stock timing, freight, fulfilment, shrinkage, and purchasing decisions. A service firm may show a cleaner operating result but still depend heavily on owner capacity, unbilled work, receivables collection, and contractor classification.
The traps that change the interpretation
Calling EBITDA cash flow: EBITDA excludes depreciation and amortisation, but it doesn't capture working-capital movements, capital purchases, debt repayments, or tax payments.
Ignoring stock and receivables: A profitable P&L can coexist with cash trapped in inventory or unpaid invoices.
Mixing definitions: Don't compare standard EBITDA in one period with adjusted EBITDA in another without showing the adjustments.
Comparing entity structures blindly: Interest, tax, ownership, lease treatment, and group reporting can alter the apparent result.
Overlooking lease presentation: Lease accounting can affect where expenses appear in the P&L. Review the treatment carefully, including the considerations discussed in this guide to AASB 16 leases.
EBITDA is a starting point for better decisions, not a destination. Use it with net profit, cash flow, working capital, capital expenditure, debt commitments, and operational KPIs. The number becomes useful when you can explain what changed, why it changed, and whether the improvement will continue.
Nexist helps Australian founders turn EBITDA from a once-off calculation into a reliable management system, with forecasting, cash-flow reporting, KPI tracking, and practical support across bookkeeping, inventory, receivables, and operations. Visit Nexist to request a Business Scorecard and get a clearer view of the profit and cash decisions your business needs next.
ebitda, financial metrics, small business finance, cash flow, australian accounting

" width="24px"/><g d="M 0 24.129 L 0 0.129 L 24 0.129 L 24 24.129 Z M 0 24.129 L 0 0.129 L 24 0.129 L 24 24.129 Z M 24 3 C 24 1.344 22.656 0 21 0 L 3 0 C 1.344 0 0 1.344 0 3 L 0 21 C 0 22.656 1.344 24 3 24 L 21 24 C 22.656 24 24 22.656 24 21 Z M 6.883 8.375 L 2.863 8.375 L 2.863 20.467 L 6.883 20.467 Z M 4.899 2.545 C 3.524 2.545 2.625 3.449 2.625 4.634 C 2.625 5.795 3.496 6.724 4.846 6.724 L 4.872 6.724 C 6.273 6.724 7.146 5.795 7.146 4.634 C 7.12 3.449 6.274 2.545 4.899 2.545 Z M 16.747 8.09 C 14.614 8.09 13.659 9.263 13.124 10.086 L 13.124 8.374 L 9.105 8.374 C 9.159 9.508 9.105 20.466 9.105 20.466 L 13.124 20.466 L 13.124 13.713 C 13.124 13.352 13.15 12.99 13.257 12.732 C 13.547 12.01 14.209 11.262 15.319 11.262 C 16.773 11.262 17.355 12.372 17.355 13.996 L 17.355 20.466 L 21.374 20.466 L 21.374 13.532 C 21.374 9.818 19.391 8.09 16.747 8.09 Z" fill="transparent" height="24.12890599668026px" id="dSFdkJotL" width="24px"><path d="M 0 24 L 0 0 L 24 0 L 24 24 Z" fill="transparent" height="24px" id="wscNJE44G" transform="translate(0 0.129)" width="24px"/><g d="M 0 24.129 L 0 0.129 L 24 0.129 L 24 24.129 Z M 24 3 C 24 1.344 22.656 0 21 0 L 3 0 C 1.344 0 0 1.344 0 3 L 0 21 C 0 22.656 1.344 24 3 24 L 21 24 C 22.656 24 24 22.656 24 21 Z M 6.883 8.375 L 2.863 8.375 L 2.863 20.467 L 6.883 20.467 Z M 4.899 2.545 C 3.524 2.545 2.625 3.449 2.625 4.634 C 2.625 5.795 3.496 6.724 4.846 6.724 L 4.872 6.724 C 6.273 6.724 7.146 5.795 7.146 4.634 C 7.12 3.449 6.274 2.545 4.899 2.545 Z M 16.747 8.09 C 14.614 8.09 13.659 9.263 13.124 10.086 L 13.124 8.374 L 9.105 8.374 C 9.159 9.508 9.105 20.466 9.105 20.466 L 13.124 20.466 L 13.124 13.713 C 13.124 13.352 13.15 12.99 13.257 12.732 C 13.547 12.01 14.209 11.262 15.319 11.262 C 16.773 11.262 17.355 12.372 17.355 13.996 L 17.355 20.466 L 21.374 20.466 L 21.374 13.532 C 21.374 9.818 19.391 8.09 16.747 8.09 Z" fill="transparent" height="24.12890599668026px" id="sTpjGo1tb" width="24px"><path d="M 0 24 L 0 0 L 24 0 L 24 24 Z" fill="transparent" height="24px" id="s7ffpmKOD" transform="translate(0 0.129)" width="24px"/><g d="M 24 3 C 24 1.344 22.656 0 21 0 L 3 0 C 1.344 0 0 1.344 0 3 L 0 21 C 0 22.656 1.344 24 3 24 L 21 24 C 22.656 24 24 22.656 24 21 Z M 6.883 8.375 L 2.863 8.375 L 2.863 20.467 L 6.883 20.467 Z M 4.899 2.545 C 3.524 2.545 2.625 3.449 2.625 4.634 C 2.625 5.795 3.496 6.724 4.846 6.724 L 4.872 6.724 C 6.273 6.724 7.146 5.795 7.146 4.634 C 7.12 3.449 6.274 2.545 4.899 2.545 Z M 16.747 8.09 C 14.614 8.09 13.659 9.263 13.124 10.086 L 13.124 8.374 L 9.105 8.374 C 9.159 9.508 9.105 20.466 9.105 20.466 L 13.124 20.466 L 13.124 13.713 C 13.124 13.352 13.15 12.99 13.257 12.732 C 13.547 12.01 14.209 11.262 15.319 11.262 C 16.773 11.262 17.355 12.372 17.355 13.996 L 17.355 20.466 L 21.374 20.466 L 21.374 13.532 C 21.374 9.818 19.391 8.09 16.747 8.09 Z" fill="transparent" height="24.000006px" id="D0ecaHEcW" transform="translate(0 0)" width="24px"><path d="M 24 3 C 24 1.344 22.656 0 21 0 L 3 0 C 1.344 0 0 1.344 0 3 L 0 21 C 0 22.656 1.344 24 3 24 L 21 24 C 22.656 24 24 22.656 24 21 Z" fill="rgb(55, 184, 218)" height="24.000006px" id="IPLFE6zXx" width="24px"/><path d="M 4.02 0 L 0 0 L 0 12.092 L 4.02 12.092 Z" fill="rgb(255, 255, 255)" height="12.09201px" id="FWhtzAyuY" transform="translate(2.863 8.375)" width="4.02px"/><path d="M 2.274 0 C 0.899 0 0 0.904 0 2.089 C 0 3.25 0.871 4.179 2.221 4.179 L 2.247 4.179 C 3.648 4.179 4.521 3.25 4.521 2.089 C 4.495 0.904 3.649 0 2.274 0 Z" fill="rgb(255, 255, 255)" height="4.17876px" id="VmOsKv4kO" transform="translate(2.625 2.545)" width="4.52095px"/><path d="M 7.641 0 C 5.509 0 4.554 1.173 4.019 1.996 L 4.019 0.284 L 0 0.284 C 0.053 1.419 0 12.376 0 12.376 L 4.019 12.376 L 4.019 5.623 C 4.019 5.262 4.045 4.9 4.151 4.642 C 4.442 3.92 5.103 3.172 6.214 3.172 C 7.667 3.172 8.25 4.282 8.25 5.907 L 8.25 12.376 L 12.269 12.376 L 12.269 5.442 C 12.269 1.728 10.286 0 7.641 0 Z" fill="rgb(255, 255, 255)" height="12.37626px" id="n1XUbhaq0" transform="translate(9.105 8.09)" width="12.268830000000001px"/></g></g></g></g></svg>)