
What Is a Profit and Loss Statement? a 2026 AU Guide
Unsure what is a profit and loss statement? Our guide explains the P&L for Australian businesses, from COGS and net profit to cash flow and BAS.
Ansh Malhotra

A Profit and Loss (P&L) statement is a financial report that summarises a company's revenues, costs, and expenses over a specific period, answering the core question: is the business making or losing money? In Australia, it's formally called a statement of profit or loss, and it's the primary report used to determine whether a business recorded a profit or a loss for that period.
If you're looking at your bank balance and wondering why the cash feels tight even though the accountant says the business is profitable, you're asking the right question. That confusion is common in Australian SMEs, especially when stock, unpaid invoices, supplier timing, or tax obligations sit between reported profit and actual cash in the bank.
A good P&L is useful because it gives you the operating story. It shows what you sold, what it cost to deliver, what you spent to run the business, and what was left at the end. But it doesn't tell you everything. A founder who treats the P&L as a cash report can make bad calls on hiring, pricing, stock purchases, and drawings.
That's why understanding what is a profit and loss statement matters. Not as an accounting exercise, but as a decision tool.
Table of Contents
Your P&L The Financial Story of Your Business
A P&L is the movie of your business. It covers a period of time and shows how the business performed across that period. Your balance sheet is different. It's a snapshot taken on one date.
That distinction matters more than most founders realise. A snapshot can tell you where you stand. A movie shows how you got there.
Why founders get tripped up by the P&L
Most founders don't struggle because the maths is hard. They struggle because the report answers a narrower question than they expect. The P&L answers whether the business made money over a period. It doesn't answer whether you can comfortably pay wages next week.
Imagine it as a school report card. It tells you how the term went overall, subject by subject, and whether the result was strong or weak. It does not tell you how much cash is sitting in the wallet today.
That's why this report becomes so important in operational businesses. If you run a trade, consultancy, ecommerce brand, freight business, venue, or product company, your P&L helps you spot whether pricing is working, whether direct costs are creeping up, and whether overheads are swallowing margin. For a niche example of how this thinking applies in a service business with tight labour control, this guide to financial management for cleaning businesses is useful because it shows how margins can look fine on paper while delivery costs gradually expand.
The Australian definition matters
In Australia, the formal term is statement of profit or loss under AASB 101, and it's the primary financial document used to determine whether an entity achieved a surplus or deficit over a reporting period, according to the AASB 101 standard.
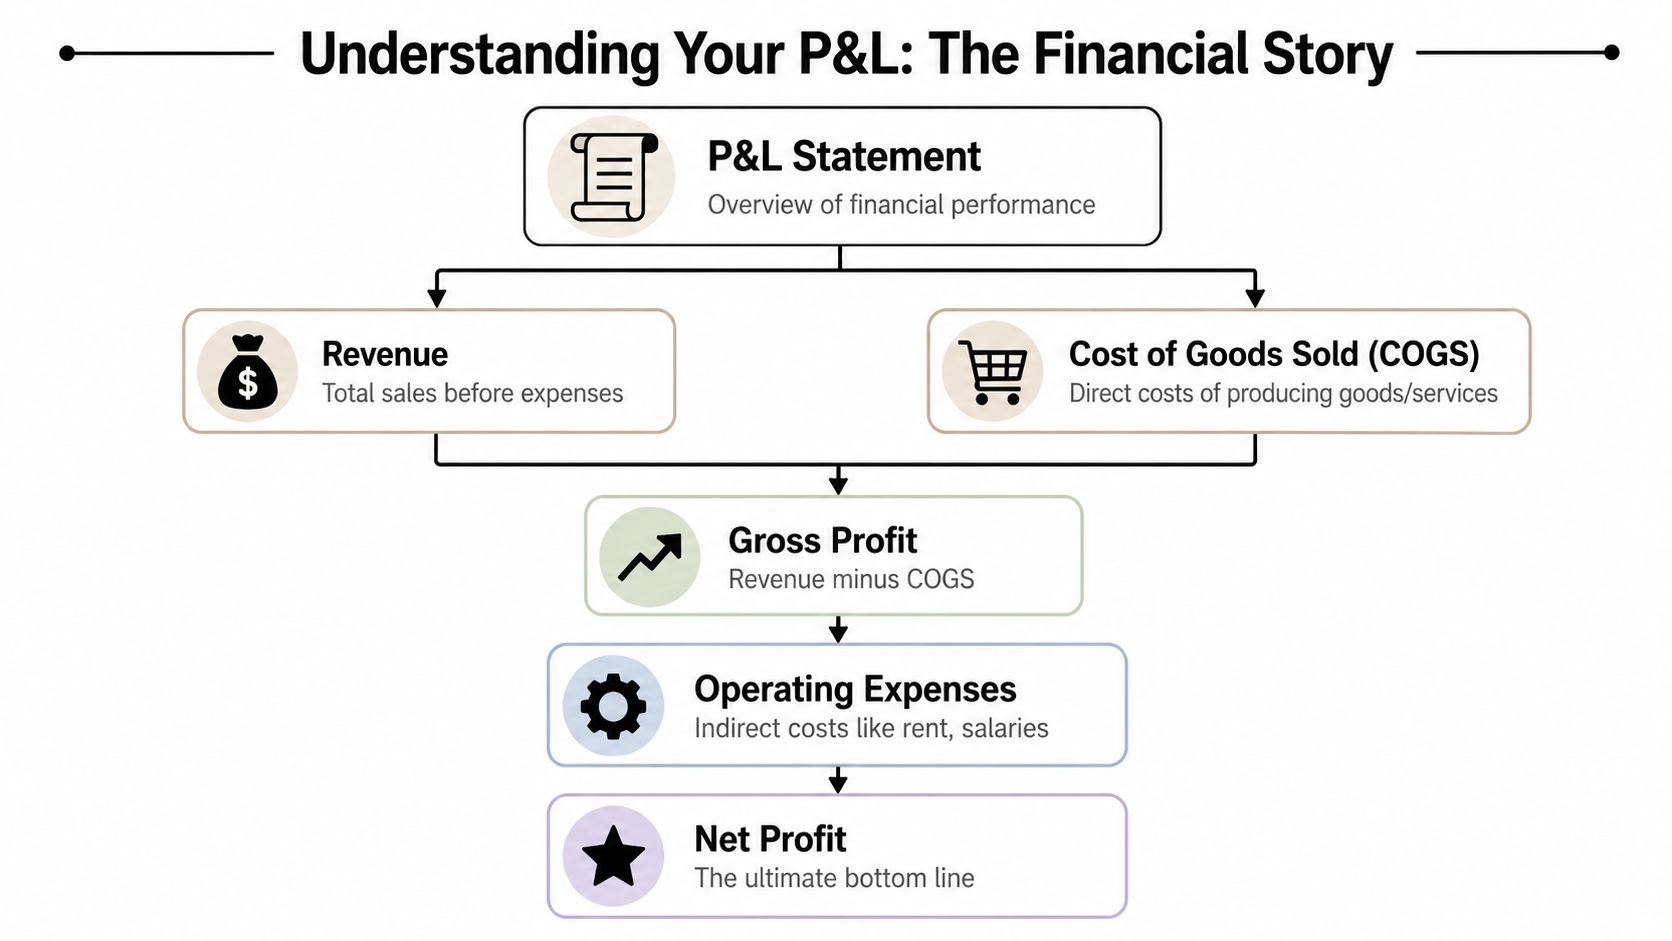
A properly structured P&L usually follows a simple logic:
Revenue first: What the business earned in the period.
Then COGS: The direct cost of producing goods or delivering what was sold.
Then gross profit: Revenue less direct costs.
Then operating expenses: The cost of keeping the business running.
Then net profit: What remains after the full stack of expenses, including items such as interest, depreciation, and tax.
Practical rule: If you can't explain why gross profit moved, don't trust the bottom line yet.
AASB 101 also requires comparative information for the preceding period, which is one reason decent reporting should never show a single isolated column. You want current period performance next to the prior period so you can see whether revenue improved, margins tightened, or overhead drifted.
When founders start using the P&L this way, the report stops being something “for the accountant” and starts becoming a tool for pricing, cost control, and decisions.
Decoding Your P&L Key Line Items Explained
The fastest way to read a P&L is top to bottom. Each line answers a different business question. If you skip straight to net profit, you miss where the actual issue sits.
Start at the top line
Revenue is your top line. It's the money earned from selling your products or services during the period. If revenue is growing but profit is shrinking, growth isn't the win it appears to be.
Cost of Goods Sold (COGS) is the direct cost of what you sold. For a retailer, that's stock. For a manufacturer, it may include materials and production inputs. For a service business, it often includes direct labour or contractor costs tied to delivery. COGS should move with sales activity.
Gross Profit is revenue minus COGS. This is your first real test of commercial quality. If gross profit is too thin, the problem is usually pricing, direct input costs, discounting, wastage, or poor job estimation.
Operating Expenses are the costs of running the business that aren't directly tied to one sale. Think rent, admin wages, software subscriptions, marketing, insurance, and office costs. These are often called overheads. They matter because a business can have decent gross profit and still lose money after overhead.
Operating Profit sits below operating expenses. This tells you whether the core engine works before financing and tax effects muddy the picture.
Net Profit is the bottom line after all expenses. It's the final answer to whether the business made or lost money for the period.
COGS is the cost of delivering the thing you sold. Operating expenses are the cost of keeping the doors open so you can sell it.
If you sell through marketplaces or newer channels, channel-specific reporting can distort how fees, refunds, and fulfilment costs appear. For founders selling there, this guide to understand TikTok Shop profit and loss is a good example of why channel economics need their own reading, not just a generic P&L glance.
A simplified P&L example
A sample table makes the structure easier to read.
Line Item | Amount (AUD) |
|---|---|
Revenue | 100,000 |
Cost of Goods Sold | 45,000 |
Gross Profit | 55,000 |
Operating Expenses | 35,000 |
Operating Profit | 20,000 |
Interest, Depreciation, Tax | 8,000 |
Net Profit | 12,000 |
This simplified example shows the logic, not a benchmark. The absolute numbers matter less than what each layer tells you.
A founder should read that table like this:
Revenue check: Did sales land where expected?
Gross profit check: Did direct costs eat too much of each sale?
Overhead check: Did operating expenses grow faster than the business?
Bottom-line check: After everything, did enough profit remain?
What each layer helps you decide
Revenue helps with sales decisions: Are you selling enough, and in the right mix?
COGS helps with pricing and delivery decisions: Are jobs, products, or orders being fulfilled efficiently?
Gross profit helps with commercial decisions: Can the business afford overhead and still reward the owner?
Operating expenses help with cost discipline: Is the business carrying software, wages, rent, or admin costs it can't justify?
Net profit helps with strategic calls: Is there enough left to reinvest, reduce debt, or build a buffer?
That's the answer to what is a profit and loss statement. It's not just a list of income and expenses. It's a ladder of decisions.
Beyond the Numbers How to Interpret Your P&L for Growth
It's 28 June. Sales looked strong all quarter, your P&L shows a profit, and you still feel a knot in your stomach because payroll, BAS, and supplier payments are all due before the biggest customers pay. That's the moment a founder learns the core function of the P&L. It measures profitability, but it does not show the full timing of cash.
A useful P&L review starts with one question. If this business is profitable on paper, why does the bank balance feel tight?
For Australian SMEs, that gap is common. Service businesses often book revenue weeks before cash lands. Inventory businesses often show profit while cash is sitting on shelves in stock that has not sold yet. Both can look healthy in the P&L and still hit a cash squeeze.
Read the P&L like an operator, not just an owner
A P&L works like your business's report card. A good mark matters, but the comments matter more because they tell you what to fix.
I look for movement, not just totals. Revenue can rise while margin falls. Net profit can improve while cash gets worse. Overheads can look stable as a percentage, but one or two new hires may have changed the break-even point.
The practical causes are usually straightforward:
Receivables are stretching out: Revenue is booked, but customers have not paid.
Stock is absorbing cash: Inventory purchases hit the bank before those items turn into sales.
Payment timing is uneven: Suppliers, wages, and GST often need cash before customer receipts catch up.
Debt distorts the picture: Loan repayments reduce cash, but only the interest portion appears in profit.
That timing issue shows up in every kind of business. Even a niche planning guide like a business plan for a cattle farm reflects the same commercial reality. Profit timing and cash timing rarely line up neatly.
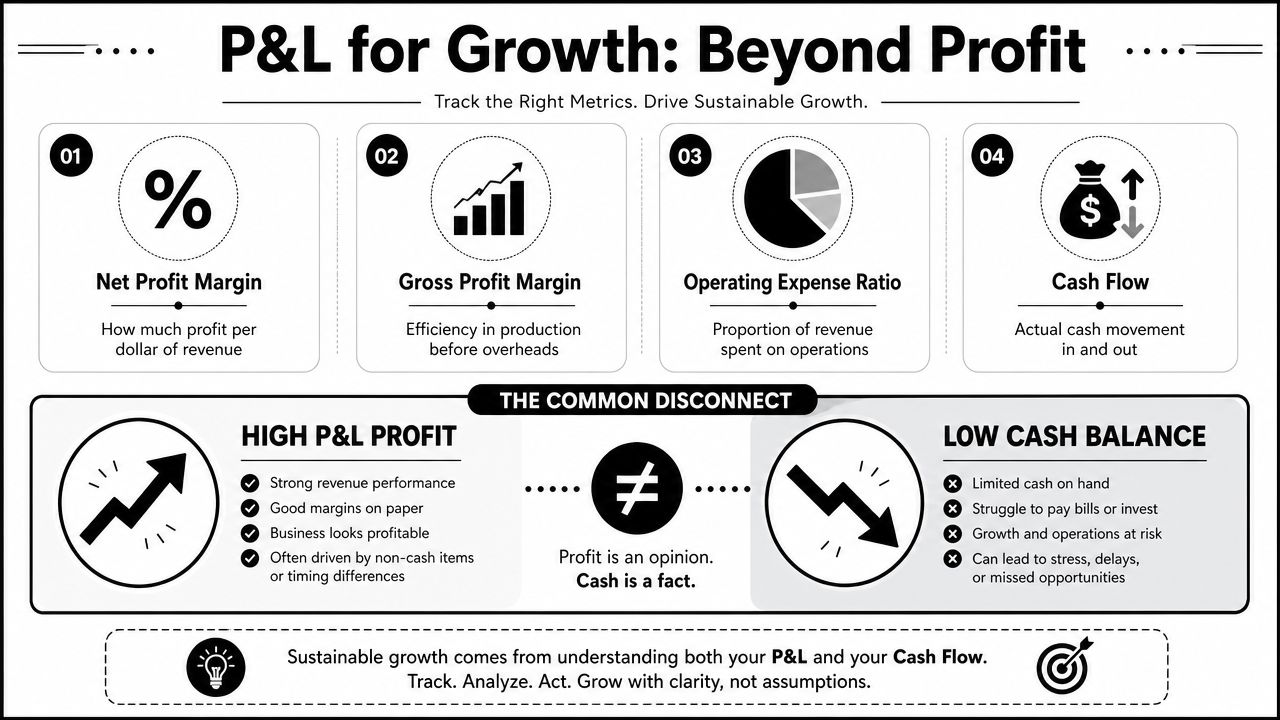
The ratios that actually help you make decisions
Raw numbers tell you what happened. Ratios help you decide what to do next.
Gross Profit Margin
Formula: Gross Profit ÷ Revenue
This ratio shows how much of each sales dollar is left after direct costs. If it slips, start with pricing discipline, discounting, labour efficiency, waste, supplier pricing, or job scoping. Founders often cut overhead too early when the primary issue sits in the gross margin.
Operating Profit Margin
Formula: Operating Profit ÷ Revenue
This ratio shows whether the core model still works after wages, software, rent, admin, and other overheads. If gross margin is holding but operating margin is falling, overhead creep is usually the problem. That can come from extra admin layers, underused subscriptions, or a team structure built for a larger business than you have today.
Net Profit Margin
Formula: Net Profit ÷ Revenue
This is the final result after interest, depreciation, and tax. It matters, but it is usually the last place to diagnose a problem. By the time net margin moves, the earlier issues have often been building for months.
A better review question is: where did margin change, and what decision caused it?
Use that lens in three ways:
Month to month: Spot drift before it becomes a cash problem.
By product, service, or channel: Sales growth can hide weak work.
Against plan: A result without a target is hard to manage.
Use the P&L with the other two statements
A standalone P&L is incomplete. Founders make better decisions when they read profit alongside the balance sheet and cash flow statement, because that shows whether profit is turning into cash or getting stuck in debtors, stock, or tax liabilities.
That's why I push growing businesses to build a three-way forecast that links profit, cash flow, and the balance sheet. It gives you a working model for questions that matter in practice. Can we afford another hire? How much stock can we buy without stressing cash? If sales jump 20%, will cash improve or get worse first?
And if you prefer a visual explainer before you build that discipline into your process, this short video is a helpful primer.
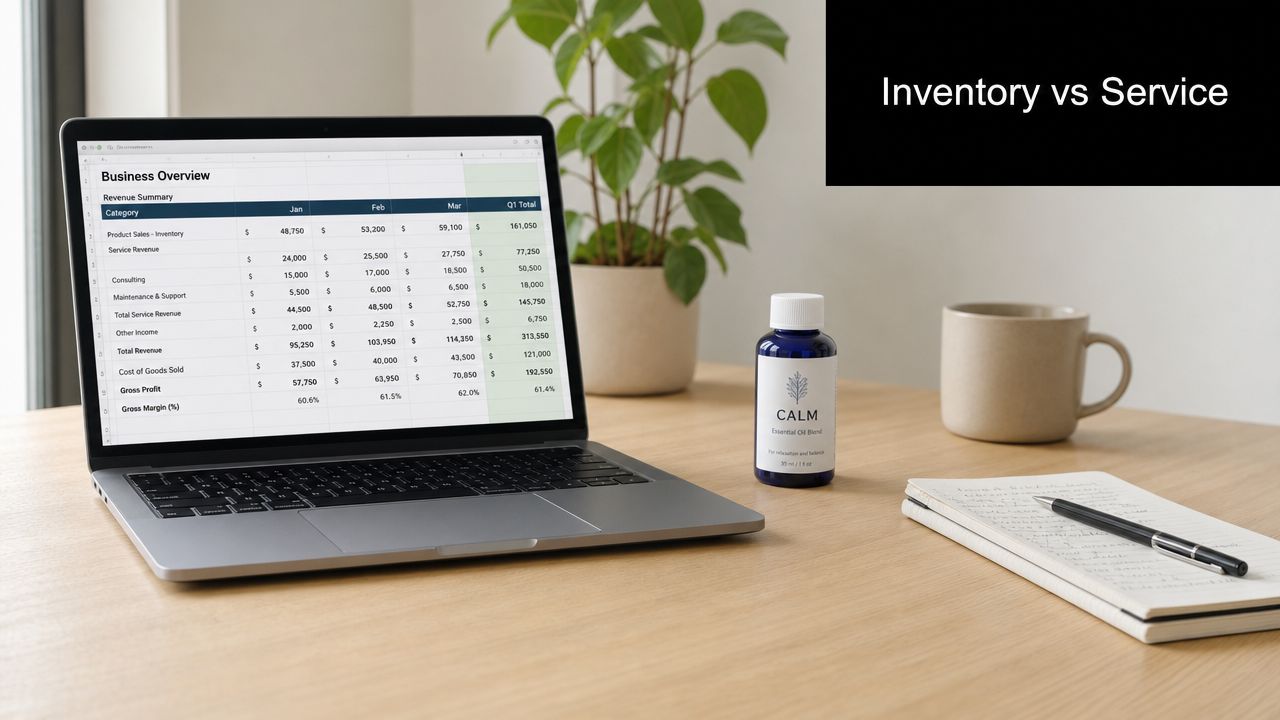
P&L Nuances for Inventory vs Service Businesses
A founder can finish the month with a healthy profit on the P&L and still feel pressure in the bank account. The reason often comes down to business model. Inventory businesses and service businesses earn revenue differently, carry different cost risks, and convert profit into cash on different timelines.
Inventory businesses need tighter margin control
In retail, ecommerce, wholesale, and manufacturing, the P&L can flatter performance when stock costing is out of date. Sales may look strong and gross profit may look acceptable, but the next purchase order reveals the truth. Replacement stock costs more, cash gets tied up on the shelf, and reported profit stops matching operating reality.
I see this often in growing product businesses. The founder reviews gross margin, assumes pricing still works, then commits to a larger reorder. A month later, cash tightens because margin was calculated on old stock cost, not what it now costs to replenish.
That is why inventory businesses need a sharper COGS lens than the average template report provides.
A better monthly habit is to check stock valuation, landed cost, write-downs, and shrinkage alongside the P&L. If your costing method needs work, this guide to inventory valuation methods for Australian businesses gives a useful framework.
If stock cost is wrong, gross profit is wrong. If gross profit is wrong, pricing, purchasing, and cash decisions all weaken.
Service businesses win or lose on delivery economics
Service businesses usually have the opposite problem. There may be little or no stock, but profit can still be overstated if delivery effort is under-measured. The direct cost is labour, subcontractors, project overruns, rework, and non-billable time.
Revenue growth can hide this for a while. A full team feels busy, invoices are going out, and the top line is rising. But if staff hours are going into underpriced jobs or scope creep, the P&L shows activity more than real profitability.
The questions are practical:
Are billable hours priced above the true cost of delivery?
Are write-offs, rework, or scope creep eroding job margin?
Are senior team members doing work that should sit with lower-cost staff?
Do salaries and contractor costs match actual utilisation?
In a service business, gross margin is often a labour efficiency measure. If sales rise and profit does not, pricing discipline, utilisation, or project control usually needs attention before anything else.
The same profit can mean very different things
Business type | Main P&L pressure point | What founders often miss | Better question to ask |
|---|---|---|---|
Inventory-heavy | COGS and stock valuation | Profit looks fine while cash is tied up in stock and replacement cost rises | Is gross profit based on current landed stock cost? |
Service-based | Direct labour and delivery time | Revenue rises but jobs consume more hours than expected | Are we recovering enough margin from the time we actually use? |
The practical takeaway is simple. Read the P&L through the economics of your model.
An online retailer should test margin against stock turns, aged inventory, and current supplier pricing. A service founder should test margin against timesheets, utilisation, scope control, and delivery mix. Both can report profit. Only one question matters in the end. Will that profit turn into cash, or is it getting absorbed before it reaches the bank?
Common P&L Mistakes and Australian Compliance
A messy P&L doesn't just create confusion. It leads to weak decisions, tax clean-up, and avoidable rework.
The mistakes that distort the story
The first common mistake is misclassification. Founders or junior bookkeepers often place costs in the wrong bucket. If direct delivery labour gets posted as overhead, gross profit appears stronger than reality. If owner drawings get mixed with expenses, the report becomes less useful immediately.
The second mistake is confusing profit with cash, which causes founders to overdraw, hire too early, or buy stock without enough funding behind the decision.
The third is ignoring accrual timing. A P&L should reflect the period the income or expense belongs to, not just when cash moved. If income is recognised in one period and the matching costs sit in another, the result can look far better or worse than the underlying business.
The fourth is forgetting depreciation and finance costs. Equipment-heavy businesses, vehicle fleets, fit-outs, and financed growth all carry costs that don't disappear just because they aren't front-of-mind operationally.
A practical review checklist helps:
Check account mapping: Make sure COGS, overheads, and non-operating items are separated properly.
Review period cut-off: Confirm sales and expenses sit in the correct month.
Scan for one-offs: Insurance claims, asset sales, or unusual costs can distort trend reading.
Reconcile with other reports: A P&L should make sense beside your balance sheet and bank movements.
Australian compliance points that matter
In Australia, this report is not optional admin. According to business.gov.au's P&L guidance, businesses are required to complete a profit and loss statement periodically to monitor performance, it is the first report an accountant pulls when preparing a tax return, and it must clearly state whether figures are GST inclusive or exclusive.

That GST point sounds small, but it causes real trouble. If one report is GST-inclusive and another is GST-exclusive, founders compare the wrong numbers, margins appear inconsistent, and BAS preparation becomes harder than it should be.
There are a few compliance habits worth locking in:
Pick a reporting basis and label it clearly. Your P&L should state whether figures include or exclude GST.
Run reports consistently. Monthly reporting catches issues earlier than waiting for year-end.
Keep estimates visible. If a figure is forecast or provisional, mark it.
Show comparatives. It's easier to defend, explain, and improve numbers when prior periods sit beside current ones.
Clean compliance reporting saves time twice. Once during the year, and again when tax work starts.
A good P&L should help with BAS, tax prep, lender questions, and management decisions. If it can't do all four, it needs work.
Turning Your P&L into a Growth Roadmap with a Virtual CFO
A P&L on its own is historical. Useful, but incomplete.
From historical report to operating tool
Its full value is realized when someone turns the report into action. That means reading trend lines, identifying margin pressure, stress-testing pricing, linking profit to cash flow, and deciding what needs to change first.
A strong finance operator will usually use the P&L to answer practical questions such as:
Where are margins leaking? Pricing, discounts, wages, stock, freight, or rework.
Which costs are fixed and which are controllable? Not every expense deserves the same response.
What should happen next month? Reporting is more useful when paired with forecasting.
What target matters? Revenue alone is a poor goal if it destroys cash.
For growing businesses, that's often where a virtual chief financial officer becomes valuable. Not because the founder can't read a report, but because someone needs to connect the report to decisions, accountability, and an operating rhythm.
The shift is simple. Stop asking only, “What happened?” Start asking, “What does this mean for pricing, stock, hiring, debt, and cash over the next quarter?” That's when the P&L starts behaving less like a compliance document and more like a roadmap.
If you want help turning your reports into decisions, Nexist works with Australian founders to improve cash flow, tighten margins, build forecasts, and create the financial systems that make growth manageable.
profit and loss statement, financial statements australia, p&l explained, business finance, virtual cfo

" width="24px"/><g d="M 0 24.129 L 0 0.129 L 24 0.129 L 24 24.129 Z M 0 24.129 L 0 0.129 L 24 0.129 L 24 24.129 Z M 24 3 C 24 1.344 22.656 0 21 0 L 3 0 C 1.344 0 0 1.344 0 3 L 0 21 C 0 22.656 1.344 24 3 24 L 21 24 C 22.656 24 24 22.656 24 21 Z M 6.883 8.375 L 2.863 8.375 L 2.863 20.467 L 6.883 20.467 Z M 4.899 2.545 C 3.524 2.545 2.625 3.449 2.625 4.634 C 2.625 5.795 3.496 6.724 4.846 6.724 L 4.872 6.724 C 6.273 6.724 7.146 5.795 7.146 4.634 C 7.12 3.449 6.274 2.545 4.899 2.545 Z M 16.747 8.09 C 14.614 8.09 13.659 9.263 13.124 10.086 L 13.124 8.374 L 9.105 8.374 C 9.159 9.508 9.105 20.466 9.105 20.466 L 13.124 20.466 L 13.124 13.713 C 13.124 13.352 13.15 12.99 13.257 12.732 C 13.547 12.01 14.209 11.262 15.319 11.262 C 16.773 11.262 17.355 12.372 17.355 13.996 L 17.355 20.466 L 21.374 20.466 L 21.374 13.532 C 21.374 9.818 19.391 8.09 16.747 8.09 Z" fill="transparent" height="24.12890599668026px" id="dSFdkJotL" width="24px"><path d="M 0 24 L 0 0 L 24 0 L 24 24 Z" fill="transparent" height="24px" id="wscNJE44G" transform="translate(0 0.129)" width="24px"/><g d="M 0 24.129 L 0 0.129 L 24 0.129 L 24 24.129 Z M 24 3 C 24 1.344 22.656 0 21 0 L 3 0 C 1.344 0 0 1.344 0 3 L 0 21 C 0 22.656 1.344 24 3 24 L 21 24 C 22.656 24 24 22.656 24 21 Z M 6.883 8.375 L 2.863 8.375 L 2.863 20.467 L 6.883 20.467 Z M 4.899 2.545 C 3.524 2.545 2.625 3.449 2.625 4.634 C 2.625 5.795 3.496 6.724 4.846 6.724 L 4.872 6.724 C 6.273 6.724 7.146 5.795 7.146 4.634 C 7.12 3.449 6.274 2.545 4.899 2.545 Z M 16.747 8.09 C 14.614 8.09 13.659 9.263 13.124 10.086 L 13.124 8.374 L 9.105 8.374 C 9.159 9.508 9.105 20.466 9.105 20.466 L 13.124 20.466 L 13.124 13.713 C 13.124 13.352 13.15 12.99 13.257 12.732 C 13.547 12.01 14.209 11.262 15.319 11.262 C 16.773 11.262 17.355 12.372 17.355 13.996 L 17.355 20.466 L 21.374 20.466 L 21.374 13.532 C 21.374 9.818 19.391 8.09 16.747 8.09 Z" fill="transparent" height="24.12890599668026px" id="sTpjGo1tb" width="24px"><path d="M 0 24 L 0 0 L 24 0 L 24 24 Z" fill="transparent" height="24px" id="s7ffpmKOD" transform="translate(0 0.129)" width="24px"/><g d="M 24 3 C 24 1.344 22.656 0 21 0 L 3 0 C 1.344 0 0 1.344 0 3 L 0 21 C 0 22.656 1.344 24 3 24 L 21 24 C 22.656 24 24 22.656 24 21 Z M 6.883 8.375 L 2.863 8.375 L 2.863 20.467 L 6.883 20.467 Z M 4.899 2.545 C 3.524 2.545 2.625 3.449 2.625 4.634 C 2.625 5.795 3.496 6.724 4.846 6.724 L 4.872 6.724 C 6.273 6.724 7.146 5.795 7.146 4.634 C 7.12 3.449 6.274 2.545 4.899 2.545 Z M 16.747 8.09 C 14.614 8.09 13.659 9.263 13.124 10.086 L 13.124 8.374 L 9.105 8.374 C 9.159 9.508 9.105 20.466 9.105 20.466 L 13.124 20.466 L 13.124 13.713 C 13.124 13.352 13.15 12.99 13.257 12.732 C 13.547 12.01 14.209 11.262 15.319 11.262 C 16.773 11.262 17.355 12.372 17.355 13.996 L 17.355 20.466 L 21.374 20.466 L 21.374 13.532 C 21.374 9.818 19.391 8.09 16.747 8.09 Z" fill="transparent" height="24.000006px" id="D0ecaHEcW" transform="translate(0 0)" width="24px"><path d="M 24 3 C 24 1.344 22.656 0 21 0 L 3 0 C 1.344 0 0 1.344 0 3 L 0 21 C 0 22.656 1.344 24 3 24 L 21 24 C 22.656 24 24 22.656 24 21 Z" fill="rgb(55, 184, 218)" height="24.000006px" id="IPLFE6zXx" width="24px"/><path d="M 4.02 0 L 0 0 L 0 12.092 L 4.02 12.092 Z" fill="rgb(255, 255, 255)" height="12.09201px" id="FWhtzAyuY" transform="translate(2.863 8.375)" width="4.02px"/><path d="M 2.274 0 C 0.899 0 0 0.904 0 2.089 C 0 3.25 0.871 4.179 2.221 4.179 L 2.247 4.179 C 3.648 4.179 4.521 3.25 4.521 2.089 C 4.495 0.904 3.649 0 2.274 0 Z" fill="rgb(255, 255, 255)" height="4.17876px" id="VmOsKv4kO" transform="translate(2.625 2.545)" width="4.52095px"/><path d="M 7.641 0 C 5.509 0 4.554 1.173 4.019 1.996 L 4.019 0.284 L 0 0.284 C 0.053 1.419 0 12.376 0 12.376 L 4.019 12.376 L 4.019 5.623 C 4.019 5.262 4.045 4.9 4.151 4.642 C 4.442 3.92 5.103 3.172 6.214 3.172 C 7.667 3.172 8.25 4.282 8.25 5.907 L 8.25 12.376 L 12.269 12.376 L 12.269 5.442 C 12.269 1.728 10.286 0 7.641 0 Z" fill="rgb(255, 255, 255)" height="12.37626px" id="n1XUbhaq0" transform="translate(9.105 8.09)" width="12.268830000000001px"/></g></g></g></g></svg>)