What Is a Business Scorecard: A 2026 Guide
Learn what is a business scorecard, which KPIs it tracks, and how Australian SMEs use it to fix cash flow, margins, and growth in under an hour a week.
Ansh Malhotra

You've got the monthly reports, the Xero file, a spreadsheet for stock, and a Slack thread full of “can we just check this on Monday?” The business is moving, but the numbers feel a step behind, so decisions end up leaning on gut feel and whatever's already on fire. That's usually the point where a business scorecard starts making sense.
A good scorecard gives you one page, a short list of KPIs, and a weekly rhythm that shows whether the business is pulling ahead or leaking cash. It's not a prettier P&L, and it's not a giant dashboard with every metric you've ever tracked. It's the few measures that tell you what to fix now.
Table of Contents
A Simple Definition Every Founder Can Use
A founder I work with can usually describe the problem in one breath. The books are up to date, the CRM is noisy, the stock spreadsheet is half manual, and nobody's sure whether sales are addressing the core issue or just keeping everyone busy. That's exactly where a business scorecard earns its keep.
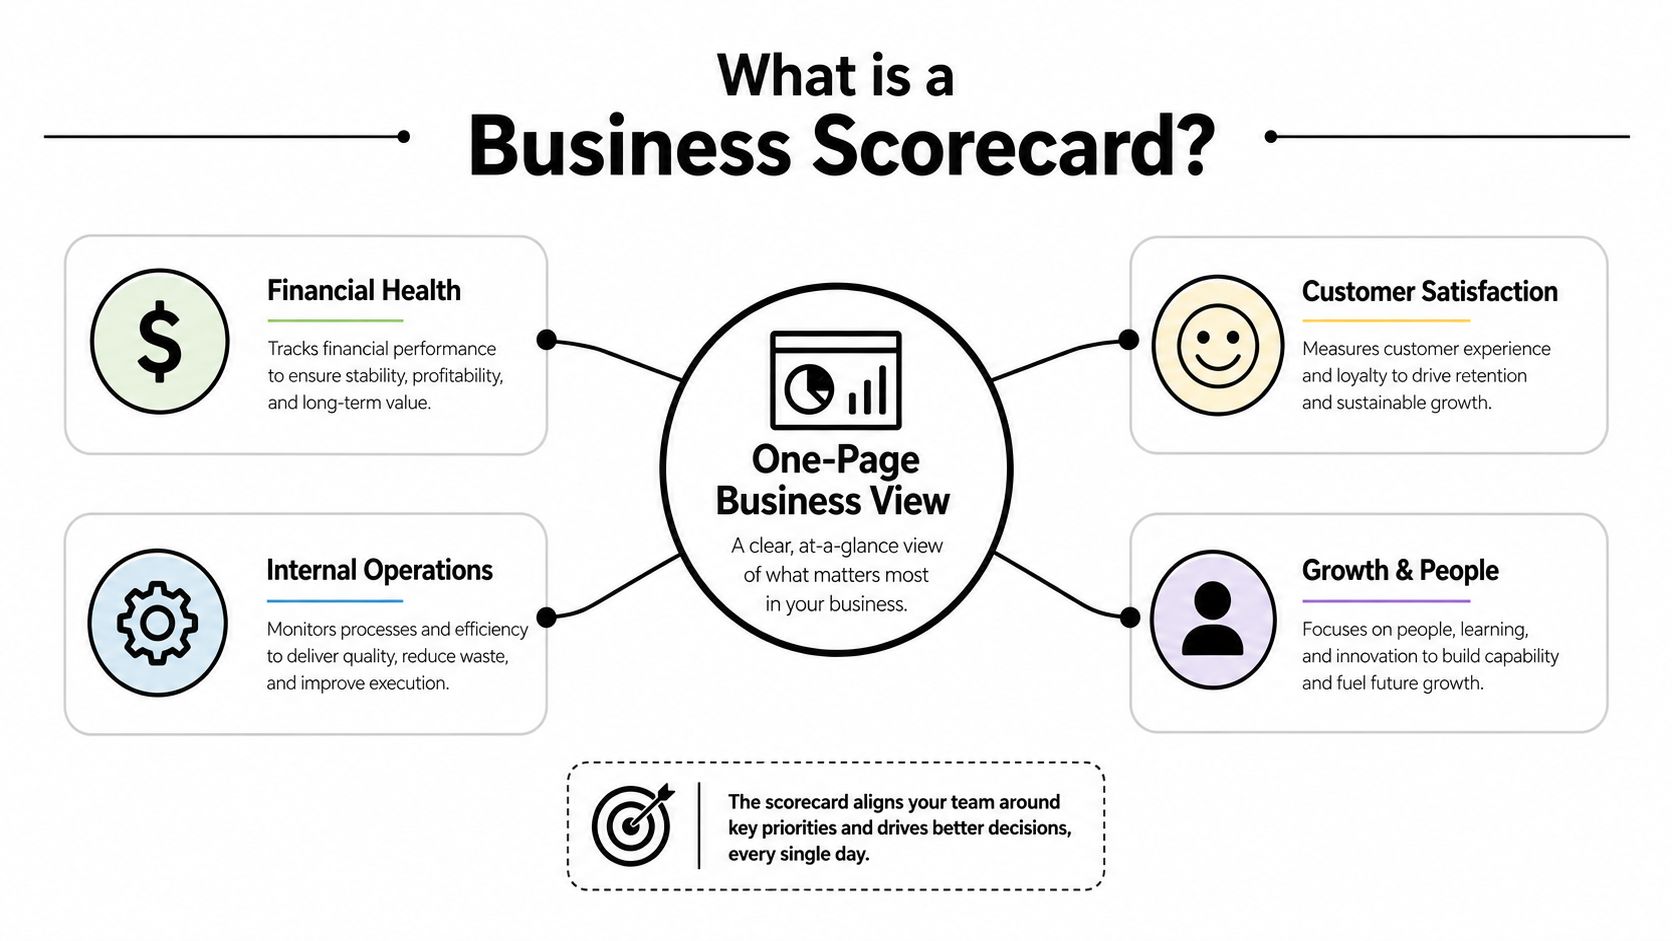
A business scorecard is a compact management tool that tracks a small set of KPIs against targets so leaders can see performance at a glance, and published guidance recommends no more than 10–12 metrics, reviewed weekly and displayed over a 13-week rolling period to support corrective action on variances, as set out in this business scorecard guide. In plain English, it's the one-page view that tells you whether the business is winning, drifting, or leaking.
That makes it different from a dashboard, a P&L, or a full spreadsheet pack. A dashboard can show a lot of useful data, but a scorecard is closer to the car dashboard than the engineering manual. You want speed, fuel, warning lights, and a few gauges that tell you when to pull over.
Practical rule: if a metric can't lead to a decision in the weekly meeting, it probably doesn't belong on the scorecard.
For Australian SMEs, this matters because strategy has to turn into operational numbers fast. A scorecard is meant to convert intent into action, so a co-founder, bookkeeper, or ops manager can see what needs attention without hunting through tabs. If you want the broader difference between a KPI set and a KPI dashboard, what is a KPI dashboard is a helpful companion read.
The practical test is simple. If you can explain the whole thing to a co-founder in under a minute, you're probably describing a scorecard correctly. If you need to scroll, filter, and “just trust me on this one”, you've built reporting noise, not management control.
The Four Perspectives Behind Every Good Scorecard
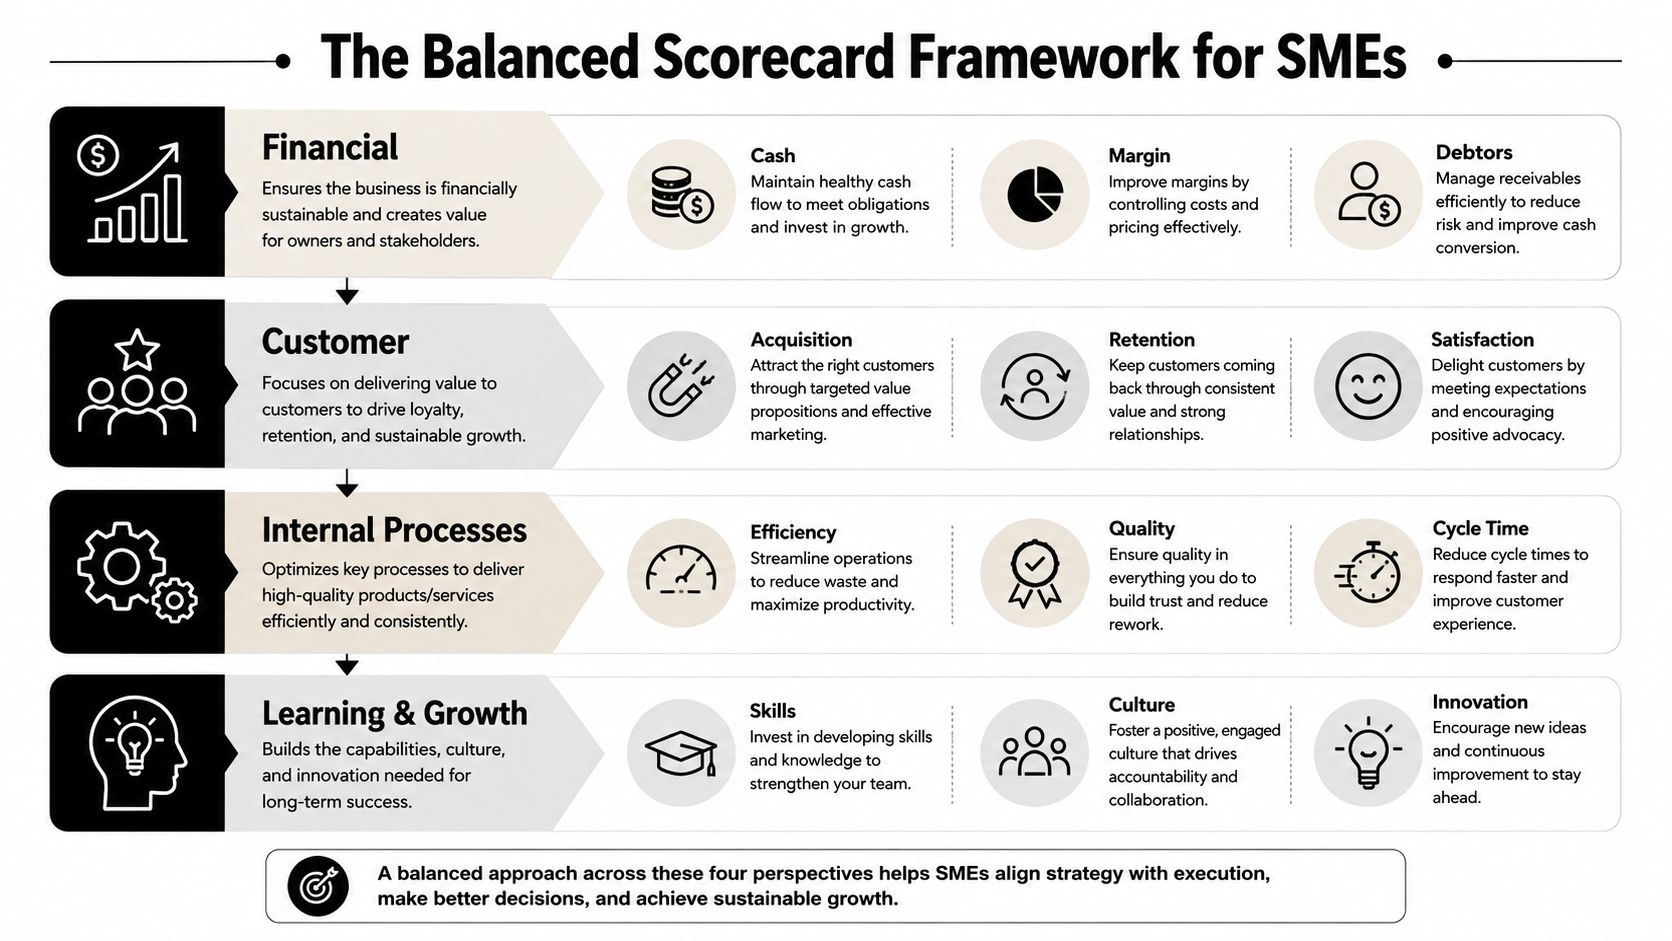
The classic balanced scorecard still matters because it stops founders from running the business on financial panic alone. The idea was formalised in 1992 by Robert Kaplan and David Norton as a way to measure performance beyond finance, including customer, internal process, and learning perspectives, as noted in this scorecard overview. That structure still works, but an SME needs it stripped down and cash-flow-first.
Financial first, because cash is the constraint
For a cafe, ecommerce store, or trades business, the financial lens usually starts with cash, margin, and debtor pressure. A rise in revenue means little if stock is tying up money or invoices are sitting unpaid. The point isn't to worship finance, it's to see the early signs of strain before payroll day.
Cash conversion is usually the first place the truth shows up.
Customer and process tell you why the money moved
Customer metrics explain whether people are coming back, buying again, or churning after the first order. Internal process metrics explain whether the business can deliver without chaos, which is where stock, throughput, and on-time performance come in. In a cafe, weak ticket speed or poor table turnover will eventually show up in the till, but the warning starts earlier on the floor.
Learning and growth is the part owners forget
The learning-and-growth side is where staff capability, SOP coverage, and automation sit. That doesn't sound urgent until a key team member goes on leave or a process breaks because only one person knows how to do it. In smaller businesses, this perspective protects the other three.
A useful way to think about the scorecard is leading versus lagging indicators. Cash in the bank is lagging. Debtor days, gross margin, and repeat purchase behaviour are the signals that help explain what happens next. If a cafe owner wants to improve cash conversion, the chain might run from menu mix and stock control through service speed and customer repeat rate to the final cash result. That's the logic of a scorecard, one goal, several linked measures, and a clearer view of cause and effect.
Which Metrics Belong on an SME Scorecard
An SME scorecard works when it stays blunt. If a metric does not change a decision, remove it. If it only flatters performance, remove it again.
For founder-led businesses, the strongest finance core is usually gross margin, net operating cash flow, debtor days, and cash conversion cycle. Those numbers tell you whether profit is real, cash is moving, and customers are paying on time. That is the practical filter I use on Australian scorecards for ecommerce, hospitality, and trades, because a short-horizon view matters more than a neat report.
If you want a broader set of KPI ideas to compare against your own setup, Jumpstart Partners' small business finance metrics guide is a useful reference point.
Build the menu around the business model
Ecommerce usually needs stock-heavy measures, because margin can look fine while cash is trapped in inventory. Hospitality needs cost control and speed, because labour and stock waste can eat through the week before the owner notices. Trades and service businesses need job margin, WIP days, quote-to-close rate, and utilisation, because the risk sits in time, labour, and project flow.
Owners often fill the scorecard with vanity metrics. Website visits, social followers, and raw enquiry counts can be useful, but only when they connect to margin, cash, or delivery. If they do not, they become distraction dressed up as insight.
A simple way to sort the list is by category:
Cash: cash balance, debtor days, cash conversion cycle.
Profit: gross margin, job margin, labour cost, stock waste.
Customers: repeat purchase, retention, conversion, complaints.
Operations: on-time delivery, table turn, throughput, stock turn, WIP.
People: SOP coverage, training completion, utilisation, automation coverage.
For ecommerce, a short list might be gross margin, stock turns, repeat customer rate, and cash conversion. For hospitality, cost of goods, labour cost pressure, average ticket, and table turn usually tell a better story than sales alone. For trades, utilisation and quote-to-close usually say more about next month than total revenue does.
The cap matters as much as the content. Published guidance recommends keeping the scorecard to 10–12 metrics and reviewing it weekly over a rolling 13-week view, so the meeting stays focused on action rather than dashboard theatre, as outlined in the business scorecard guide. The scorecard should feel a bit uncomfortable, because it forces trade-offs into the open.
For a practical planning lens that ties numbers back to decisions, Nexist's strategic and financial planning resource fits this approach.
A Sample One-Page Scorecard and Where to Build It
A scorecard only works when the owner can read it fast and see what needs action. The clean version has the metric, target, actual result, variance, trend, and a simple status flag, so the team is not guessing whether a number is acceptable. That structure keeps the conversation on the gap and the decision, which matters more than the story behind the number.
Sample SME Business Scorecard Layout
Category | Example KPI | Target | Actual | Variance | Trend | Status |
|---|---|---|---|---|---|---|
Cash | Net operating cash flow | Set by owner | Current result | Above or below target | Up, flat, down | Green, amber, red |
Profit | Gross margin | Set by owner | Current result | Above or below target | Up, flat, down | Green, amber, red |
Customers | Repeat purchase rate | Set by owner | Current result | Above or below target | Up, flat, down | Green, amber, red |
Operations | On-time delivery | Set by owner | Current result | Above or below target | Up, flat, down | Green, amber, red |
People | SOP coverage | Set by owner | Current result | Above or below target | Up, flat, down | Green, amber, red |
The variance column is where the work starts. A red status with a poor variance should trigger a root-cause discussion. An amber result with a flat trend may belong on a watch list rather than in immediate action mode. A green number that keeps drifting lower still deserves attention, because direction matters as much as colour.
The business scorecard should stay small enough to manage, and the quarterly business review approach is a useful companion when you want the weekly numbers to lead into a fuller owner review without turning the whole thing into admin.
Choose the build tool by complexity, not taste
Excel or Google Sheets is enough for a small business when the data is clean and one person can keep the file current without frustration. It is cheap and flexible, but it starts to break when people copy figures from different systems by hand.
Dedicated BI tools such as Power BI or Looker Studio make more sense once you want stronger visualisation and live feeds, but they still depend on decent source data and someone who can maintain the setup. If the source systems are messy, the dashboard will look polished while still giving you weak numbers.
An integrated finance stack is usually the better fit once transaction volume makes manual updates a waste of time. That means connecting accounting, inventory, payroll, and job systems so the scorecard pulls from source systems rather than from memory. A marketplace seller can also borrow ideas from Clickstera Solutions LLC's profitability framework for marketplace sellers when deciding which operational fields deserve a place on the page.
One practical setup is to keep the scorecard inside the finance stack, then let the reporting layer handle the visuals. A virtual CFO can shape the layout, define the KPI logic, and decide which fields should come from Xero, MYOB, stock systems, or job management tools. For a smaller founder who wants something usable in one working session, that is usually enough.
How to Read the Numbers and Run a 30-Minute Weekly Review
The scorecard only works if the weekly meeting is tight. If it turns into a recap of everything that happened, the numbers lose their force and the owner walks out with more context but no action. Keep the meeting short enough that people stay honest.
Run it in three blocks
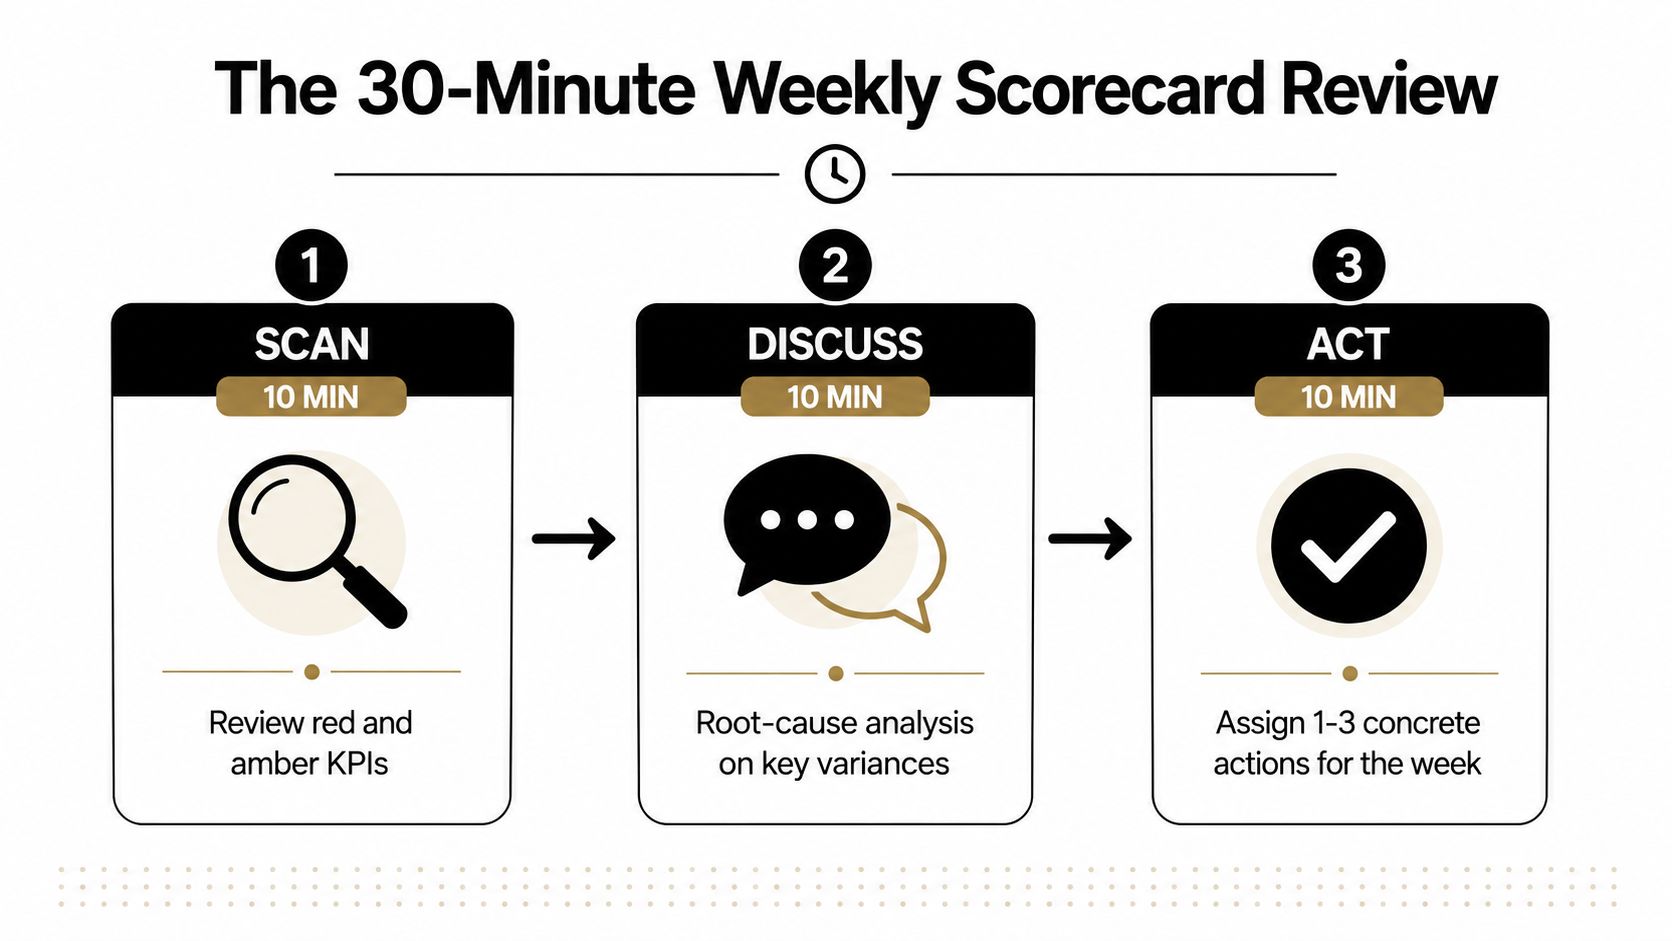
First, spend 10 minutes scanning the reds and ambers. Don't read every line aloud, just identify the few variances that could affect cash, delivery, or customer experience. Second, spend 10 minutes on root cause, and force the discussion down to the two or three issues that really matter. Third, spend 10 minutes assigning owners, deadlines, and the next check date.
Practical rule: every red metric needs an owner, a fix, and a review date before the meeting ends.
Read variance as a conversation starter, not a verdict
Variance should be read in dollars, percentages, and direction. A small percentage miss can matter if the dollar amount is large, and a green number can still be a problem if the trend is turning down. One-off blips happen, especially in seasonal businesses, but repeated misses belong in a backlog of fixes.
That backlog is worth naming. I call it a cash leak register, because the same issues tend to recur if no one writes them down and closes them out. If debtor days keep slipping, or stock keeps going missing, or labour drifts above plan, the issue shouldn't disappear after Monday's meeting.
When the cause is structural, escalate it. When the miss is one-off, hold it and watch the next cycle. The job of the review is not to be dramatic, it's to make sure the business never has the same unpleasant surprise twice.
For a deeper rhythm around owner-led review meetings, the quarterly business review approach can sit alongside the weekly scorecard and keep the bigger strategy conversation intact.
Why Most Scorecards Fail and How Automation Fixes It
Most scorecards fall over for a practical reason. Someone has to update them by hand, chase missing figures, and keep track of who owns each number. By the third week, the file is stale, the meeting becomes awkward, and everyone hopes the gaps will fix themselves before the next review.
For Australian SMEs, that pattern is getting harder to justify. A 2025 Commonwealth Bank and CPA Australia survey summary found that 43 percent of SMEs were already using AI tools and another 35 percent were considering adoption within 12 months, which points to a clear shift toward automated reporting and decision support. If parts of the business are already digital, the scorecard should stop acting like a manual spreadsheet.
Automation changes the design of the scorecard
Once accounting, inventory, payroll, and job systems feed the scorecard, the weekly review improves quickly. The team spends less time chasing numbers and more time dealing with exceptions. Alerts can go straight to the right owner, and the founder does not have to act as the human integration layer.
That is also where a virtual CFO partner earns its keep. Nexist, as one example, can design the scorecard, connect the reporting flow, and run the weekly review so the founder is not maintaining the system alone. If you are setting that up, the automating business processes resource is a useful next read.
The trade-off is straightforward. Manual scorecards are easier to start, but they decay fast. Automated scorecards take more thought up front, but they stay alive because the data arrives without friction and the meeting stays focused on decisions.
For Australian SMEs, that usually means starting with a small set of high-signal measures, wiring them to live systems where possible, and cutting any KPI that does not drive action. If the scorecard turns into a data-entry job, it is already broken. If it becomes the place where owners spot cash leaks early and fix them fast, it is doing its job.
Automation matters because the scorecard is only useful when it is current. A scorecard that depends on late exports, manual copying, and one person remembering the process will usually fail as soon as that person gets busy. That is why scorecards built for cash flow, margin, and owner accountability need cleaner inputs than a spreadsheet patched together after hours.
The fix is not more reporting for its own sake. It is a smaller scorecard tied to the systems that already hold the numbers, with exceptions flagged before the weekly meeting and owners dealing with the issue while it is still small. That approach suits resource-constrained businesses because it protects time, reduces rework, and keeps the review grounded in the decisions that move cash.
business scorecard, KPI scorecard, SME scorecard, cash flow KPIs, virtual CFO

" width="24px"/><g d="M 0 24.129 L 0 0.129 L 24 0.129 L 24 24.129 Z M 0 24.129 L 0 0.129 L 24 0.129 L 24 24.129 Z M 24 3 C 24 1.344 22.656 0 21 0 L 3 0 C 1.344 0 0 1.344 0 3 L 0 21 C 0 22.656 1.344 24 3 24 L 21 24 C 22.656 24 24 22.656 24 21 Z M 6.883 8.375 L 2.863 8.375 L 2.863 20.467 L 6.883 20.467 Z M 4.899 2.545 C 3.524 2.545 2.625 3.449 2.625 4.634 C 2.625 5.795 3.496 6.724 4.846 6.724 L 4.872 6.724 C 6.273 6.724 7.146 5.795 7.146 4.634 C 7.12 3.449 6.274 2.545 4.899 2.545 Z M 16.747 8.09 C 14.614 8.09 13.659 9.263 13.124 10.086 L 13.124 8.374 L 9.105 8.374 C 9.159 9.508 9.105 20.466 9.105 20.466 L 13.124 20.466 L 13.124 13.713 C 13.124 13.352 13.15 12.99 13.257 12.732 C 13.547 12.01 14.209 11.262 15.319 11.262 C 16.773 11.262 17.355 12.372 17.355 13.996 L 17.355 20.466 L 21.374 20.466 L 21.374 13.532 C 21.374 9.818 19.391 8.09 16.747 8.09 Z" fill="transparent" height="24.12890599668026px" id="dSFdkJotL" width="24px"><path d="M 0 24 L 0 0 L 24 0 L 24 24 Z" fill="transparent" height="24px" id="wscNJE44G" transform="translate(0 0.129)" width="24px"/><g d="M 0 24.129 L 0 0.129 L 24 0.129 L 24 24.129 Z M 24 3 C 24 1.344 22.656 0 21 0 L 3 0 C 1.344 0 0 1.344 0 3 L 0 21 C 0 22.656 1.344 24 3 24 L 21 24 C 22.656 24 24 22.656 24 21 Z M 6.883 8.375 L 2.863 8.375 L 2.863 20.467 L 6.883 20.467 Z M 4.899 2.545 C 3.524 2.545 2.625 3.449 2.625 4.634 C 2.625 5.795 3.496 6.724 4.846 6.724 L 4.872 6.724 C 6.273 6.724 7.146 5.795 7.146 4.634 C 7.12 3.449 6.274 2.545 4.899 2.545 Z M 16.747 8.09 C 14.614 8.09 13.659 9.263 13.124 10.086 L 13.124 8.374 L 9.105 8.374 C 9.159 9.508 9.105 20.466 9.105 20.466 L 13.124 20.466 L 13.124 13.713 C 13.124 13.352 13.15 12.99 13.257 12.732 C 13.547 12.01 14.209 11.262 15.319 11.262 C 16.773 11.262 17.355 12.372 17.355 13.996 L 17.355 20.466 L 21.374 20.466 L 21.374 13.532 C 21.374 9.818 19.391 8.09 16.747 8.09 Z" fill="transparent" height="24.12890599668026px" id="sTpjGo1tb" width="24px"><path d="M 0 24 L 0 0 L 24 0 L 24 24 Z" fill="transparent" height="24px" id="s7ffpmKOD" transform="translate(0 0.129)" width="24px"/><g d="M 24 3 C 24 1.344 22.656 0 21 0 L 3 0 C 1.344 0 0 1.344 0 3 L 0 21 C 0 22.656 1.344 24 3 24 L 21 24 C 22.656 24 24 22.656 24 21 Z M 6.883 8.375 L 2.863 8.375 L 2.863 20.467 L 6.883 20.467 Z M 4.899 2.545 C 3.524 2.545 2.625 3.449 2.625 4.634 C 2.625 5.795 3.496 6.724 4.846 6.724 L 4.872 6.724 C 6.273 6.724 7.146 5.795 7.146 4.634 C 7.12 3.449 6.274 2.545 4.899 2.545 Z M 16.747 8.09 C 14.614 8.09 13.659 9.263 13.124 10.086 L 13.124 8.374 L 9.105 8.374 C 9.159 9.508 9.105 20.466 9.105 20.466 L 13.124 20.466 L 13.124 13.713 C 13.124 13.352 13.15 12.99 13.257 12.732 C 13.547 12.01 14.209 11.262 15.319 11.262 C 16.773 11.262 17.355 12.372 17.355 13.996 L 17.355 20.466 L 21.374 20.466 L 21.374 13.532 C 21.374 9.818 19.391 8.09 16.747 8.09 Z" fill="transparent" height="24.000006px" id="D0ecaHEcW" transform="translate(0 0)" width="24px"><path d="M 24 3 C 24 1.344 22.656 0 21 0 L 3 0 C 1.344 0 0 1.344 0 3 L 0 21 C 0 22.656 1.344 24 3 24 L 21 24 C 22.656 24 24 22.656 24 21 Z" fill="rgb(55, 184, 218)" height="24.000006px" id="IPLFE6zXx" width="24px"/><path d="M 4.02 0 L 0 0 L 0 12.092 L 4.02 12.092 Z" fill="rgb(255, 255, 255)" height="12.09201px" id="FWhtzAyuY" transform="translate(2.863 8.375)" width="4.02px"/><path d="M 2.274 0 C 0.899 0 0 0.904 0 2.089 C 0 3.25 0.871 4.179 2.221 4.179 L 2.247 4.179 C 3.648 4.179 4.521 3.25 4.521 2.089 C 4.495 0.904 3.649 0 2.274 0 Z" fill="rgb(255, 255, 255)" height="4.17876px" id="VmOsKv4kO" transform="translate(2.625 2.545)" width="4.52095px"/><path d="M 7.641 0 C 5.509 0 4.554 1.173 4.019 1.996 L 4.019 0.284 L 0 0.284 C 0.053 1.419 0 12.376 0 12.376 L 4.019 12.376 L 4.019 5.623 C 4.019 5.262 4.045 4.9 4.151 4.642 C 4.442 3.92 5.103 3.172 6.214 3.172 C 7.667 3.172 8.25 4.282 8.25 5.907 L 8.25 12.376 L 12.269 12.376 L 12.269 5.442 C 12.269 1.728 10.286 0 7.641 0 Z" fill="rgb(255, 255, 255)" height="12.37626px" id="n1XUbhaq0" transform="translate(9.105 8.09)" width="12.268830000000001px"/></g></g></g></g></svg>)