
Sensitivity Analysis for Cash Flow and Profit
Learn sensitivity analysis methods, tools, and examples that help Australian SMEs stress-test cash flow, pricing, and inventory decisions for stronger profit.
Ansh Malhotra

A founder checks the bank account after a month of record sales and still feels uneasy. Customers are buying, invoices are going out, and the profit report looks acceptable, yet cash keeps disappearing. The problem may not be rent or payroll. A small movement in debtor days, stock turn, selling price or order volume can pull cash forward or push it out of reach before the owner has time to react.
Sensitivity analysis makes that movement visible. It flexes the assumptions inside a financial model and shows which changes affect profit, closing cash or both. For Australian SMEs, that discipline matters because working capital is often tight, margins can be narrow, and a good revenue month can still create a funding problem.
Table of Contents
What Sensitivity Analysis Really Does for Australian Founders
A Melbourne founder once reviewed a forecast that appeared to support another strong trading period. Sales were ahead of plan, gross margin looked healthy and the business had no obvious cost blowout. Then several customers took five extra days to pay. That modest extension removed $80,000 from the bank account, turning a confident hiring conversation into an urgent cash-management exercise.
The forecast hadn't failed because the arithmetic was wrong. It failed because the owner had treated debtor days as a background assumption rather than a cash driver.
Sensitivity analysis is the deliberate flexing of one or more model inputs to see which levers move an outcome, and by how much. You can change price, volume, gross margin, debtor days, stock turn, supplier terms or borrowing costs, then observe the effect on profit and cash. The useful output isn't a prettier spreadsheet. It's a clearer answer to the question, “Which assumption deserves management attention this week?”
Cash responds differently from profit
Owners often focus on visible fixed costs, such as rent, salaries and software subscriptions. Those costs matter, but they may not be the first variables to test in a cash-flow-heavy business. A small change in debtor days can delay cash already earned. A slower stock turn can trap cash in products that haven't sold. A supplier tightening payment terms can create an immediate funding requirement without changing reported revenue.
That distinction is why a cash-first model starts with:
Price: What happens to contribution and demand if the selling price changes?
Volume: How much cash is generated if units sold fall or rise?
Debtor days: How quickly do invoices become bank receipts?
Stock turn: How much money sits in inventory before sale?
Supplier terms: How much time does the business have before paying for inputs?
Australian government guidance treats sensitivity analysis as a formal step in cost-benefit analysis. The Office of Impact Analysis cost-benefit analysis process places it after net present value is calculated and uses it to identify critical assumptions. Treasury guidance similarly directs analysts to recalculate outcomes using alternative values for uncertain and important assumptions.
Practical rule: Test the inputs that change the timing of cash, not only the inputs that change the size of profit.
Four levels of useful analysis
The progression is straightforward. What-if analysis changes one lever. Scenario analysis changes a connected group of assumptions. A tornado chart ranks the variables that move the result most. Monte Carlo simulation combines probability ranges to show a distribution of possible outcomes.
Most founder decisions only need the first two. Advanced methods earn their place when the investment is large, the variables interact, and a single base case would create false confidence.
The Main Methods Explained Without the Jargon
Sensitivity analysis becomes practical when you match the method to the question. Start with the simplest tool that can answer the decision accurately.
What-if analysis
Think of a thermostat. You adjust one setting and observe the room. In a model, you might change the selling price while leaving volume, costs and payment timing unchanged. Then you restore the original price and flex volume, debtor days or stock turn separately.
This is the clearest way to answer, “Which single input hurts cash or profit most if it moves?” It works well for a pricing review, a supplier-term negotiation or an overdue-receivables problem. The limitation is equally clear. It doesn't show what happens when several assumptions deteriorate together.
Scenario analysis
A scenario is a complete story, not an isolated adjustment. Build a base case, a favourable case and a downside case, then change the assumptions that belong together. A weak-demand scenario might combine lower volume, slower collections and a higher stock holding. A growth scenario might include more sales, additional hiring and earlier inventory purchases.
Read the closing bank balance in each story, not only the profit result. A business can produce an attractive annual profit and still need funding during the months when cash leaves before receipts arrive.
For a fuller explanation of the distinction between the two approaches, scenario vs sensitivity analysis explained is a useful reference. Founders often use the terms interchangeably, but the management questions are different.
Tornado charts
A tornado chart ranks inputs by their effect on a selected output. Each bar shows how far the result moves when one assumption changes across a defined range. The longest bar identifies the lever that deserves attention first.
It isn't a forecast and it doesn't prove that the largest bar will change. It tells you where the model is most exposed. If debtor days dominate price, the finance priority may be collection discipline rather than another pricing workshop.
The chart also prevents wasted effort. There's little value in refining a low-impact subscription cost while leaving stock turn or payment timing poorly measured.
Monte Carlo simulation
Monte Carlo simulation runs many combinations of inputs using defined probability ranges. Instead of showing one closing-cash number, it presents a range of outcomes and the likelihood of landing within that range.
That sophistication can help with a warehouse lease, a major product launch, a multi-site rollout or a large capital commitment. It isn't automatically better for a weekly trading decision. If the underlying ranges are guesses, thousands of simulations only produce a highly polished guess.
For the basic break-even relationship between volume, price, fixed costs and margin, founders can also use break-even point analysis before building a more complex model.
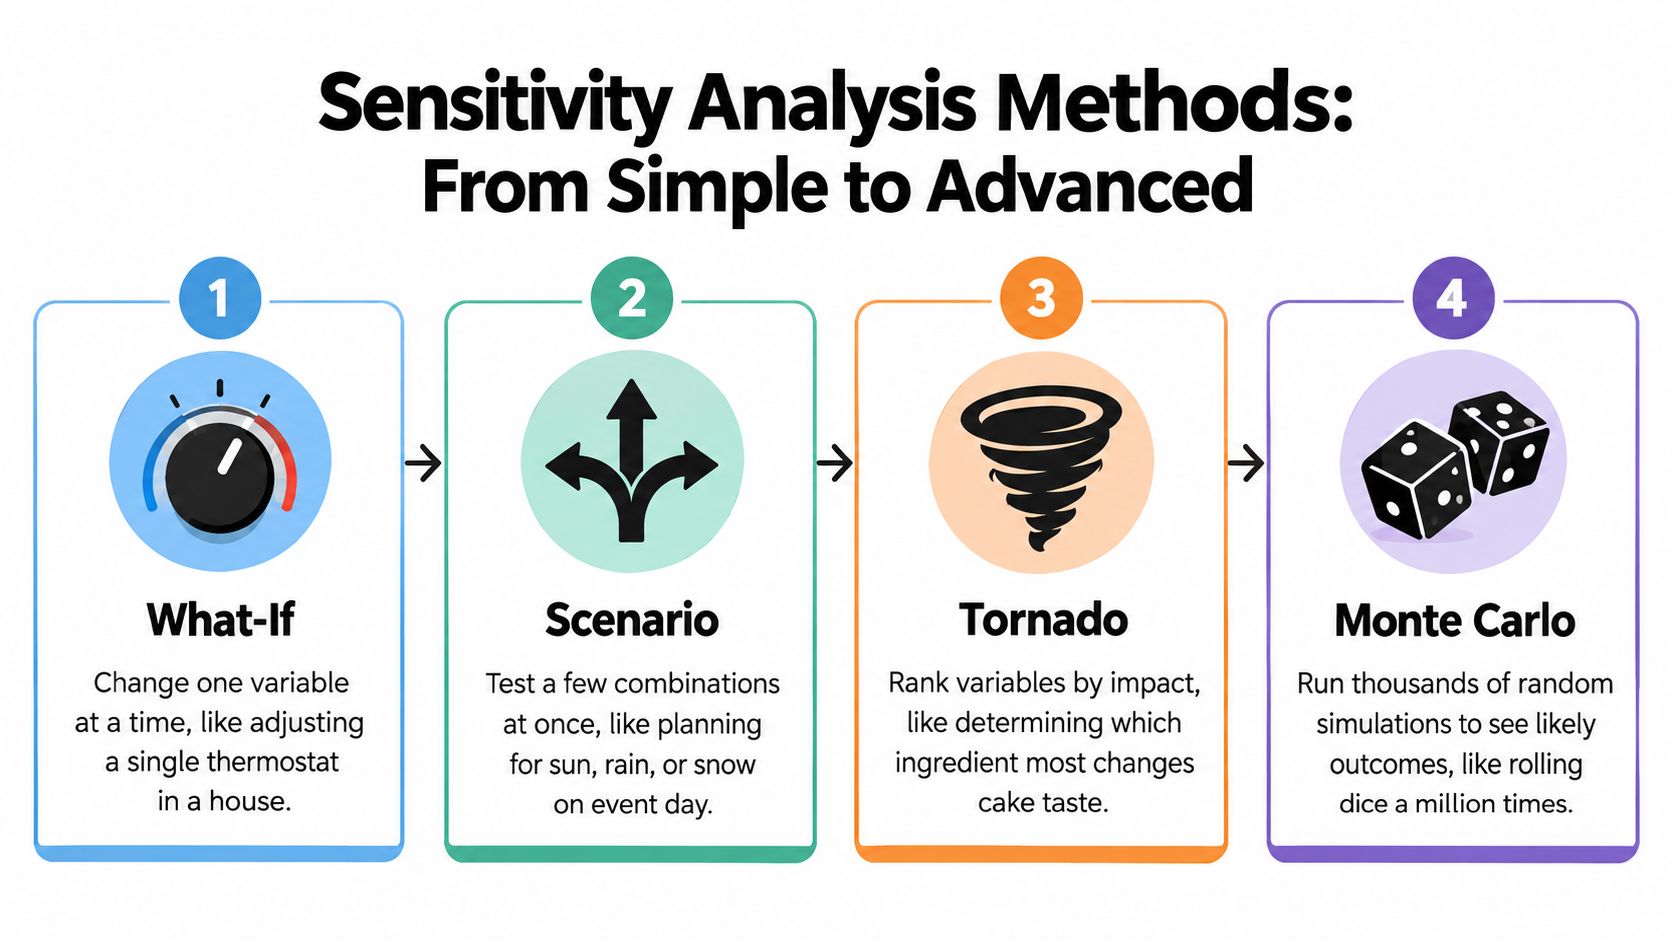
A visual comparison helps teams explain why they aren't jumping straight to advanced simulation. The method should reflect the decision, the quality of the inputs and the time available to act.
Building Your First Sensitivity Model in Excel
You don't need a complex workbook to find the first important cash lever. A linked monthly forecast and a one-way data table can expose more risk than an elaborate model filled with assumptions no one reviews.
Set up the model
Put the assumptions in one clearly labelled block at the top of the sheet:
Selling price
Units sold
Cost of goods sold
Debtor days
Creditor days
Opening cash
Build the monthly cash-flow projection below it. Include receipts, supplier payments, operating expenses, tax or other known cash movements, then calculate month-end cash. Keep profit and cash as separate outputs. They answer different questions.
Your model should link every formula to the assumptions block. Don't type a price directly into a sales formula and then change the assumption cell later. That creates a workbook that looks responsive but isn't.
Create a one-way data table
Choose one driver, such as price. Place alternative prices in a vertical range to the side of the model. At the top of that range, link to the output cell containing month-end cash. The data table's column input must point to the single price assumption cell in the assumptions block.
In Excel, select the table range and use Data > What-If Analysis > Data Table. Set the column input cell to the price assumption. The same process works for volume, debtor days or stock turn. A sensible starting range is plus or minus 15% for price and plus or minus 20% for volume, but those are modelling choices, not forecasts.
Add the compounding view
After the one-way table works, build a two-way table with price across the columns and debtor days down the rows. Use month-end cash as the output. This reveals combinations that a one-variable test misses, such as a price increase that looks attractive until customers pay later.
The financial forecasting template can help structure the underlying projection before you add sensitivity tables. Keep the workbook readable, label every assumption, and compare actual results against the forecast regularly.
Common build errors include hard-coding values, flexing the wrong cell, linking the output to profit instead of cash, and changing several assumptions in a table intended to be one-way. Test the model with an obvious input change first. If the output barely moves when it should, stop and repair the links before trusting the results.
Choosing the Right Method for Each Decision
The right method depends on the question, not on the sophistication of the spreadsheet. A founder deciding whether to change payment terms doesn't need a probabilistic model if the uncertainty centres on collection timing. A founder committing to a new site may need a broader view because demand, staffing, fit-out and working capital can shift together.
Decision Type | Confidence in Base Case | Recommended Method | Typical Use |
|---|---|---|---|
One uncertain driver | High | One-way sensitivity | Price, volume or debtor-day review |
Several linked changes | Moderate | Scenario analysis | Budget, hiring or stock-build decision |
Many competing drivers | Moderate | Tornado chart | Prioritising forecast work and management attention |
Large investment with uncertain ranges | Low | Monte Carlo simulation | Warehouse, launch or multi-site rollout |
Use one-way analysis for a focused question
A one-way table is fast and easy to explain. Ask, “If debtor days worsen, when does cash become uncomfortable?” or “How much volume can we lose before contribution no longer covers the required outgoings?” This method is especially useful when management can act directly on the selected driver.
Use scenarios when the business moves as a system
Scenario analysis suits decisions where inputs are connected. A demand slowdown may affect volume, discounting, collections and inventory at the same time. A growth plan may require earlier stock purchases, additional staff and longer customer payment cycles. Putting those movements into a coherent story is more realistic than flexing each input in isolation.
Reserve Monte Carlo for decisions that justify it
Monte Carlo can show a realistic range rather than a single outcome, but it needs defensible input distributions and careful interpretation. If the base case is weak, the simulation won't rescue it. Complexity should earn its keep through a better decision, not through a more impressive workbook.
SME Stories That Put Sensitivity Analysis to Work
The most useful models often produce an uncomfortable answer. They show that the founder has been managing the most visible problem rather than the most financially important one.
Pricing isn't always the first lever
A Melbourne skincare brand considered a $4 price rise. The model showed that margin improved by 11 points, but only while volume stayed within a 7% drop. A steeper volume decline removed the benefit.
The owner didn't implement the price rise immediately. The team tested bundles instead, protecting the cash contribution without relying on customers accepting the higher standalone price. The lesson wasn't that price increases are wrong. It was that price must be tested against volume, not treated as an independent win.
Inventory can outweigh unit margin
A Brisbane industrial parts distributor expected unit margin to dominate the cash result. A tornado chart told a different story. Stock turn was the stronger lever because slow-moving products absorbed cash long after the purchase had been paid for.
The distributor reduced slow-moving stock-keeping units and released $180,000 in working capital within a quarter. That result came from changing the inventory profile, not from pushing another price adjustment. For inventory-led businesses, the cash question is often, “How quickly does this product become a receipt?” rather than, “What margin does it show on paper?”
Receivables can create a funding gap before profit changes
A Perth consulting firm modelled debtor days and found that moving from 42 to 55 days would create a $90,000 cash shortfall before the next invoice run. Profit didn't change because the invoices were still recognised. The bank balance did.
The founder tightened payment terms for new contracts and added a 30% deposit clause. Those changes improved the timing of receipts without requiring a broad price change or a reduction in delivery capacity.
The first modelled lever is often the one the founder has been watching. The dominant cash lever is often somewhere else.
These examples point to a practical sequence. Test price against volume, inventory against stock turn, and revenue against collection timing. Then decide whether the proposed action reduces risk or merely moves it from one line of the model to another.
Mistakes That Lead Owners to Misread Their Numbers
Sensitivity analysis can create clarity, but only if the owner interprets the output correctly. A chart doesn't remove judgement. It focuses judgement on the assumptions that matter.
A ranking isn't a forecast
A tornado chart ranks variables by impact. It doesn't predict that every variable will move, nor does it tell you which outcome is most likely. Treating the longest bar as a forecast confuses exposure with probability.
The correct question is, “Which assumption deserves better information or a management response?” If stock turn ranks first, investigate purchasing, clearance and replenishment. Don't copy the downside number into the budget.
Independent tests can hide connected risks
One-way analysis normally changes one input while holding others constant. That makes the result easy to read, but price and volume may move together. A downturn can bring lower volume, more discounting, slower collections and excess stock at the same time.
If the model tests each independently, it can misrepresent the combined downside. Use scenarios for connected movements, and document the relationship rather than pretending the variables are unrelated.
An optimistic base case distorts every comparison
A base case built from the last ambitious plan makes ordinary outcomes look like failure. Start with actual trading history, current commitments and realistic operating capacity. Reconcile the forecast against actual results and adjust the assumptions when the business repeatedly misses them.
A wide range isn't false precision
A simulation that produces a broad cash range is telling you that the model lacks certainty. Narrowing the output by forcing tighter assumptions doesn't improve the analysis. Improve the source data, clarify the relationships or accept that the decision carries meaningful risk.
Testing irrelevant inputs wastes the modelling hour
Owners often start with whatever assumption is easiest to edit. That may be a small overhead, a minor software cost or a line that has little connection to cash. Rank the likely drivers before opening Excel. Begin with price, volume, debtor days, stock turn, gross margin and supplier terms, then add other variables only when the business logic supports them.
Australian guidance also recognises that changing one variable at a time is limited. The Australian Transport Assessment and Planning guidance on risk and uncertainty points towards scenario, probability-based analysis and stress testing when uncertainty is more complex.
Turning Sensitivity Outputs Into a 90-Day Cash-Flow Plan
A model becomes useful when it changes the weekly conversation. Take the two or three inputs that move closing cash most and turn each into an owned KPI with a threshold and a response.
A rolling 13-week cash forecast gives the team a short operating horizon. Use the downside view from your broader analysis as the conservative cash path, but don't present it as a guaranteed outcome. The forecast should show expected receipts, committed payments, discretionary spending and the resulting bank position week by week.
Put the outputs on one page
A dashboard shouldn't contain every model variable. It should contain the few that can trigger action:
Debtor days or overdue receivables
Stock turn and aged inventory
Gross margin by key product or service line
Supplier payment timing
Minimum cash buffer
Review the dashboard in a short weekly cash meeting. The founder, finance owner and the person responsible for the relevant operational lever should attend. Hold a broader monthly scenario review to compare actuals with the base and downside assumptions.
For example, if debtor days rise above 48 for two consecutive weeks, the founder can personally contact the three largest overdue accounts. The threshold is a management rule, not an industry benchmark. Set it from the cash runway and payment pattern of the individual business.
A practical cash forecast also needs clear ownership. Guidance on how to build one with Total Comp can help founders think through the forecast structure, but the operating discipline matters more than the file format.
Convert the model into a staged response
Input from Model | KPI | Threshold / Trigger | Owner | Time Horizon | Action |
|---|---|---|---|---|---|
Debtor days | Average collection time | Above agreed internal limit | Founder or credit owner | Weeks 1 to 4 | Call overdue customers, confirm payment dates and pause unapproved credit |
Stock turn | Aged inventory value | Slow-moving stock exceeds plan | Operations or purchasing lead | Weeks 1 to 4 | Stop replenishment, bundle, return or clear identified lines |
Gross margin | Margin by product or job | Below approved floor | Sales and finance | Weeks 5 to 8 | Review pricing, discounting, wastage and supplier costs |
Supplier terms | Payment timing | Key supplier shortens terms | Founder or procurement owner | Weeks 5 to 8 | Renegotiate terms, align purchasing with demand and protect critical supply |
Closing cash | Forecast bank balance | Falls below the minimum buffer | Founder and finance | Weeks 9 to 12 | Activate contingency funding, defer discretionary spend and revise the trading plan |
Keep the loop alive
During weeks one to four, focus on quick wins such as collections, purchasing holds and invoice accuracy. During weeks five to eight, address structural fixes, including contract terms, replenishment rules, pricing governance and approval workflows. During weeks nine to twelve, keep contingency moves ready, such as delaying non-essential commitments or arranging funding before the cash position becomes urgent.
A virtual CFO maintains version-controlled assumptions, compares the forecast with actuals each month and records why a driver changed. Nexist can support this kind of finance operating rhythm through forecasting, cash-flow management, performance reporting, KPIs and working-capital improvement. Founders can also use its guidance on how to improve cash flow to turn model findings into operating actions.
Sensitivity analysis shouldn't end with a chart in a workbook. Pick the cash drivers, assign owners, set triggers and review the result until the forecast reflects the business you run.
If your cash forecast still relies on untested assumptions, visit Nexist for practical support with sensitivity modelling, rolling cash forecasts, working capital and KPI ownership. The team can help you identify whether price, volume, debtor days, stock turn or margin is really driving the pressure, then turn that finding into a 90-day action plan.
sensitivity analysis, cash flow forecasting, Monte Carlo simulation, scenario planning, tornado chart

" width="24px"/><g d="M 0 24.129 L 0 0.129 L 24 0.129 L 24 24.129 Z M 0 24.129 L 0 0.129 L 24 0.129 L 24 24.129 Z M 24 3 C 24 1.344 22.656 0 21 0 L 3 0 C 1.344 0 0 1.344 0 3 L 0 21 C 0 22.656 1.344 24 3 24 L 21 24 C 22.656 24 24 22.656 24 21 Z M 6.883 8.375 L 2.863 8.375 L 2.863 20.467 L 6.883 20.467 Z M 4.899 2.545 C 3.524 2.545 2.625 3.449 2.625 4.634 C 2.625 5.795 3.496 6.724 4.846 6.724 L 4.872 6.724 C 6.273 6.724 7.146 5.795 7.146 4.634 C 7.12 3.449 6.274 2.545 4.899 2.545 Z M 16.747 8.09 C 14.614 8.09 13.659 9.263 13.124 10.086 L 13.124 8.374 L 9.105 8.374 C 9.159 9.508 9.105 20.466 9.105 20.466 L 13.124 20.466 L 13.124 13.713 C 13.124 13.352 13.15 12.99 13.257 12.732 C 13.547 12.01 14.209 11.262 15.319 11.262 C 16.773 11.262 17.355 12.372 17.355 13.996 L 17.355 20.466 L 21.374 20.466 L 21.374 13.532 C 21.374 9.818 19.391 8.09 16.747 8.09 Z" fill="transparent" height="24.12890599668026px" id="dSFdkJotL" width="24px"><path d="M 0 24 L 0 0 L 24 0 L 24 24 Z" fill="transparent" height="24px" id="wscNJE44G" transform="translate(0 0.129)" width="24px"/><g d="M 0 24.129 L 0 0.129 L 24 0.129 L 24 24.129 Z M 24 3 C 24 1.344 22.656 0 21 0 L 3 0 C 1.344 0 0 1.344 0 3 L 0 21 C 0 22.656 1.344 24 3 24 L 21 24 C 22.656 24 24 22.656 24 21 Z M 6.883 8.375 L 2.863 8.375 L 2.863 20.467 L 6.883 20.467 Z M 4.899 2.545 C 3.524 2.545 2.625 3.449 2.625 4.634 C 2.625 5.795 3.496 6.724 4.846 6.724 L 4.872 6.724 C 6.273 6.724 7.146 5.795 7.146 4.634 C 7.12 3.449 6.274 2.545 4.899 2.545 Z M 16.747 8.09 C 14.614 8.09 13.659 9.263 13.124 10.086 L 13.124 8.374 L 9.105 8.374 C 9.159 9.508 9.105 20.466 9.105 20.466 L 13.124 20.466 L 13.124 13.713 C 13.124 13.352 13.15 12.99 13.257 12.732 C 13.547 12.01 14.209 11.262 15.319 11.262 C 16.773 11.262 17.355 12.372 17.355 13.996 L 17.355 20.466 L 21.374 20.466 L 21.374 13.532 C 21.374 9.818 19.391 8.09 16.747 8.09 Z" fill="transparent" height="24.12890599668026px" id="sTpjGo1tb" width="24px"><path d="M 0 24 L 0 0 L 24 0 L 24 24 Z" fill="transparent" height="24px" id="s7ffpmKOD" transform="translate(0 0.129)" width="24px"/><g d="M 24 3 C 24 1.344 22.656 0 21 0 L 3 0 C 1.344 0 0 1.344 0 3 L 0 21 C 0 22.656 1.344 24 3 24 L 21 24 C 22.656 24 24 22.656 24 21 Z M 6.883 8.375 L 2.863 8.375 L 2.863 20.467 L 6.883 20.467 Z M 4.899 2.545 C 3.524 2.545 2.625 3.449 2.625 4.634 C 2.625 5.795 3.496 6.724 4.846 6.724 L 4.872 6.724 C 6.273 6.724 7.146 5.795 7.146 4.634 C 7.12 3.449 6.274 2.545 4.899 2.545 Z M 16.747 8.09 C 14.614 8.09 13.659 9.263 13.124 10.086 L 13.124 8.374 L 9.105 8.374 C 9.159 9.508 9.105 20.466 9.105 20.466 L 13.124 20.466 L 13.124 13.713 C 13.124 13.352 13.15 12.99 13.257 12.732 C 13.547 12.01 14.209 11.262 15.319 11.262 C 16.773 11.262 17.355 12.372 17.355 13.996 L 17.355 20.466 L 21.374 20.466 L 21.374 13.532 C 21.374 9.818 19.391 8.09 16.747 8.09 Z" fill="transparent" height="24.000006px" id="D0ecaHEcW" transform="translate(0 0)" width="24px"><path d="M 24 3 C 24 1.344 22.656 0 21 0 L 3 0 C 1.344 0 0 1.344 0 3 L 0 21 C 0 22.656 1.344 24 3 24 L 21 24 C 22.656 24 24 22.656 24 21 Z" fill="rgb(55, 184, 218)" height="24.000006px" id="IPLFE6zXx" width="24px"/><path d="M 4.02 0 L 0 0 L 0 12.092 L 4.02 12.092 Z" fill="rgb(255, 255, 255)" height="12.09201px" id="FWhtzAyuY" transform="translate(2.863 8.375)" width="4.02px"/><path d="M 2.274 0 C 0.899 0 0 0.904 0 2.089 C 0 3.25 0.871 4.179 2.221 4.179 L 2.247 4.179 C 3.648 4.179 4.521 3.25 4.521 2.089 C 4.495 0.904 3.649 0 2.274 0 Z" fill="rgb(255, 255, 255)" height="4.17876px" id="VmOsKv4kO" transform="translate(2.625 2.545)" width="4.52095px"/><path d="M 7.641 0 C 5.509 0 4.554 1.173 4.019 1.996 L 4.019 0.284 L 0 0.284 C 0.053 1.419 0 12.376 0 12.376 L 4.019 12.376 L 4.019 5.623 C 4.019 5.262 4.045 4.9 4.151 4.642 C 4.442 3.92 5.103 3.172 6.214 3.172 C 7.667 3.172 8.25 4.282 8.25 5.907 L 8.25 12.376 L 12.269 12.376 L 12.269 5.442 C 12.269 1.728 10.286 0 7.641 0 Z" fill="rgb(255, 255, 255)" height="12.37626px" id="n1XUbhaq0" transform="translate(9.105 8.09)" width="12.268830000000001px"/></g></g></g></g></svg>)