Financial Forecasting Template: Guide for Australian SMEs
Create a financial forecasting template for Australian SMEs with step-by-step setup, driver modelling, and scenario testing.
Ansh Malhotra

You built the spreadsheet when the year felt calm. Now the BAS is due, payroll has hit, GST is sitting in the account, and the number on the screen says you're fine right up until the transfer clears and the bank balance tells the truth. That's the moment most founders realise their forecast wasn't broken because the maths was hard, it was broken because it never spoke the language of an Australian business.
A financial forecasting template should not be a decorative annual budget. It should be the operating system that forces decisions early, before cash tightens, before hiring becomes a mistake, and before supplier terms need a rescue plan. For Australian SMEs, that means wiring the template to BAS timing, GST, payroll withholding, super, debt service, and the RBA cash rate, then reviewing it on a rolling basis instead of filing it away after one board meeting.
Table of Contents
Why Most Forecasting Templates Fail Australian Founders
The usual failure starts with a founder who downloads a clean-looking spreadsheet, fills in sales once, and never touches it again. On paper, the business looks profitable. In the bank account, the timing is wrong, and that's what hurts. A template that ignores collections, payables, GST, and payroll timing will always flatter profit more than it tells the truth about cash.
Profit is not cash, and Australia makes that gap wider
Generic overseas templates are built for a different reporting rhythm. In Australia, the ATO's quarterly BAS cycle creates four obvious checkpoints a year, with standard due dates for self-preparers on 28 October, 28 February, 28 April and 28 July. That schedule makes forecasting a compliance-support tool as much as a management tool, because the business has to line up revenue, GST, payroll withholding, and supplier payments against the same clock rather than pretending finance only matters at year-end (Salesforce's template guidance).
A founder doesn't need a forecast that pretends to predict the future perfectly. They need one that surfaces decisions early. If the model shows a cash squeeze in eight weeks, you can change prices, pause hiring, renegotiate supplier terms, or restructure debt before the bank account forces the conversation.
Practical rule: if your template doesn't tell you when cash gets tight, it's a report, not a forecast.
What this template has to do
A suitable template functions as an operating system for the business. It tracks the moving parts that drive decisions, then rolls forward after each BAS cycle so forecasted inflows and outflows can be compared with real trading results. That approach matters even more in a market where SMEs dominate the business environment and external stakeholders want clean, timely numbers.
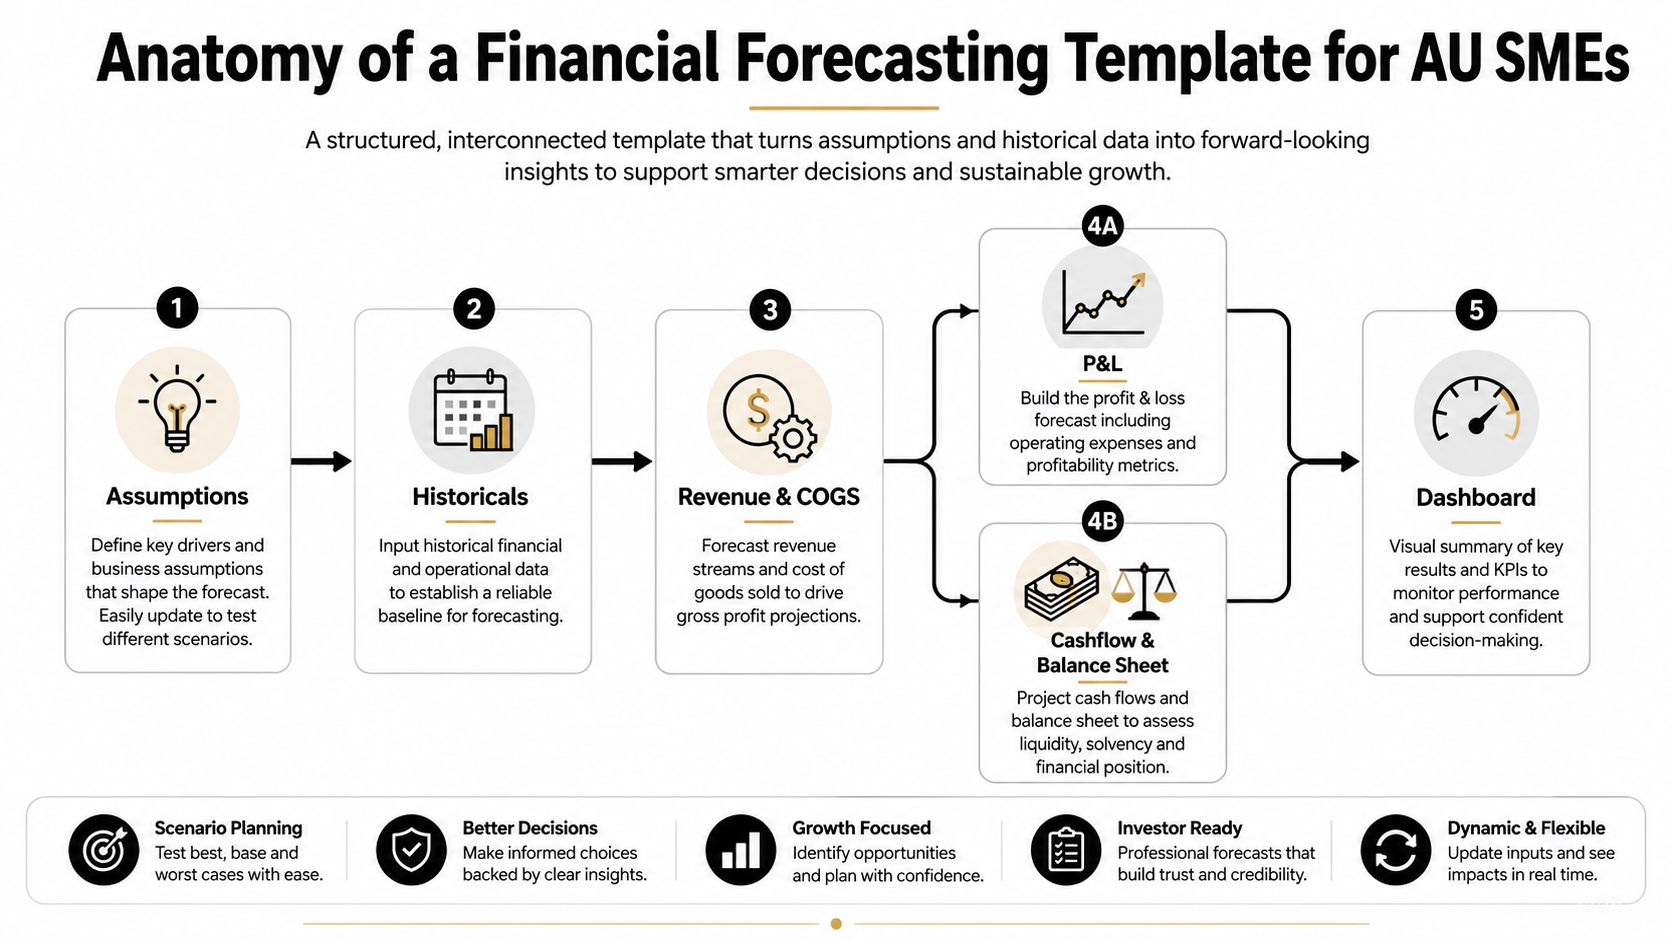
A practical build should include seven working parts, not a pile of random tabs. Keep the structure tight, then force each sheet to earn its place.
Assumptions tab, for driver inputs only.
Historicals tab, for cleaned monthly or quarterly actuals.
Revenue and COGS tab, for the operating engine.
P&L tab, for profit timing.
Cashflow and Balance Sheet tab, for working capital and liquidity.
Dashboard tab, for the few numbers that drive action.
Change log tab, so every update is traceable.
The founders who win with forecasting don't admire the spreadsheet. They use it to make faster decisions.
Anatomy of a Financial Forecasting Template Built for AU SMEs
A strong financial forecasting template is boring in the right way. The structure should be obvious, the inputs should be controlled, and the formulas should be protected from casual edits. If you're rebuilding a generic template, delete anything that doesn't support a driver, a forecast, or a decision.
Build the workbook around inputs, history, outputs, and review
The five essential tabs are not optional. Assumptions holds the drivers, Historicals holds the clean base data, Revenue and COGS turns operating activity into numbers, P&L translates those numbers into profit, and Cashflow and Balance Sheet turns accounting profit into liquidity. Dashboard sits on top and shows the owner what needs attention now.
That sequence matters because it stops people from typing into formula cells and calling it modelling. Input cells should be in one colour, formulas in another, and named ranges should do the heavy lifting so the file doesn't become a maze of hard-coded references. A change-log tab is not bureaucracy, it's discipline. It tells you what changed, when it changed, and why.
Match the file structure to Australian reporting reality
The model should hug the Australian reporting rhythm. That means a 13-week cashflow view alongside a 12-month operating plan, not one or the other. The 13-week view is where founders see near-term pressure, while the 12-month view catches seasonality, staffing moves, and tax timing before they become surprises.
A lot of generic templates overbuild the wrong parts. They spend too much time on decorative charts, macro-enabled tricks, or long-range assumptions no owner will revisit. Cut that out. Keep the workbook simple enough that a founder, bookkeeper, or virtual CFO can update it quickly after each BAS cycle, then trust the output enough to act on it.
If you want a clean model layout reference, Nexist's own approach to a revenue forecasting structure puts the assumptions tab first for a reason, because every other sheet should flow from those inputs, not compete with them.
The shortest path to a useful model is usually the one with the fewest tabs and the strictest rules. Build the backbone first, then add detail only where it changes a decision.
Driver-Based Revenue and COGS Modelling
Revenue forecasting fails when founders start with a number they want to hit. The better method is blunt: forecast the activity first, then let the maths do the rest. That means units, customers, conversion rate, repeat rate, and average selling price come before top-line revenue.
Start with the operating drivers, not the target
For an AU ecommerce or wholesale business, a simple driver model is far more useful than a straight-line trend. If the business takes 1,200 monthly orders, converts at 2.8%, has an $84 average order value, and sees an 18% repeat rate, the forecast becomes a set of linked assumptions instead of a wish list. If pricing rises by $3, the gross profit changes. If conversion drops, the model shows the hit immediately. That is the point.
Revenue models should answer one question, what changed operationally?
Once that's wired in, the forecast becomes easy to pressure test. A small change in price, traffic, or repeat buying shows up across revenue and gross profit because the model is tied to real behaviour, not spreadsheet optimism. For inventory-heavy businesses, that discipline is critical because stock decisions, not just sales, drive margin outcomes.
Model COGS like a function of units and stock
COGS should not be a blunt percentage of revenue if the business carries inventory. Model landed cost per unit, freight, packaging, payment fees, wastage, and stock write-downs. Then tie those costs back to opening stock, purchases, and units sold so gross margin reflects what happened in the warehouse.
That's where founders often over-engineer the wrong thing. They model tiny expense lines in painful detail, then leave revenue as a single guessed number. Reverse that. Put your energy into the drivers that move cash and gross margin, then keep immaterial lines simple.
For businesses that need sharper inventory logic, the practical view in how to forecast inventory is useful because it links stock planning to margin protection instead of treating inventory as a separate admin exercise.
Driver | Conservative | Typical AU SME | Aggressive |
|---|---|---|---|
Orders or units | Lower-than-run-rate | Recent run-rate | Stretch growth |
Conversion or sell-through | Below recent average | Recent average | Strong uplift |
Average selling price | Discounted | Current price | Price increase assumed |
Repeat rate | Softens | Stable | Improves |
Freight and fulfilment | Higher | Current cost base | Efficient routing |
Wastage or write-downs | Higher | Normal allowance | Minimal allowance |
A template that behaves like this stops being a static forecast and becomes a driver model. That's what you want, because driver models are easier to explain, easier to update, and much harder to fool.
From Profit to Cashflow, Working Capital and BAS Timing
Accrual profit can look healthy while the bank balance is already under pressure. The conversion from profit to cash is where most template builders get lazy, and it's also where Australian businesses feel the pain first because GST, payroll, super, and supplier terms all move at different speeds.
Turn timing into a model, not an afterthought
If a business books $220,000 monthly revenue and customers pay in 42 days, about $308,000 is tied up in receivables. If suppliers are paid in 21 days, cash leaves before it comes back, and the gap is the working-capital drag. That's not a theory problem, it's a timing problem.
Your cashflow tab should show collections, payments, payroll, tax, and super on the weeks they happen. Then overlay the ATO rhythm, because BAS doesn't care that sales were strong last month if the liability falls due now. This is also why lenders and investors pay closer attention to a three-way view than a profit-only sheet, and it's the same logic Nexist uses in a three-way forecast review.
Practical rule: if cash timing isn't visible weekly, the model is too slow for real decisions.
Use a 13-week view as the owner's control panel
A 13-week cashflow is short enough to be actionable and long enough to catch trouble early. Build it week by week, not by month, and show opening cash, collections, payroll, BAS, supplier outflows, debt payments, and closing cash. The monthly P&L can sit above it, but it should never replace it.
Here's the timing logic that belongs in the model.
Driver | Conservative | Typical AU SME | Aggressive |
|---|---|---|---|
Debtor days | Slower collection | Normal collection | Fast collection |
Creditor days | Faster payment | Normal supplier terms | Extended terms |
Stock turn | Slower turnover | Planned turnover | Faster turnover |
GST timing | Tight cash buffer | Normal BAS buffer | Minimal buffer |
Super timing | Caught in week planning | Scheduled monthly | Caught late |
A good working-capital model also helps owners avoid a common trap, carrying stock or debt as if it were static. It isn't. Cash leaks through timing, and timing is what the template should expose.
If you're using a cashflow model properly, you'll know exactly when to pull levers like payment terms, collections follow-up, or inventory buying before the bank balance forces the issue.
Scenario Architecture and AU-Specific Stress Tests
One forecast is not enough. Build three versions of the same model, base, best, and worst, and keep the formulas identical across all three. Change only the input drivers. If the formulas shift between scenarios, you have three different models and comparison becomes close to meaningless.
Keep the scenarios on one driver framework
The base case should reflect current run-rate. The best and worst cases should only move conversion, price, headcount, collection days, supplier terms, or other real operating drivers. That keeps the model honest and makes it obvious which assumptions actually matter.
Australia-specific stress tests need their own treatment because public templates often miss the moving parts that hit local cash flow. The RBA cash rate target remained at 4.35% in the last 12 months according to the Smartsheet template overview, and rate changes flow straight into debt service. Payroll also moves quickly when wages rise, so Wage Price Index assumptions belong inside the scenario logic, not buried in a note.
Stress the business where it actually breaks
A sensible stress test does more than ask whether revenue rises or falls. It asks what happens if debt service gets more expensive, payroll grows, debtors stretch payment terms, or repeat orders soften. Those are the levers that move runway and covenant risk.
Scenario | Cash runway | Debt service | Gross margin | Debtor days |
|---|---|---|---|---|
Base case | Stable against plan | Current assumption | Current assumption | Current assumption |
Best case | Improves | Eases relative to base | Improves with mix and pricing | Shortens with stronger collections |
Worst case | Tightens quickly | Increases pressure | Compresses | Extends and traps cash |
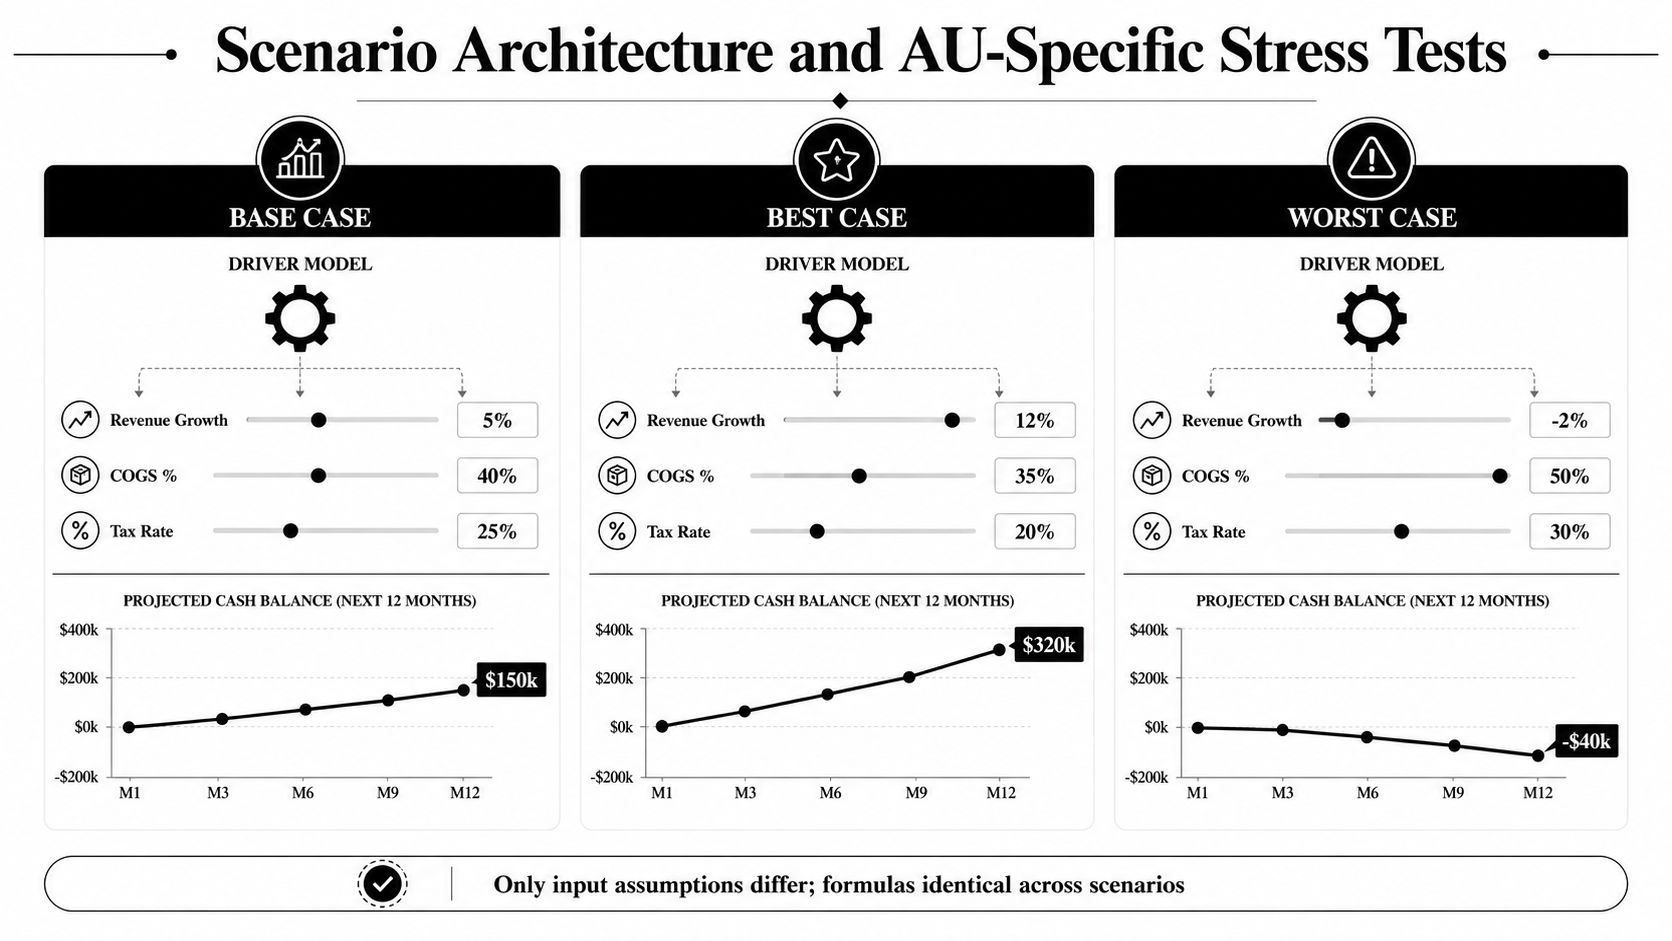
Treat the worst case as an operating plan, not a scare tactic. If the model shows a tighter cash position, the owner should know which actions come first, slower hiring, faster collections, lower inventory buys, or a pricing move. If it cannot answer that, it is not a useful stress test.
KPI Dashboards and Variance Reviews That Drive Action
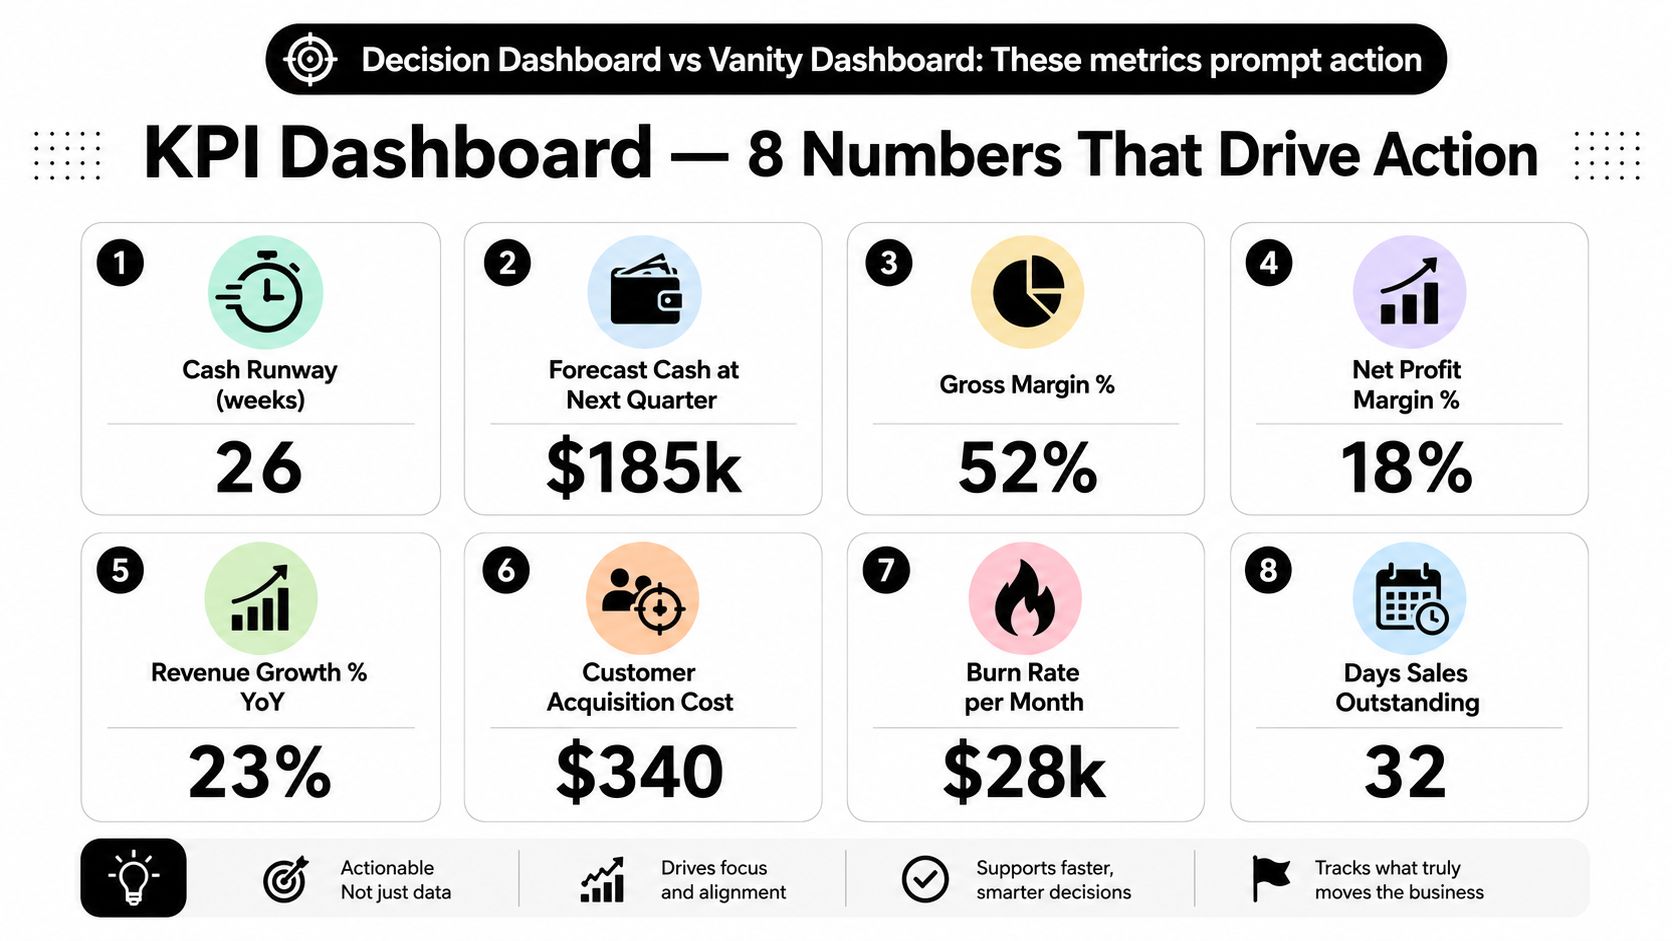
A dashboard should force decisions, not decorate the model. If the screen is full of pretty charts but no one knows what to do next, the dashboard is vanity. A decision dashboard is narrower, sharper, and tied directly back to the assumption tab.
Show the numbers that change behaviour
The eight numbers that deserve a single screen are cash runway, forecast cash at next BAS date, gross margin, debtor days, stock turn, current ratio, debt service coverage, and revenue per labour hour. Those are the numbers that tell an Australian owner whether the business is safe, stretched, or drifting. Anything else can live deeper in the workbook.
Use variance reviews to force the next decision
Monthly variance review is where forecasting stops being theatre. Compare forecast-to-actuals on the same drivers, not just the headline profit number, and flag anything meaningfully off plan. If collections slip, stock turns slower, or labour hours rise without revenue following, the action note should be specific. Someone owns the fix, and the template should say who.
A clean review rhythm is simple. Check the dashboard first, scan the variance list next, then log one decision. That routine takes minutes, not hours, and it stops the forecast from becoming a forgotten file.
For owners who want a sharper profit lens, Nexist's profitability analysis sits naturally beside the dashboard because margin questions should be answered from the same driver set, not from a separate spreadsheet.
Monday routine: five minutes on the dashboard, fifteen minutes on the variance list, one decision logged.
That's enough if the model is built properly. The dashboard should not create more work. It should tell you where to act, then get out of the way.
Common Pitfalls, Fixes and Your 30-Day Rollout Plan
The worst forecasting mistakes are predictable. Founders model too much detail in the wrong places, assume growth will be linear, ignore GST and super timing, and then leave the template untouched until quarter end. That's not forecasting. That's document storage.
Fix the mistakes before they become habits
The first mistake is over-detailing immaterial line items. The fix is to focus on the top cost drivers and the decisions they affect. The second is assuming a smooth growth line. The fix is to use monthly driver inputs, seasonality where it matters, and actuals to reset the model.
Ignoring GST and super timing is the third common failure, and it's an expensive one because the cash impact is real even when profit looks fine. The fix is to schedule those liabilities in the cashflow tab and review them after each BAS cycle. The fourth mistake is treating the forecast as static. The fix is to refresh it monthly and compare actuals against the same drivers.
Roll it out in four clean weeks
Week one: clean historicals, lock the chart of accounts, and build the assumptions tab.
Week two: model revenue, COGS, and the key operating drivers.
Week three: add the 13-week cashflow, BAS overlay, and working-capital timing.
Week four: run base, best, and worst cases, then wire the dashboard and variance review.
The right mindset is simple. The template belongs to the founder or the virtual CFO, and it gets updated after every BAS cycle, not once a year.
If you want help building this properly, book a 30-minute Business Scorecard with Nexist. We map the cash leaks, test the drivers, and turn the forecast into a working operating system you can use.
Nexist helps Australian founders build forecasting systems that tie cash, margin, BAS timing, and debt into one operating view. If you want a template that fits the way your business trades, visit Nexist and ask for a guided build that turns the model into a decision tool, not another spreadsheet.
financial forecasting template, SME cashflow, driver-based forecasting, scenario planning, AU BAS rhythm

" width="24px"/><g d="M 0 24.129 L 0 0.129 L 24 0.129 L 24 24.129 Z M 0 24.129 L 0 0.129 L 24 0.129 L 24 24.129 Z M 24 3 C 24 1.344 22.656 0 21 0 L 3 0 C 1.344 0 0 1.344 0 3 L 0 21 C 0 22.656 1.344 24 3 24 L 21 24 C 22.656 24 24 22.656 24 21 Z M 6.883 8.375 L 2.863 8.375 L 2.863 20.467 L 6.883 20.467 Z M 4.899 2.545 C 3.524 2.545 2.625 3.449 2.625 4.634 C 2.625 5.795 3.496 6.724 4.846 6.724 L 4.872 6.724 C 6.273 6.724 7.146 5.795 7.146 4.634 C 7.12 3.449 6.274 2.545 4.899 2.545 Z M 16.747 8.09 C 14.614 8.09 13.659 9.263 13.124 10.086 L 13.124 8.374 L 9.105 8.374 C 9.159 9.508 9.105 20.466 9.105 20.466 L 13.124 20.466 L 13.124 13.713 C 13.124 13.352 13.15 12.99 13.257 12.732 C 13.547 12.01 14.209 11.262 15.319 11.262 C 16.773 11.262 17.355 12.372 17.355 13.996 L 17.355 20.466 L 21.374 20.466 L 21.374 13.532 C 21.374 9.818 19.391 8.09 16.747 8.09 Z" fill="transparent" height="24.12890599668026px" id="dSFdkJotL" width="24px"><path d="M 0 24 L 0 0 L 24 0 L 24 24 Z" fill="transparent" height="24px" id="wscNJE44G" transform="translate(0 0.129)" width="24px"/><g d="M 0 24.129 L 0 0.129 L 24 0.129 L 24 24.129 Z M 24 3 C 24 1.344 22.656 0 21 0 L 3 0 C 1.344 0 0 1.344 0 3 L 0 21 C 0 22.656 1.344 24 3 24 L 21 24 C 22.656 24 24 22.656 24 21 Z M 6.883 8.375 L 2.863 8.375 L 2.863 20.467 L 6.883 20.467 Z M 4.899 2.545 C 3.524 2.545 2.625 3.449 2.625 4.634 C 2.625 5.795 3.496 6.724 4.846 6.724 L 4.872 6.724 C 6.273 6.724 7.146 5.795 7.146 4.634 C 7.12 3.449 6.274 2.545 4.899 2.545 Z M 16.747 8.09 C 14.614 8.09 13.659 9.263 13.124 10.086 L 13.124 8.374 L 9.105 8.374 C 9.159 9.508 9.105 20.466 9.105 20.466 L 13.124 20.466 L 13.124 13.713 C 13.124 13.352 13.15 12.99 13.257 12.732 C 13.547 12.01 14.209 11.262 15.319 11.262 C 16.773 11.262 17.355 12.372 17.355 13.996 L 17.355 20.466 L 21.374 20.466 L 21.374 13.532 C 21.374 9.818 19.391 8.09 16.747 8.09 Z" fill="transparent" height="24.12890599668026px" id="sTpjGo1tb" width="24px"><path d="M 0 24 L 0 0 L 24 0 L 24 24 Z" fill="transparent" height="24px" id="s7ffpmKOD" transform="translate(0 0.129)" width="24px"/><g d="M 24 3 C 24 1.344 22.656 0 21 0 L 3 0 C 1.344 0 0 1.344 0 3 L 0 21 C 0 22.656 1.344 24 3 24 L 21 24 C 22.656 24 24 22.656 24 21 Z M 6.883 8.375 L 2.863 8.375 L 2.863 20.467 L 6.883 20.467 Z M 4.899 2.545 C 3.524 2.545 2.625 3.449 2.625 4.634 C 2.625 5.795 3.496 6.724 4.846 6.724 L 4.872 6.724 C 6.273 6.724 7.146 5.795 7.146 4.634 C 7.12 3.449 6.274 2.545 4.899 2.545 Z M 16.747 8.09 C 14.614 8.09 13.659 9.263 13.124 10.086 L 13.124 8.374 L 9.105 8.374 C 9.159 9.508 9.105 20.466 9.105 20.466 L 13.124 20.466 L 13.124 13.713 C 13.124 13.352 13.15 12.99 13.257 12.732 C 13.547 12.01 14.209 11.262 15.319 11.262 C 16.773 11.262 17.355 12.372 17.355 13.996 L 17.355 20.466 L 21.374 20.466 L 21.374 13.532 C 21.374 9.818 19.391 8.09 16.747 8.09 Z" fill="transparent" height="24.000006px" id="D0ecaHEcW" transform="translate(0 0)" width="24px"><path d="M 24 3 C 24 1.344 22.656 0 21 0 L 3 0 C 1.344 0 0 1.344 0 3 L 0 21 C 0 22.656 1.344 24 3 24 L 21 24 C 22.656 24 24 22.656 24 21 Z" fill="rgb(55, 184, 218)" height="24.000006px" id="IPLFE6zXx" width="24px"/><path d="M 4.02 0 L 0 0 L 0 12.092 L 4.02 12.092 Z" fill="rgb(255, 255, 255)" height="12.09201px" id="FWhtzAyuY" transform="translate(2.863 8.375)" width="4.02px"/><path d="M 2.274 0 C 0.899 0 0 0.904 0 2.089 C 0 3.25 0.871 4.179 2.221 4.179 L 2.247 4.179 C 3.648 4.179 4.521 3.25 4.521 2.089 C 4.495 0.904 3.649 0 2.274 0 Z" fill="rgb(255, 255, 255)" height="4.17876px" id="VmOsKv4kO" transform="translate(2.625 2.545)" width="4.52095px"/><path d="M 7.641 0 C 5.509 0 4.554 1.173 4.019 1.996 L 4.019 0.284 L 0 0.284 C 0.053 1.419 0 12.376 0 12.376 L 4.019 12.376 L 4.019 5.623 C 4.019 5.262 4.045 4.9 4.151 4.642 C 4.442 3.92 5.103 3.172 6.214 3.172 C 7.667 3.172 8.25 4.282 8.25 5.907 L 8.25 12.376 L 12.269 12.376 L 12.269 5.442 C 12.269 1.728 10.286 0 7.641 0 Z" fill="rgb(255, 255, 255)" height="12.37626px" id="n1XUbhaq0" transform="translate(9.105 8.09)" width="12.268830000000001px"/></g></g></g></g></svg>)