
Management Reporting That Turns Numbers Into Cash Flow
Master management reporting for SMEs. Learn KPIs, cadences, dashboards and automation to turn numbers into cash flow and faster decisions.
Ansh Malhotra
You finish a long week, open the bank account and discover that the profit in your accounting file hasn't become available cash. Several customer invoices are overdue, stock is sitting on shelves, wages and supplier bills are due, and rising operating costs are narrowing your choices. The business looks busy, but the numbers aren't telling you what to do next.
That's the practical problem management reporting should solve. A useful report isn't a monthly dump of revenue, expenses and profit. It's a short-cycle system that connects cash, margin and activity to decisions, so you can see pressure early, protect working capital and spend less owner time assembling information.
Table of Contents
Why Management Reporting Matters More When Growth Slows
Growth can hide weak control. New sales may make the profit and loss statement look healthy while receivables take longer to arrive, stock absorbs cash and discounts reduce margin. By the time the monthly figures confirm the problem, the founder is already negotiating payment terms or delaying a purchase.
The broader Australian small-business environment makes this distinction important. CPA Australia reported that 46% of Australian small businesses reported growth in 2025, while 53% expected growth in 2026, below the survey average of 70%. These figures are reported in the CPA Australia Asia-Pacific Small Business Survey. MYOB also described Australian SME activity as slowing in Q1 2026 as businesses faced softer consumer spending, higher borrowing costs, and rising wages, insurance and utilities.
Compliance tells you what happened
Statutory and tax reporting has a legitimate purpose. It records historic transactions, supports compliance and gives stakeholders a consistent view of financial performance. But a compliance report usually answers, “What did the business report?” It doesn't necessarily answer, “Which customer should we chase today?” or “Can we afford to reorder this product?”
Management reporting answers those operational questions. It translates financial and non-financial information into a small set of actions:
Cash protection: Identify overdue receivables, upcoming payments and stock commitments before they create a funding squeeze.
Margin control: Separate revenue growth from profitable revenue, including the effect of discounts, freight, labour and supplier costs.
Activity visibility: Track orders, jobs, utilisation, returns, conversion or other operating signals that move before the financial statements.
Decision ownership: Assign an action, owner and due date to each material exception.
Practical rule: If a number doesn't change a decision, it probably doesn't belong on the front page of the pack.
Australian public administration provides a useful example of the discipline behind this approach. The Australian National Audit Office describes an ongoing cycle of planning, implementation and reporting, with planned performance published in Portfolio Budget Statements and actual results reported in annual reports. From 2009–10, all agencies were required to report under the Outcomes and Programs model, using KPIs to assess program effectiveness rather than listing inputs or outputs. The ANAO explanation of the Outcomes and Programs model shows why reporting works best as a cycle, not as an isolated monthly task.
For a founder, the equivalent cycle is simple: set a target, run the operation, review the result, investigate the movement and change the next decision. Good management reporting gives you an instrument panel for that cycle, rather than another document to file.
Understanding What Management Reporting Really Is
Think of your business as a vehicle. A roadworthy certificate confirms that the vehicle met a required standard at a point in time. The dashboard helps you drive it safely now. It shows speed, fuel, warning lights and direction, so you can respond before a small issue becomes a breakdown.
Management reporting is the dashboard. It's an internal view of performance designed for decisions, not a replacement for statutory accounts, tax returns or an audit file. The pack should combine financial results with the operational measures that explain why those results moved.

Build the reporting cycle in four steps
Start with the intended outcome. A target might relate to cash reserves, gross margin, delivery reliability, customer retention or the number of profitable jobs completed. The target gives each KPI a job.
Next, connect activity to the outcome. If cash is under pressure, relevant drivers may include receivables, stock purchases, supplier terms and payroll timing. If margin is weak, the drivers may include pricing, discounts, product mix, labour hours and rework.
Then report actual performance against the target. A useful pack shows the current result, the comparison point, the direction of travel and the reason for the variance. It shouldn't force the reader to search through multiple tabs to discover that a result changed.
Finally, decide and follow up. Every meaningful exception needs a response, such as contacting a customer, changing a reorder point, reviewing a price list or pausing a discretionary expense. The next reporting cycle checks whether the response worked.
Separate information from insight
A bank balance is information. A bank balance that will fall below the amount needed for wages and supplier payments is insight. Revenue is information. Revenue growing through low-margin work while labour capacity is full is insight.
That distinction is why founders often find the benefits of real time reporting useful when designing a faster review process. The value isn't constant screen-watching. It's receiving timely visibility and alerts that support a decision while the decision still matters.
The Australian framework also reinforces the difference between activity and effectiveness. KPIs should show whether a programme achieved its purpose, not merely whether resources were spent. For an SME, that means pairing an output such as jobs completed with a result such as contribution margin, customer payment behaviour or repeat demand.
A management pack normally includes:
A financial summary: Revenue, gross profit, operating expenses, net result and comparison with the chosen target.
A cash view: Current liquidity, expected inflows, committed outflows and working-capital exceptions.
An activity view: The few operational measures that explain financial movement.
Commentary: Plain-English explanations of material variances.
Actions: Decisions, owners and deadlines.
Leave detailed transaction listings, unchanged historical information and metrics with no decision attached in the supporting pages.
Core Components and KPIs Every SME Should Track
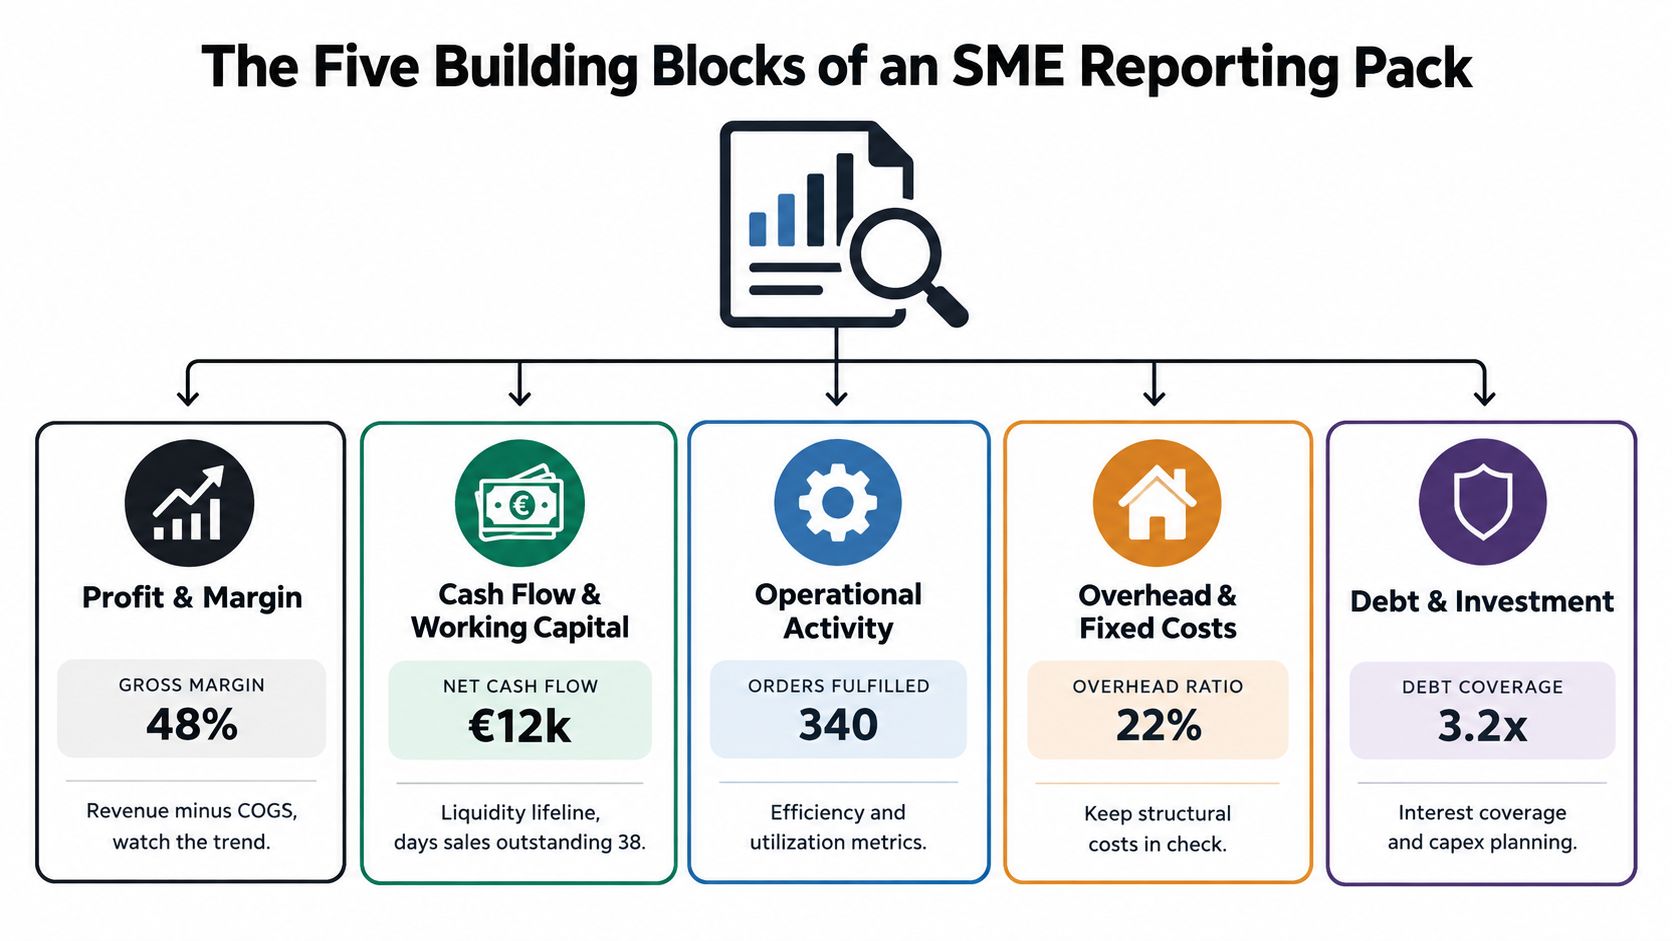
A small business doesn't need a wall of metrics. It needs a compact set that exposes the connection between activity, profit and cash. A practical pack usually contains five building blocks, then selects 5 to 10 core KPIs across them.
Start with the financial result, then look underneath
Profit and margin show whether sales are creating economic value. Track revenue, gross margin, contribution margin where relevant, and operating expenses. The trend matters more than a single result, particularly when suppliers, wages or utilities are rising.
Cash flow and working capital show whether the business can meet obligations. Watch receivables days, overdue invoices, stock turns, supplier payment timing and the expected cash position. Profit can remain stable while cash becomes trapped in unpaid sales or inventory.
Operational activity explains what the team is doing. Depending on the model, this could include orders fulfilled, jobs completed, billable hours, utilisation, returns, delivery delays or customer enquiries. Choose measures that the operating team can influence.
Overhead mix reveals structural pressure. Separate recurring fixed costs from variable costs and examine the mix of labour, rent, software, vehicles, insurance and other overheads. The question isn't whether every expense is bad. It's whether the cost base still fits current demand.
Forward outlook turns reporting into planning. Include a rolling cash forecast, committed purchases, expected sales, upcoming payroll and known funding requirements. The forecast should make uncertainty visible rather than presenting a false sense of precision.
Use peer context without outsourcing judgement
The Australian Taxation Office's small business benchmarks are built from tax-return data and published as industry ratio ranges. They include measures such as cost of sales to turnover, total expenses to turnover, labour to turnover, rent to turnover and motor vehicle expenses to turnover, as outlined in this guide to financial KPIs for small business.
Use those benchmarks as a prompt for questions, not as an automatic target. A difference may reflect geography, service quality, business maturity, product mix or accounting treatment. Your internal trend and cash outcome still carry the most weight.
A founder choosing KPIs can use this filter: does the measure lead the result, can someone influence it, and will a change trigger a decision?
KPI Category | Inventory-Heavy Business Focus | Service and Trade Business Focus |
|---|---|---|
Cash and working capital | Receivables days, stock turns, aged inventory, supplier payment timing | Receivables days, work in progress, unbilled work, supplier payment timing |
Margin | Gross margin by product, discount rate, freight leakage | Gross margin by job, labour recovery, rework, material mark-up |
Activity | Orders, fulfilment time, returns, stockouts | Jobs completed, utilisation, quote conversion, callbacks |
Cost base | Storage, freight, purchasing and labour mix | Wages, vehicles, subcontractors and software |
Outlook | Reorder commitments, demand and cash forecast | Pipeline, scheduled work, payroll and cash forecast |
Cash reporting should also stand on its own when funding is involved. A resource such as master cash flow for business loans can help founders think about liquidity, repayment obligations and the evidence lenders may expect.
How Often to Report and What Good Looks Like
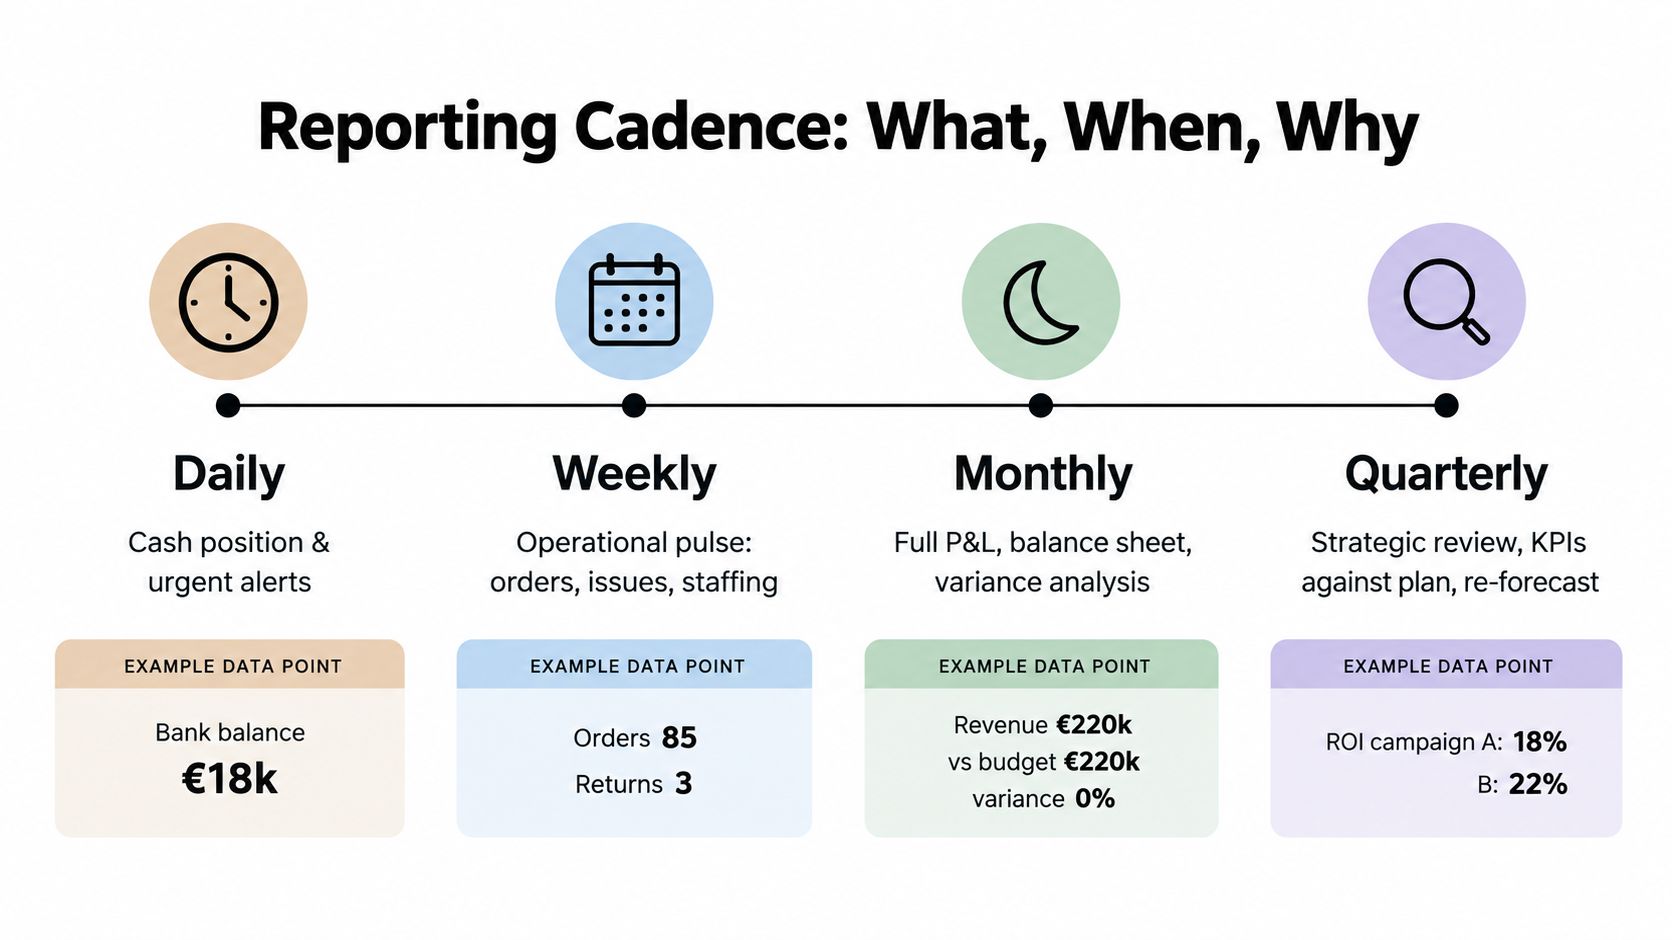
Monthly reporting is familiar, but familiarity doesn't make it suitable for every decision. A business with volatile cash, fast-moving stock or irregular customer payments may need daily alerts and weekly review, while a stable operation can reserve detailed analysis for the month-end pack.
The right cadence follows the speed of the risk. Use frequent reporting for measures that can cause immediate damage, and slower reporting for trends that need a broader view.
Match the rhythm to the decision
Cadence | What to review | Decision supported |
|---|---|---|
Daily | Bank position, urgent receipts, payment risks and critical exceptions | Can we meet immediate commitments, and who needs contact? |
Weekly | Sales activity, jobs, orders, returns, staffing and overdue accounts | What needs operational intervention this week? |
Monthly | Profit and loss, balance sheet, cash movement, variance and KPI trends | What changed, why did it change, and what should management alter? |
Quarterly | Strategy, targets, pricing, capacity, funding and reforecast | Does the plan still fit the business and its constraints? |
Daily doesn't mean manually preparing a complete pack. It can mean an automated bank feed and exception alert. Weekly doesn't mean rebuilding the accounts. It can mean reviewing a concise scorecard with the people who can act.
For quarterly review discipline, founders can use a structured quarterly business review framework to connect operational performance with strategic choices. The quarterly meeting should challenge assumptions, not repeat the monthly report.
Define what good looks like
Good reporting is fast enough, accurate enough and specific enough to support action. The pack should arrive at a predictable time, use consistent definitions and show the person responsible for each exception. It should distinguish actual results from estimates and make data gaps visible.
The Western Australian audit experience illustrates why speed and review controls matter. WA audit findings recorded 72% of State government entities as audit-ready within 20 days of year-end, while also identifying a need for stronger quality review processes, as reported in this financial KPI tracking discussion. The lesson for an SME isn't to copy a government timetable. It's to build a close process that produces information quickly without abandoning reconciliations and review.
WA agencies have also been required to include audited KPIs in annual reports for nearly two decades. A parliamentary review describes KPIs as an “accurate but succinct performance story”, with agencies reporting against approved programmes in budget papers and annual reports. That principle works for founders too. A short, trusted story beats a long spreadsheet that nobody uses.
Dashboard and Scorecard Examples That Drive Decisions
A dashboard should answer a management question, not display every available number. The strongest packs place a few related measures together, use clear status signals and end with an action. The reader should know what requires attention without interpreting a maze of charts.

Dashboard one answers whether cash is safe
A cash and working-capital page should show available cash, expected receipts, committed payments and the exceptions that could change the forecast. For an ecommerce or wholesale business, add receivables ageing, stock turns, purchase commitments and stock that hasn't moved. For a trade business, add unbilled work, deposits and upcoming subcontractor payments.
Use traffic lights carefully:
Green: The measure is within the agreed operating range.
Amber: The trend needs an owner and a defined response.
Red: The exception threatens a commitment, margin outcome or operating plan.
The question is, “What could create a cash problem before the next review?” A customer balance moving into overdue status may matter more than a strong sales number.
Dashboard two answers whether sales are profitable
A margin and pricing scorecard should break margin down by product, customer, channel, job or salesperson where the data supports it. Show list price, actual price, discounting, direct labour, materials, freight, rework and other direct leakage.
A simple example is a service business that reports revenue by job but not the hours spent completing each job. The report may show full order books and rising sales, yet the owner can't see that rushed work, scope changes and unbilled time are consuming the margin. The corrective action may be a price change, a revised scope approval process or a job-level review.
The question is, “Which sales are consuming capacity without producing the return we expected?”
Dashboard three answers whether activity supports the plan
An operational board links leading indicators to financial outcomes. Inventory businesses may track stockouts, slow-moving items, order fulfilment and returns. Service businesses may track quote conversion, scheduled capacity, jobs completed, utilisation and callbacks.
Keep the action beside the metric. “Returns rising” is an observation. “Operations manager to review the top return reasons and confirm a product or fulfilment response” is management reporting.
A short business scorecard review can create clarity when it focuses on decisions rather than presentation. Founders looking for layout ideas can compare KPI dashboard examples for practical reporting, then adapt the structure to their own data definitions and operating rhythm.
How to Implement Management Reporting Without Burning Hours
The first implementation mistake is trying to report everything. Start with the decisions that currently consume founder attention, then identify the numbers required to make those decisions earlier.
Build the pack around decisions
Write down the questions you need answered each week. Examples include:
Can we meet upcoming commitments? Identify bank balances, expected receipts, payroll, suppliers and tax obligations.
Where is margin leaking? Separate price, volume, mix, labour, freight, discounts and rework.
What activity needs intervention? Choose the operational measure that explains the financial movement.
What should we fund or pause? Link the forecast to hiring, stock, marketing, equipment and debt choices.
Create one definition for each KPI. “Revenue” might mean invoices raised, sales completed or cash received. Those are different measures. Document the chosen definition, source system, owner, frequency and target.
Map the data before choosing the software
List the systems that hold the facts: accounting software, point-of-sale, ecommerce, payroll, time tracking, inventory, customer relationship management and banking. Decide which system is authoritative for each field, then prevent manual rekeying wherever a reliable connection exists.
Standardise the close. Set deadlines for transaction coding, bank reconciliation, payroll posting, inventory updates, accruals and review. A template should display current results, comparison, variance, commentary and action in the same place each cycle.
Human review belongs where judgement matters. Automation belongs where repetition creates delay.
Automate data collection, recurring calculations, report distribution and threshold alerts. Keep a person responsible for reviewing cash-flow shocks, unusual payments, overdue receivables, inventory exceptions, payroll movements and unexplained margin changes. This is the balance between speed and control.
Australian SME owners face a material administration burden. One Australian resource estimates that owners spend 8 to 12 hours per week on finance and administration, while 40% spend more time on finance than on growing the business and 42% have missed opportunities because of the admin load, according to this analysis of where SME owners spend their time. Those figures support automation, but not blind automation.
ScotPac identified higher wages at 21%, hiring delays at 16%, lack of agility at 14% and lower profits at 13% among SME constraints in 2025, in the same source. A reporting process that removes repetitive assembly can give the owner more time to address those operating constraints.
For a structured implementation option, reporting automation for recurring finance workflows shows how automated collection and exception-led review can replace spreadsheet chasing without removing accountability.
Best Practices to Keep Your Reports Accurate and Actionable
A report earns trust through consistency. Use the same KPI definitions, source systems, account mappings and comparison periods each cycle. If a number changes because the definition changed, label that change clearly rather than presenting a false trend.
Keep the pack decision-ready
Use a front page with the few measures that determine the next action. Put supporting detail behind it. Every variance commentary should explain three things:
What moved: State the actual change in plain language.
Why it moved: Identify the operational or financial driver.
What happens next: Name the action, owner and timing.
Don't use colour as a substitute for judgement. A red indicator should explain the consequence and the response. An amber indicator should have a trigger for escalation, otherwise it becomes permanent decoration.
Connect the report to the operating plan
A KPI should connect to a target, a financial outcome and a practical lever. Receivables days link to collection routines and cash availability. Stock turns link to purchasing, range decisions and working capital. Labour mix links to scheduling, pricing and delivery capacity.
Review the pack in a recurring meeting with the people who can change the result. Keep the discussion focused on exceptions, decisions and follow-up. Archive each version so you can compare the forecast with the outcome and improve the assumptions.
The most useful management reporting system for a pressured SME is not the largest one. It is a reliable cash, margin and activity loop that shows strain early, directs attention to the right lever and reduces manual preparation. Start by reviewing your current pack and marking every page or KPI that doesn't lead to a decision. Remove the noise, automate the repeatable work and keep human judgement for the exceptions that can change your cash position.
Nexist helps Australian founders build recurring management packs, cash-flow dashboards and KPI review workflows that connect finance data to practical decisions. Visit Nexist to discuss how a virtual CFO can help you identify cash leaks, automate repetitive reporting and reclaim time for growth.
management reporting, virtual CFO services, SME KPIs, cash flow management, business dashboards

" width="24px"/><g d="M 0 24.129 L 0 0.129 L 24 0.129 L 24 24.129 Z M 0 24.129 L 0 0.129 L 24 0.129 L 24 24.129 Z M 24 3 C 24 1.344 22.656 0 21 0 L 3 0 C 1.344 0 0 1.344 0 3 L 0 21 C 0 22.656 1.344 24 3 24 L 21 24 C 22.656 24 24 22.656 24 21 Z M 6.883 8.375 L 2.863 8.375 L 2.863 20.467 L 6.883 20.467 Z M 4.899 2.545 C 3.524 2.545 2.625 3.449 2.625 4.634 C 2.625 5.795 3.496 6.724 4.846 6.724 L 4.872 6.724 C 6.273 6.724 7.146 5.795 7.146 4.634 C 7.12 3.449 6.274 2.545 4.899 2.545 Z M 16.747 8.09 C 14.614 8.09 13.659 9.263 13.124 10.086 L 13.124 8.374 L 9.105 8.374 C 9.159 9.508 9.105 20.466 9.105 20.466 L 13.124 20.466 L 13.124 13.713 C 13.124 13.352 13.15 12.99 13.257 12.732 C 13.547 12.01 14.209 11.262 15.319 11.262 C 16.773 11.262 17.355 12.372 17.355 13.996 L 17.355 20.466 L 21.374 20.466 L 21.374 13.532 C 21.374 9.818 19.391 8.09 16.747 8.09 Z" fill="transparent" height="24.12890599668026px" id="dSFdkJotL" width="24px"><path d="M 0 24 L 0 0 L 24 0 L 24 24 Z" fill="transparent" height="24px" id="wscNJE44G" transform="translate(0 0.129)" width="24px"/><g d="M 0 24.129 L 0 0.129 L 24 0.129 L 24 24.129 Z M 24 3 C 24 1.344 22.656 0 21 0 L 3 0 C 1.344 0 0 1.344 0 3 L 0 21 C 0 22.656 1.344 24 3 24 L 21 24 C 22.656 24 24 22.656 24 21 Z M 6.883 8.375 L 2.863 8.375 L 2.863 20.467 L 6.883 20.467 Z M 4.899 2.545 C 3.524 2.545 2.625 3.449 2.625 4.634 C 2.625 5.795 3.496 6.724 4.846 6.724 L 4.872 6.724 C 6.273 6.724 7.146 5.795 7.146 4.634 C 7.12 3.449 6.274 2.545 4.899 2.545 Z M 16.747 8.09 C 14.614 8.09 13.659 9.263 13.124 10.086 L 13.124 8.374 L 9.105 8.374 C 9.159 9.508 9.105 20.466 9.105 20.466 L 13.124 20.466 L 13.124 13.713 C 13.124 13.352 13.15 12.99 13.257 12.732 C 13.547 12.01 14.209 11.262 15.319 11.262 C 16.773 11.262 17.355 12.372 17.355 13.996 L 17.355 20.466 L 21.374 20.466 L 21.374 13.532 C 21.374 9.818 19.391 8.09 16.747 8.09 Z" fill="transparent" height="24.12890599668026px" id="sTpjGo1tb" width="24px"><path d="M 0 24 L 0 0 L 24 0 L 24 24 Z" fill="transparent" height="24px" id="s7ffpmKOD" transform="translate(0 0.129)" width="24px"/><g d="M 24 3 C 24 1.344 22.656 0 21 0 L 3 0 C 1.344 0 0 1.344 0 3 L 0 21 C 0 22.656 1.344 24 3 24 L 21 24 C 22.656 24 24 22.656 24 21 Z M 6.883 8.375 L 2.863 8.375 L 2.863 20.467 L 6.883 20.467 Z M 4.899 2.545 C 3.524 2.545 2.625 3.449 2.625 4.634 C 2.625 5.795 3.496 6.724 4.846 6.724 L 4.872 6.724 C 6.273 6.724 7.146 5.795 7.146 4.634 C 7.12 3.449 6.274 2.545 4.899 2.545 Z M 16.747 8.09 C 14.614 8.09 13.659 9.263 13.124 10.086 L 13.124 8.374 L 9.105 8.374 C 9.159 9.508 9.105 20.466 9.105 20.466 L 13.124 20.466 L 13.124 13.713 C 13.124 13.352 13.15 12.99 13.257 12.732 C 13.547 12.01 14.209 11.262 15.319 11.262 C 16.773 11.262 17.355 12.372 17.355 13.996 L 17.355 20.466 L 21.374 20.466 L 21.374 13.532 C 21.374 9.818 19.391 8.09 16.747 8.09 Z" fill="transparent" height="24.000006px" id="D0ecaHEcW" transform="translate(0 0)" width="24px"><path d="M 24 3 C 24 1.344 22.656 0 21 0 L 3 0 C 1.344 0 0 1.344 0 3 L 0 21 C 0 22.656 1.344 24 3 24 L 21 24 C 22.656 24 24 22.656 24 21 Z" fill="rgb(55, 184, 218)" height="24.000006px" id="IPLFE6zXx" width="24px"/><path d="M 4.02 0 L 0 0 L 0 12.092 L 4.02 12.092 Z" fill="rgb(255, 255, 255)" height="12.09201px" id="FWhtzAyuY" transform="translate(2.863 8.375)" width="4.02px"/><path d="M 2.274 0 C 0.899 0 0 0.904 0 2.089 C 0 3.25 0.871 4.179 2.221 4.179 L 2.247 4.179 C 3.648 4.179 4.521 3.25 4.521 2.089 C 4.495 0.904 3.649 0 2.274 0 Z" fill="rgb(255, 255, 255)" height="4.17876px" id="VmOsKv4kO" transform="translate(2.625 2.545)" width="4.52095px"/><path d="M 7.641 0 C 5.509 0 4.554 1.173 4.019 1.996 L 4.019 0.284 L 0 0.284 C 0.053 1.419 0 12.376 0 12.376 L 4.019 12.376 L 4.019 5.623 C 4.019 5.262 4.045 4.9 4.151 4.642 C 4.442 3.92 5.103 3.172 6.214 3.172 C 7.667 3.172 8.25 4.282 8.25 5.907 L 8.25 12.376 L 12.269 12.376 L 12.269 5.442 C 12.269 1.728 10.286 0 7.641 0 Z" fill="rgb(255, 255, 255)" height="12.37626px" id="n1XUbhaq0" transform="translate(9.105 8.09)" width="12.268830000000001px"/></g></g></g></g></svg>)