What Is Break Even Point Analysis
What is break even point analysis - Discover what break-even point analysis is & how to calculate it. Empower Australian SMEs to make smarter pricing, cash
Ansh Malhotra
You're probably in one of two spots right now.
The first is the busy-but-uneasy spot. Sales are moving. Staff are flat out. Orders are going out. Yet you still check the bank balance with a knot in your stomach because the business feels active, not secure.
The second is the planning spot. You're thinking about hiring, raising prices, launching a new line, taking on a bigger warehouse, or spending more on ads. But one question keeps blocking the decision: how much do we need to sell before this business stops draining cash and starts keeping it?
That's where break-even point analysis earns its keep. Not as an accountant's worksheet. As a practical line in the sand.
If revenue stays below that line, the business is funding the gap from cash reserves, debt, or your own patience. Once revenue moves above it, each additional sale starts doing the job founders want it to do: cover the engine, create profit, and give the business room to breathe.
For Australian SMEs, especially those carrying stock, labour-heavy overheads, or both, this number matters more than most founders realise. It tells you whether your current pricing works, whether your cost base is realistic, and whether “growing” is helping or just making the cash squeeze harder.
Table of Contents
The Critical Question Every Founder Must Answer
A founder can tell you their monthly sales in seconds. Fewer can tell you the exact point where those sales stop covering activity and start covering the business.
That gap matters.
Take a common small business pattern. A retailer has strong order volume, a decent average order value, and a growing customer list. On the surface, things look healthy. But rent, software, wages, packaging, merchant fees, freight, returns, and stock purchases keep chewing through cash. The owner thinks the problem is “not enough revenue” when the main problem is they don't know the minimum sales line the business must cross.
A trade business runs into the same problem in a different outfit. The calendar is packed, the phone keeps ringing, and the team is on the road every day. But if labour isn't priced properly, non-billable time is ignored, or overhead has crept up, being fully booked doesn't guarantee profit.
Practical rule: If you can't point to your break-even number, you're making pricing and growth decisions blind.
This is why founders ask, often in frustration, what is break even point analysis and why does everyone keep bringing it up? The plain-English answer is simple. It shows the level of sales required to cover all costs so you're no longer losing money.
That's the essential value. It gives you a hard operating threshold.
Once you know that threshold, decisions sharpen fast:
Pricing decisions become commercial, not emotional.
Hiring decisions get tied to required volume, not optimism.
Sales targets stop being arbitrary.
Cash conversations get clearer because you can see how far the business is from self-funding.
For a time-poor founder, that clarity is worth more than another dashboard full of vanity metrics.
Understanding the Core Components of Break-Even Analysis
Why busy doesn't always mean profitable
Break-even analysis is only useful if the inputs are clean. Most mistakes happen before the formula even starts.
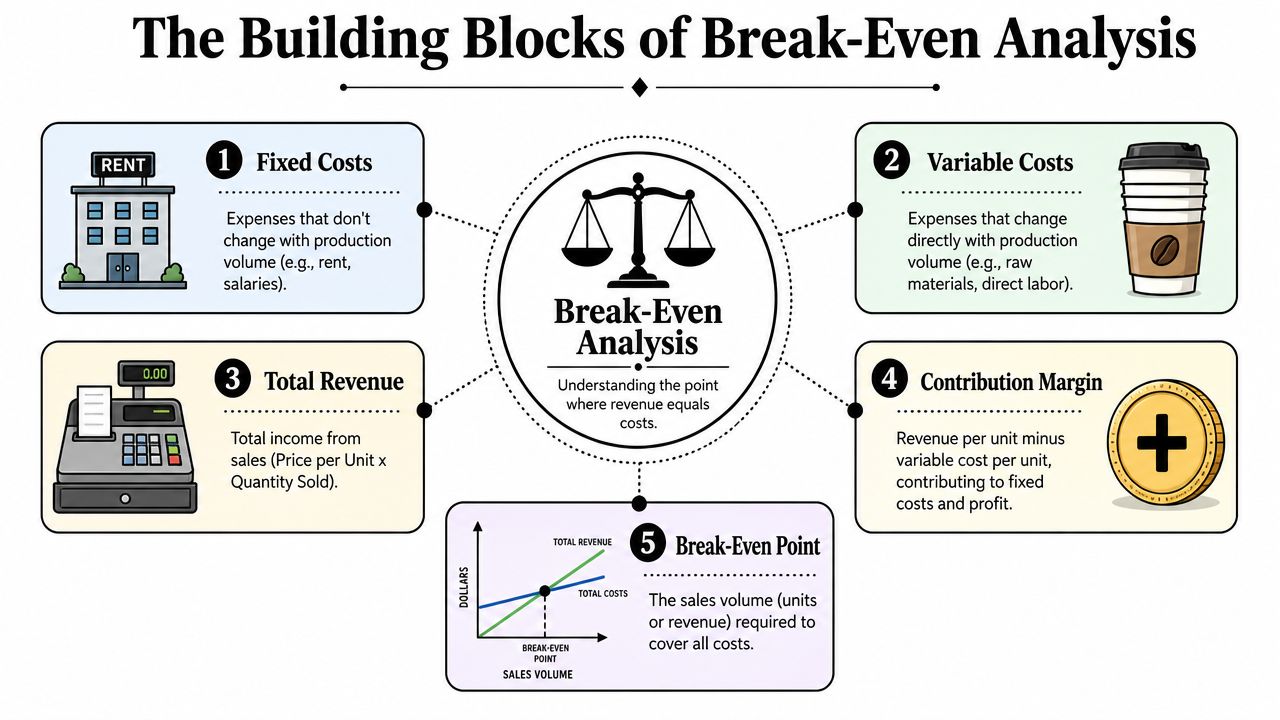
Think of a small coffee shop. The owner pays rent, insurance, software, and a salaried manager whether they sell one flat white or a full day's worth. Those are fixed costs. Then there's milk, beans, takeaway cups, and merchant fees that rise as more coffees are sold. Those are variable costs.
The sale price of each coffee has to do two jobs. First, it has to cover the variable cost of that cup. Second, the leftover amount has to help pay the fixed costs. That leftover amount is the contribution margin.
A lot of founders know their revenue. Fewer know their contribution margin. That's usually where the misunderstanding starts.
If you want a cleaner way to separate these categories in practice, this guide on fixed vs variable costs is worth reviewing before you build your model.
The four parts that drive the number
Break-even analysis depends on four inputs.
Fixed costs are overheads that don't move much with sales volume. Rent, admin wages, subscriptions, insurance, and base software spend sit here.
Variable costs move with each sale. Materials, packaging, direct fulfilment, transaction fees, and direct production inputs belong here.
Selling price is what the customer pays for one unit, one job, or one service package.
Contribution margin is the amount left after variable cost is removed from the selling price.
The Victorian Government method, referenced in this Australian break-even guide, defines the core unit formula as Break-Even Point (Units) = Fixed Costs divided by Contribution Margin per Unit. The same source also details the dollar method as Overhead Expenses divided by the ratio of 1 minus COGS divided by Total Sales, and states that the unit calculation can be expressed as Overhead Expenses divided by the difference between Unit Selling Price and Unit Cost to Produce.
That matters because it keeps the logic honest. The model only works when you separate overhead from direct cost properly.
Break-even isn't a finance trick. It's a test of whether each sale contributes enough to carry the business.
In hospitality, that often leads straight into menu engineering and tighter recipe costing. If food margin is slipping, practical resources on lower restaurant food costs can help operators improve the contribution margin side of the equation before they touch pricing.
Key break-even formulas
Formula Type | Calculation |
|---|---|
Break-even point in units | Fixed Costs / Contribution Margin per Unit |
Contribution margin per unit | Selling Price per Unit - Variable Cost per Unit |
Break-even point in sales dollars | Overhead Expenses / (1 - COGS / Total Sales) |
There's one more nuance for founders with more than one product or service line. If you sell a mix of items, the break-even point depends on sales mix and your weighted average contribution margin, not just the margin on your favourite product.
That's why a business can grow revenue and still feel squeezed. If more sales come from lower-margin products, the break-even point gradually moves against you.
How to Calculate Your Break-Even Point with Worked Examples
Start with the mechanics. Get one period. Usually a month. Pull your fixed costs, variable costs, and selling price into a simple worksheet. Then test the model before you make any decision from it.

Worked example for an inventory business
Use a straightforward ecommerce example with one main product category.
List your inputs like this:
Fixed costs for the month include warehouse rent, ecommerce apps, admin wages, insurance, and base marketing retainers.
Variable cost per order includes landed product cost, packaging, pick-and-pack, payment fees, and shipping if you absorb it.
Selling price per order is your average realised selling price after normal discounts.
The calculation flow is simple:
Find contribution margin per order by subtracting variable cost per order from selling price per order.
Calculate break-even orders by dividing fixed costs by contribution margin per order.
Calculate break-even revenue using the sales-dollar formula if you want a revenue threshold rather than an order count.
What matters in inventory businesses is discipline around COGS. Don't use supplier invoice totals loosely. Use the actual cost to fulfil each order, including the direct costs that follow the sale.
This is also where founders should connect break-even with broader margin reporting. If your gross margin inputs are wrong, your break-even number will be wrong too. A practical walkthrough on how to calculate gross profit margin helps tighten that part of the model.
Worked example for a service business
Now switch to a service firm, such as an agency, consultant, or trade business.
The trap here is different. There may be no physical stock, but labour still behaves like a direct cost in parts of the business. If you bill by project or by hour, the variable component often includes delivery labour, contractor costs, travel tied to jobs, and software used only when work is delivered.
The structure looks like this:
Fixed costs include office rent, admin salaries, core software, insurance, bookkeeping, and management wages that don't fluctuate directly with jobs sold.
Variable costs include direct delivery labour, subcontractors, job-specific materials, and other direct costs attached to client work.
Selling price can be per hour, per day, per project, or per retainer.
Contribution margin is what's left from each job or billable unit to absorb overhead.
A trade business often benefits from translating the model into productive labour units. Instead of “How many jobs do we need?” the better question is often “How many billable crew hours or chargeable days do we need at our current margin to cover overhead?”
If a service business ignores non-billable time, it usually understates the real break-even point.
That's why a fully booked team can still produce weak cash results. The booked hours may not be the same as the profitable hours.
For founders who prefer a walkthrough before they build their own spreadsheet, this short explainer helps visualise the process:
A simple process you can copy
If you're doing this for your own business, use this checklist:
Pick one period. Monthly is usually the cleanest starting point.
Separate overhead from direct cost. Don't guess. Review the P&L line by line.
Choose the right unit. For retail it may be units sold. For ecommerce it may be orders. For a trade business it may be billable hours or jobs.
Use actual realised pricing. Not list price, unless that's what customers really pay.
Test more than one scenario. Standard price, discounted price, higher wage cost, lower volume.
Founders often ask what is break even point analysis in practical terms, not textbook terms. This is the practical answer. It's a decision model built from your actual operating reality.
Using Your Break-Even Point for Strategic Decisions
Once you've got the number, put it to work. A break-even point sitting in a spreadsheet does nothing on its own.
Pricing without guessing
Price increases usually feel risky because founders think in customer reactions first. Break-even analysis brings the conversation back to economics.
If your contribution margin is thin, a small discount can do more damage than expected because it reduces the amount each sale contributes to overhead. On the other hand, a well-judged price rise can lower the volume required to cover costs, provided demand holds up.
That's especially useful for ad-driven businesses. If you acquire customers online, your margin has to absorb not just product cost but also paid acquisition. In that context, tools that help calculate your break-even ROAS can sharpen the connection between pricing, gross margin, and ad spend tolerance.
Sales targets that mean something
Many teams get handed a sales target that has no relationship to the cost base. That creates bad behaviour. Reps chase low-quality deals, discounting increases, and the business misses profit while hitting top-line activity.
Break-even analysis improves target setting because it gives management a minimum commercial threshold.
Use it to frame three levels of performance:
Break-even level is the baseline. Below this, the business is not covering itself.
Comfort level is where there's enough room to absorb normal volatility in discounts, returns, or slower collections.
Target level is where the business funds growth rather than straining under it.
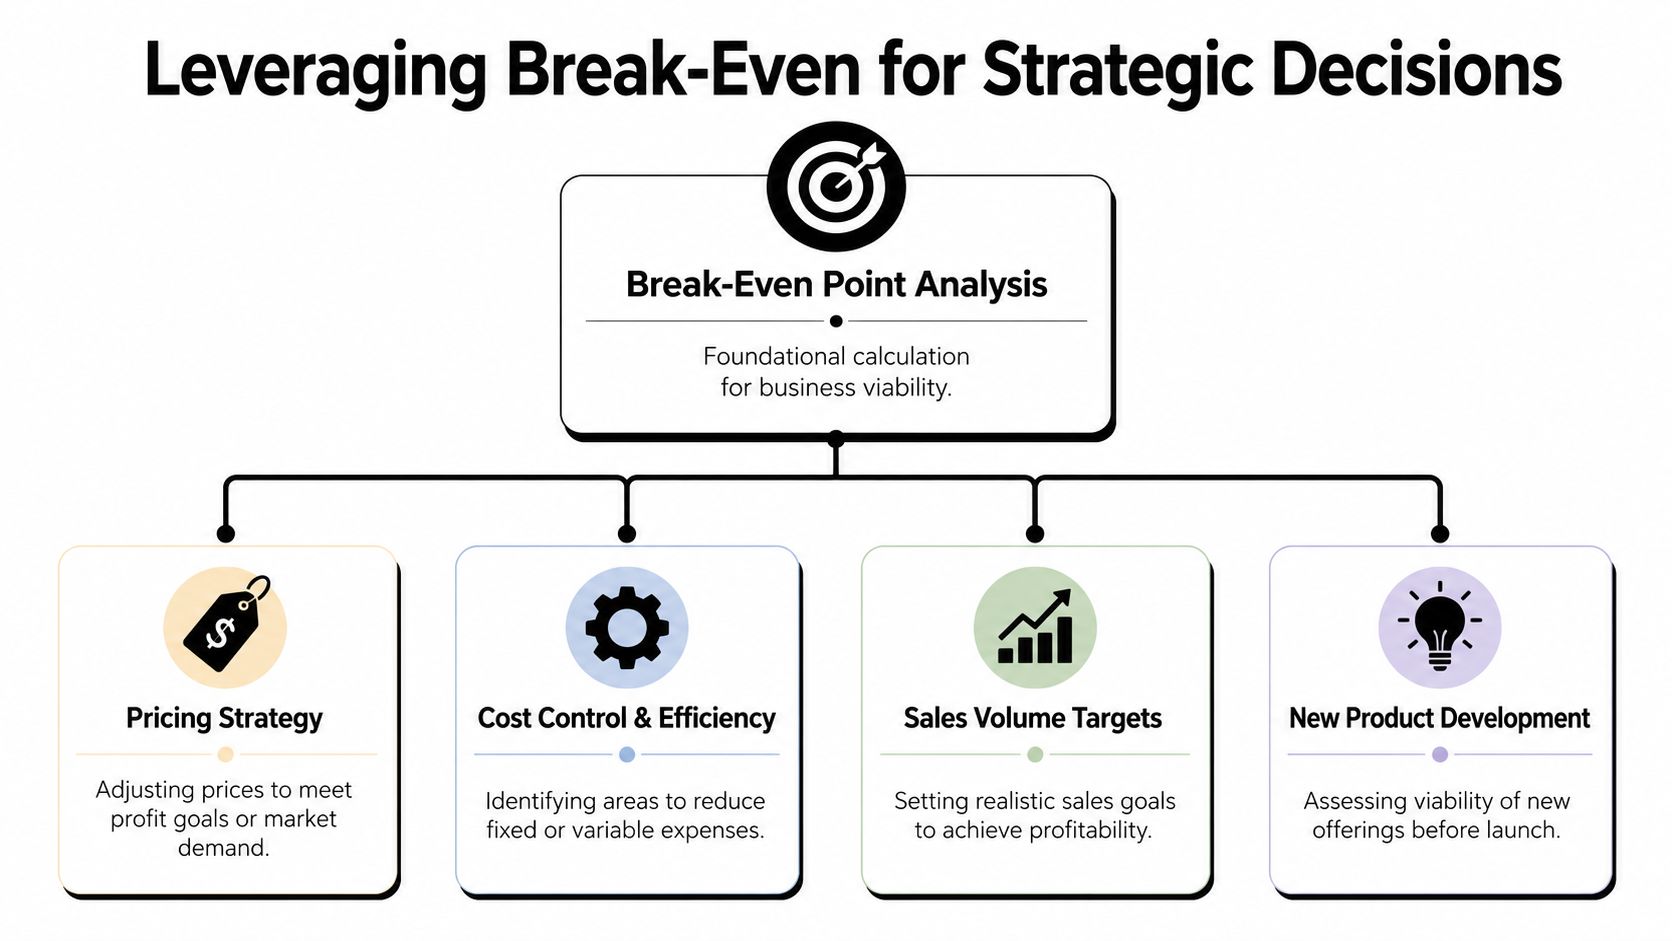
A founder can then ask better questions. Do we need more leads, higher conversion, improved pricing, or a better product mix? Break-even doesn't answer every one of those by itself, but it tells you which conversations matter.
Cash flow decisions before pressure builds
Break-even is an accounting threshold, but it has direct operational value for cash flow.
If your forecast says sales will sit below break-even for a period, you know early that cash pressure is coming. That gives you time to respond. You can delay a hire, renegotiate a supplier term, reduce discretionary spend, or tighten collections before the problem turns urgent.
The best use of break-even analysis is not reporting last month. It's spotting next month's problem while there's still time to act.
For Australian SMEs, that's where the tool becomes far more useful than a static annual budget. It becomes an early warning system tied to real operating choices.
Common Pitfalls and How to Perform Sensitivity Analysis
Where founders get the calculation wrong
The formula is simple. Real life isn't.
The most common mistake is cost classification. Founders put too much into fixed costs, or too much into variable costs, and then trust the answer because the spreadsheet looks neat. If the inputs are wrong, the output is polished nonsense.
Another problem is using headline price instead of realised price. Discounts, promos, returns, and freight subsidies all cut into the amount each sale contributes. If you ignore them, your model overstates margin and understates the break-even point.
Why inventory changes the picture
Inventory-heavy SMEs get hit by a more specific trap. They often treat stock only as a variable cost of future sales and ignore the cash already tied up in it.
That's dangerous because stock doesn't just sit passively on the balance sheet. It absorbs cash, creates storage pressure, and can lose value when products age, move slowly, or need discounting. The verified business context states that 68% of Australian e-commerce founders report “profit trapped in stock” as their primary cash leak in this source context from Lifestyle Tradie. It also notes that inventory businesses face lumpy costs such as warehousing and unsold stock depreciation that standard linear models miss.
That's why break-even for a stock-heavy business can't stop at a clean COGS line. Founders need to ask:
How much stock is sitting too long and forcing discounting?
Which SKUs have weak contribution even before storage and handling friction?
Whether buying more stock lowers unit cost but worsens cash pressure
How much of reported profit is still trapped in inventory rather than banked as cash
A retailer can look profitable on paper and still run short on cash because too much margin is sitting on shelves.
How to run a practical sensitivity check
Sensitivity analysis means testing how the break-even point changes when key assumptions move. It's a what-if exercise. Nothing fancy. Just disciplined.
Business Queensland's 2026 update says 42% of Queensland SMEs revised fixed costs upward by 15–20% in the last 12 months due to rising operational expenses, highlighting why static models go stale quickly in a volatile cost environment, as outlined in Business Queensland's break-even and profit guidance.
Use that reality as a prompt to test scenarios such as:
Higher fixed costs from wages, rent, power, or software.
Lower selling price after discounting pressure.
Lower margin mix if customers shift toward cheaper items.
Lower volume during slower trading periods.
Build three versions of your model. Base case. Tough month. Strong month. Then watch what happens to the break-even line.
If the business only works in the strong month scenario, you don't have a sound model yet. You have a hope-based one.
Operationalising Break-Even Analysis with a Virtual CFO
From annual exercise to operating rhythm
Most businesses calculate break-even once, nod at it, then leave it untouched while pricing, costs, and product mix keep changing.
That's not enough.
A useful break-even model should live inside monthly reporting, forecasting, and operational review. The number needs to update when wages rise, supplier costs shift, product mix changes, or delivery economics weaken. Otherwise the founder is working off an expired threshold.
For trade businesses, that can mean linking the model to quoting and job margin review. Teams using tools like Exayard electrical estimating software already know that estimating accuracy changes the economics of every accepted job. Break-even analysis becomes more valuable when those operational inputs feed finance decisions instead of sitting in separate systems.
What good implementation looks like
Operationalising break-even usually means a few practical habits:
Monthly recalibration so the threshold reflects current costs, not last quarter's.
Forecast integration so upcoming sales plans can be judged against the minimum required.
Margin visibility by product or service line so weak contributors don't hide inside total revenue.
Decision use in pricing, hiring, stock purchasing, and ad spend reviews.
That ongoing layer is where a virtual chief financial officer becomes useful. Not to make the formula more complex. To keep the number current, connect it to actual decisions, and stop it becoming another report no one uses.

A founder doesn't need more finance theatre. They need a working system that answers questions like these fast:
Are we still priced correctly?
Has overhead moved our minimum sales line?
Which offers help us cross break-even sooner?
Are we buying stock or labour ahead of demand in a way that strains cash?
That's when the question “what is break even point analysis” stops being academic. It becomes a management discipline.
If you want help turning break-even analysis into a live operating tool, Nexist works with Australian founders to tighten margins, uncover cash leaks, and build finance systems that support real decisions. The fastest next step is often getting your numbers into one clean model so you can see where profit starts, where cash gets trapped, and what needs to change first.
what is break even point analysis, break even formula, cash flow management, sme finance australia, virtual cfo

" width="24px"/><g d="M 0 24.129 L 0 0.129 L 24 0.129 L 24 24.129 Z M 0 24.129 L 0 0.129 L 24 0.129 L 24 24.129 Z M 24 3 C 24 1.344 22.656 0 21 0 L 3 0 C 1.344 0 0 1.344 0 3 L 0 21 C 0 22.656 1.344 24 3 24 L 21 24 C 22.656 24 24 22.656 24 21 Z M 6.883 8.375 L 2.863 8.375 L 2.863 20.467 L 6.883 20.467 Z M 4.899 2.545 C 3.524 2.545 2.625 3.449 2.625 4.634 C 2.625 5.795 3.496 6.724 4.846 6.724 L 4.872 6.724 C 6.273 6.724 7.146 5.795 7.146 4.634 C 7.12 3.449 6.274 2.545 4.899 2.545 Z M 16.747 8.09 C 14.614 8.09 13.659 9.263 13.124 10.086 L 13.124 8.374 L 9.105 8.374 C 9.159 9.508 9.105 20.466 9.105 20.466 L 13.124 20.466 L 13.124 13.713 C 13.124 13.352 13.15 12.99 13.257 12.732 C 13.547 12.01 14.209 11.262 15.319 11.262 C 16.773 11.262 17.355 12.372 17.355 13.996 L 17.355 20.466 L 21.374 20.466 L 21.374 13.532 C 21.374 9.818 19.391 8.09 16.747 8.09 Z" fill="transparent" height="24.12890599668026px" id="dSFdkJotL" width="24px"><path d="M 0 24 L 0 0 L 24 0 L 24 24 Z" fill="transparent" height="24px" id="wscNJE44G" transform="translate(0 0.129)" width="24px"/><g d="M 0 24.129 L 0 0.129 L 24 0.129 L 24 24.129 Z M 24 3 C 24 1.344 22.656 0 21 0 L 3 0 C 1.344 0 0 1.344 0 3 L 0 21 C 0 22.656 1.344 24 3 24 L 21 24 C 22.656 24 24 22.656 24 21 Z M 6.883 8.375 L 2.863 8.375 L 2.863 20.467 L 6.883 20.467 Z M 4.899 2.545 C 3.524 2.545 2.625 3.449 2.625 4.634 C 2.625 5.795 3.496 6.724 4.846 6.724 L 4.872 6.724 C 6.273 6.724 7.146 5.795 7.146 4.634 C 7.12 3.449 6.274 2.545 4.899 2.545 Z M 16.747 8.09 C 14.614 8.09 13.659 9.263 13.124 10.086 L 13.124 8.374 L 9.105 8.374 C 9.159 9.508 9.105 20.466 9.105 20.466 L 13.124 20.466 L 13.124 13.713 C 13.124 13.352 13.15 12.99 13.257 12.732 C 13.547 12.01 14.209 11.262 15.319 11.262 C 16.773 11.262 17.355 12.372 17.355 13.996 L 17.355 20.466 L 21.374 20.466 L 21.374 13.532 C 21.374 9.818 19.391 8.09 16.747 8.09 Z" fill="transparent" height="24.12890599668026px" id="sTpjGo1tb" width="24px"><path d="M 0 24 L 0 0 L 24 0 L 24 24 Z" fill="transparent" height="24px" id="s7ffpmKOD" transform="translate(0 0.129)" width="24px"/><g d="M 24 3 C 24 1.344 22.656 0 21 0 L 3 0 C 1.344 0 0 1.344 0 3 L 0 21 C 0 22.656 1.344 24 3 24 L 21 24 C 22.656 24 24 22.656 24 21 Z M 6.883 8.375 L 2.863 8.375 L 2.863 20.467 L 6.883 20.467 Z M 4.899 2.545 C 3.524 2.545 2.625 3.449 2.625 4.634 C 2.625 5.795 3.496 6.724 4.846 6.724 L 4.872 6.724 C 6.273 6.724 7.146 5.795 7.146 4.634 C 7.12 3.449 6.274 2.545 4.899 2.545 Z M 16.747 8.09 C 14.614 8.09 13.659 9.263 13.124 10.086 L 13.124 8.374 L 9.105 8.374 C 9.159 9.508 9.105 20.466 9.105 20.466 L 13.124 20.466 L 13.124 13.713 C 13.124 13.352 13.15 12.99 13.257 12.732 C 13.547 12.01 14.209 11.262 15.319 11.262 C 16.773 11.262 17.355 12.372 17.355 13.996 L 17.355 20.466 L 21.374 20.466 L 21.374 13.532 C 21.374 9.818 19.391 8.09 16.747 8.09 Z" fill="transparent" height="24.000006px" id="D0ecaHEcW" transform="translate(0 0)" width="24px"><path d="M 24 3 C 24 1.344 22.656 0 21 0 L 3 0 C 1.344 0 0 1.344 0 3 L 0 21 C 0 22.656 1.344 24 3 24 L 21 24 C 22.656 24 24 22.656 24 21 Z" fill="rgb(55, 184, 218)" height="24.000006px" id="IPLFE6zXx" width="24px"/><path d="M 4.02 0 L 0 0 L 0 12.092 L 4.02 12.092 Z" fill="rgb(255, 255, 255)" height="12.09201px" id="FWhtzAyuY" transform="translate(2.863 8.375)" width="4.02px"/><path d="M 2.274 0 C 0.899 0 0 0.904 0 2.089 C 0 3.25 0.871 4.179 2.221 4.179 L 2.247 4.179 C 3.648 4.179 4.521 3.25 4.521 2.089 C 4.495 0.904 3.649 0 2.274 0 Z" fill="rgb(255, 255, 255)" height="4.17876px" id="VmOsKv4kO" transform="translate(2.625 2.545)" width="4.52095px"/><path d="M 7.641 0 C 5.509 0 4.554 1.173 4.019 1.996 L 4.019 0.284 L 0 0.284 C 0.053 1.419 0 12.376 0 12.376 L 4.019 12.376 L 4.019 5.623 C 4.019 5.262 4.045 4.9 4.151 4.642 C 4.442 3.92 5.103 3.172 6.214 3.172 C 7.667 3.172 8.25 4.282 8.25 5.907 L 8.25 12.376 L 12.269 12.376 L 12.269 5.442 C 12.269 1.728 10.286 0 7.641 0 Z" fill="rgb(255, 255, 255)" height="12.37626px" id="n1XUbhaq0" transform="translate(9.105 8.09)" width="12.268830000000001px"/></g></g></g></g></svg>)