Reporting Automation for SMEs: A Practical How-To Guide
Reporting automation for SMEs explained step by step. Learn how to set KPIs, map data, build dashboards and roll out automated reports without the chaos.
Ansh Malhotra

At 9.30pm on Sunday, the founder of a growing Australian business is still preparing Monday's numbers. Xero has one export, Stripe has another, the bank feed needs checking, and the cash-flow spreadsheet contains formulas nobody wants to touch. Merchant settlements must be matched to invoices, figures copied into a board pack, and totals checked again before a lender call.
That isn't a dashboard problem. It's an operating-model problem. Reporting automation works when the entire reporting loop is redesigned, from standardised inputs and defined calculations to scheduled delivery, exception alerts and clear human ownership. Some steps should be automated. Others should remain deliberately human-led because they involve judgement, context or accountability.
Table of Contents
The Monday Morning Every Founder Dreads
The work usually starts with a series of apparently small tasks. Someone downloads a CSV from the accounting platform, checks payment-provider settlements against invoices, pastes revenue into a cash-flow workbook and updates a board report. Then the founder notices that the bank balance doesn't match the spreadsheet, or that a payout arrived after the reporting cut-off, and the whole pack becomes a manual investigation.
By Monday morning, the report may look polished, but confidence has already been spent. The founder isn't asking whether the chart colours are attractive. They're asking whether the figures are complete, whether GST has been treated consistently and whether the cash position can withstand scrutiny from a lender, director or adviser.
Practical rule: Automate the repeatable path, not the uncertainty. If nobody can explain where a number comes from, putting it in a dashboard only makes the confusion faster.
A useful reporting operating model has four connected parts:
Standardised inputs: Accounting, payroll, banking, sales and operational systems use agreed fields and classifications.
Defined calculations: Each KPI has a plain-English formula, an owner and a named source column.
Scheduled delivery: Reports arrive when the audience needs them, rather than when someone remembers to prepare them.
Exception handling: The system flags unusual results, while a finance owner investigates and explains them.
Australia already has a strong example of reporting automation embedded in public workflows. The Australian Government describes Standard Business Reporting as a standard approach to digital record keeping that lets compatible software send information once to multiple government and regulatory agencies. It supports obligations connected with the ATO, ASIC, APRA, state and territory revenue offices and the ABS.
For an SME, the lesson is practical. Reporting automation isn't a purchase that ends when the software goes live. It's a redesign of how numbers enter the business, how people challenge them and how decisions are recorded.
Define Reporting Objectives and KPIs First
The first question isn't “Which dashboard should we buy?” It's who needs to make which decision, using which evidence?
List every report consumer. A lender may need confidence in debt service and cash coverage. A board may focus on profit, risk and runway. An operations lead may need overdue invoices, labour utilisation or job margin. A tax agent needs clean records and reconciled obligations. These audiences shouldn't receive the same report because a tool makes duplication easy.
Write one paragraph for each report before opening Power BI, Fathom or Looker Studio. State the decision, the reporting period, the acceptable level of detail and the action that follows a variance. If you can't describe the decision, the report probably isn't ready for automation.
A worked example for a tradies business
Suppose a trade business wants three outputs:
A weekly cash-flow report to decide whether it can commit to upcoming supplier and payroll payments.
A monthly gross-margin report by job to identify underpriced work and investigate cost overruns.
A quarterly runway report to decide whether hiring, borrowing or spending should be delayed.
Translate each objective into a KPI with a simple definition:
Operating cash: Cash receipts from customers less operating payments during the selected period, sourced from reconciled bank transactions and accounting records.
Gross margin percentage: Revenue less direct job costs, divided by revenue, with job revenue and direct costs assigned through the job system and chart of accounts.
Months of runway: Available cash divided by average monthly net cash outflow, using an agreed forecast period and documented assumptions.
Every KPI needs a named owner. The bookkeeper may own transaction coding, the finance lead may own the calculation and the founder may own the decision. That separation matters because a person can be responsible for data quality without being the person who decides what the number means.
For a useful treatment of uncertainty in management reporting, the discussion of KPIs and confidence intervals is worth reviewing. The important operational point is that a KPI should communicate both the result and the confidence you have in its completeness.
Use a short mapping table
Audience | Decision they make | Report / KPI | Cadence | Source data |
|---|---|---|---|---|
Founder | Commit to upcoming payments | Operating cash and near-term cash outlook | Weekly | Bank, accounting, payroll |
Operations lead | Investigate weak jobs | Gross margin by job | Monthly | Job system, accounting |
Board or lender | Assess financial resilience | Runway and covenant measures | Quarterly | Accounting, bank, forecast |
Tax agent | Prepare and review obligations | BAS and tax reporting data | Lodgement cycle | Accounting, payroll, GST records |
Cut aggressively. If a KPI has no decision attached, remove it from the automated pack. A crowded report doesn't create control. It creates more places for attention to go.
You can also use a business scorecard to keep the decision layer visible. The scorecard should connect financial measures with the operational actions that influence them, rather than becoming another list of numbers.
Map Data Sources and Design the Data Model
Most reporting failures begin before the dashboard. They begin when the business hasn't agreed which system owns each number.
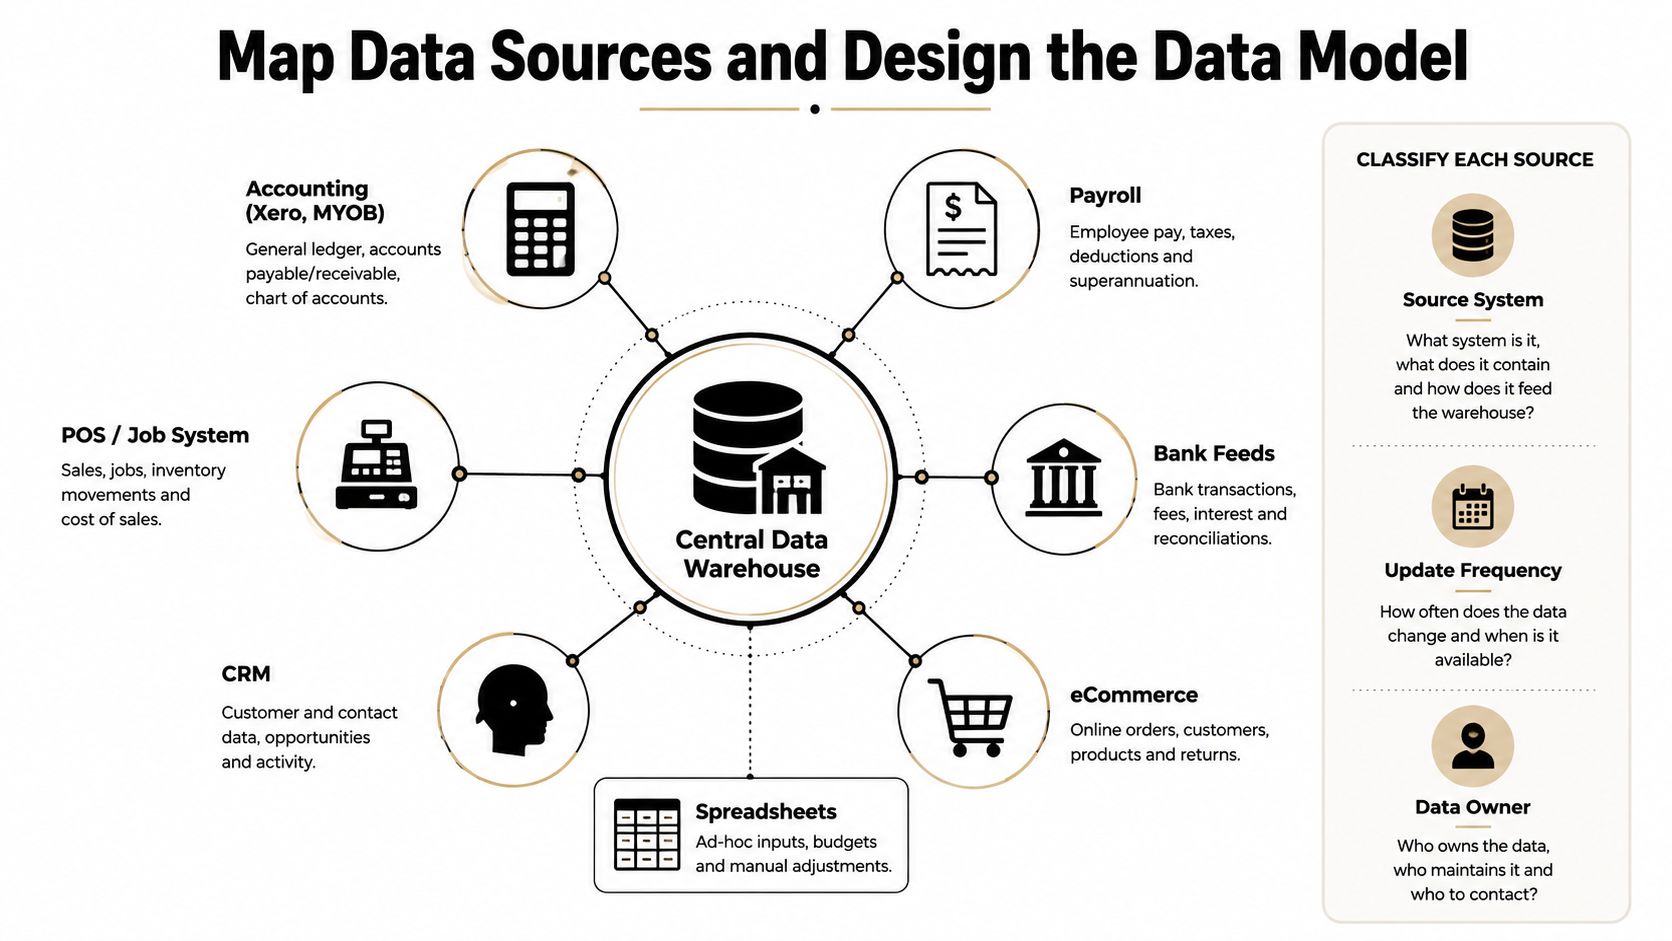
Create an inventory of every system that holds data used by a report. Include Xero or MYOB, payroll, job management, POS, bank feeds, CRM, eCommerce and spreadsheets. Record the data owner, update frequency, key fields, access method and known weaknesses.
Classify each source into one of three groups:
System of record: The authoritative place where a transaction or master record is created and maintained.
System of enrichment: A source that adds context, such as job codes, customer segments or product categories.
Scratchpad: A temporary working file used for investigation, adjustments or commentary, not as the final source of truth.
Build a model that can be checked
A practical SME model can stay simple. Use a central transaction fact table, then connect dimensions for customer, product, job and date. Add a staging layer where bank descriptions, GST codes, dates and account mappings are cleaned before reporting.
The staging layer is where you handle messy reality. A bank feed may describe the same supplier in several ways. A payroll export may use different cost categories from the general ledger. A job system may record labour against a project while the accounting system records the invoice against a customer. Clean those differences before the figures reach a KPI.
Avoid three common traps:
Live bank balances: Stage bank data before using it in a report. A live balance can change while transactions remain unreconciled.
Shared spreadsheets: Treat a shared Google Sheet as a controlled input or scratchpad, not an ungoverned source of truth.
Payroll leakage: Don't include wages in job margin unless the allocation method is explicit and appropriate for the decision.
A management-reporting workflow should make the source, transformation and destination visible. Resources explaining Wisely management reporting can help clarify how recurring reports should connect operational data with management decisions.
For Australian SMEs comparing accounting and finance tools, this guide to small business finance software is useful when assessing the role each platform should play.
Data-model rule: Every KPI formula must resolve to one named column in one table. If the formula can't point to a specific field, it can't be tested properly.
That rule may feel strict, but it prevents the most expensive form of reporting ambiguity, the number that everyone uses and nobody owns.
Choose Your Tech Stack With Real Criteria
Vendor selection comes fourth, not first. Start by deciding how data will be extracted, transformed, presented and monitored. A tool that looks impressive in a demonstration can still be a poor fit if your bookkeeper can't maintain the connection or your finance lead can't trace a variance.
Layer | Common options | Key selection criteria | Watch out for |
|---|---|---|---|
Extraction | Native connectors, CSV uploads, managed connectors | Coverage of Xero, MYOB, payroll, banking and operational systems | A connector may pull summary fields but omit the detail you need |
Transformation | Spreadsheet models, in-tool logic, dbt | Version control, testability and clear ownership | Hidden formulas and undocumented overrides |
Presentation | Power BI, Looker Studio, Tableau, Metabase | User access, refresh reliability and audience fit | Building complex visuals that don't support decisions |
Alerting | Email, Slack, Teams, in-app notifications | Threshold control, escalation and audit history | Alert fatigue from notifications without action |
Governance | Data catalogue, approval workflow, access controls | Australian data residency, permissions and lineage | Assuming the dashboard itself provides governance |
Score each option against six practical criteria: time to first report, total cost at your data volume, audit trail and version control, Australian data residency, integration with Xero, MYOB and Employment Hero, and the skills already available in your team.
A worked choice for a services business
A services business with substantial revenue may compare Power BI with a managed connector against Looker Studio with manual exports. Power BI plus a managed connector may require more setup, but it can provide a repeatable refresh path, stronger modelling and better control over permissions. Looker Studio with manual exports may be cheaper and faster for a simple pack, but the recurring export work remains a dependency and can reintroduce spreadsheet errors.
The right answer depends on complexity, not prestige. If the business has a small number of reports, stable data and a capable bookkeeper, a no-code option inside Xero Analytics Plus or Fathom may be enough. If reporting spans multiple systems, job-level profitability and exception workflows, a more structured model is usually justified.
Before choosing a platform, assess the wider automating business processes implications. Reporting automation often exposes process weaknesses in invoicing, coding and approvals, so the stack must support those controls rather than merely display their results.
Choose the stack your bookkeeper can maintain, not the one the salesperson demos best.
Build Automated Dashboards, Reports and Alerts
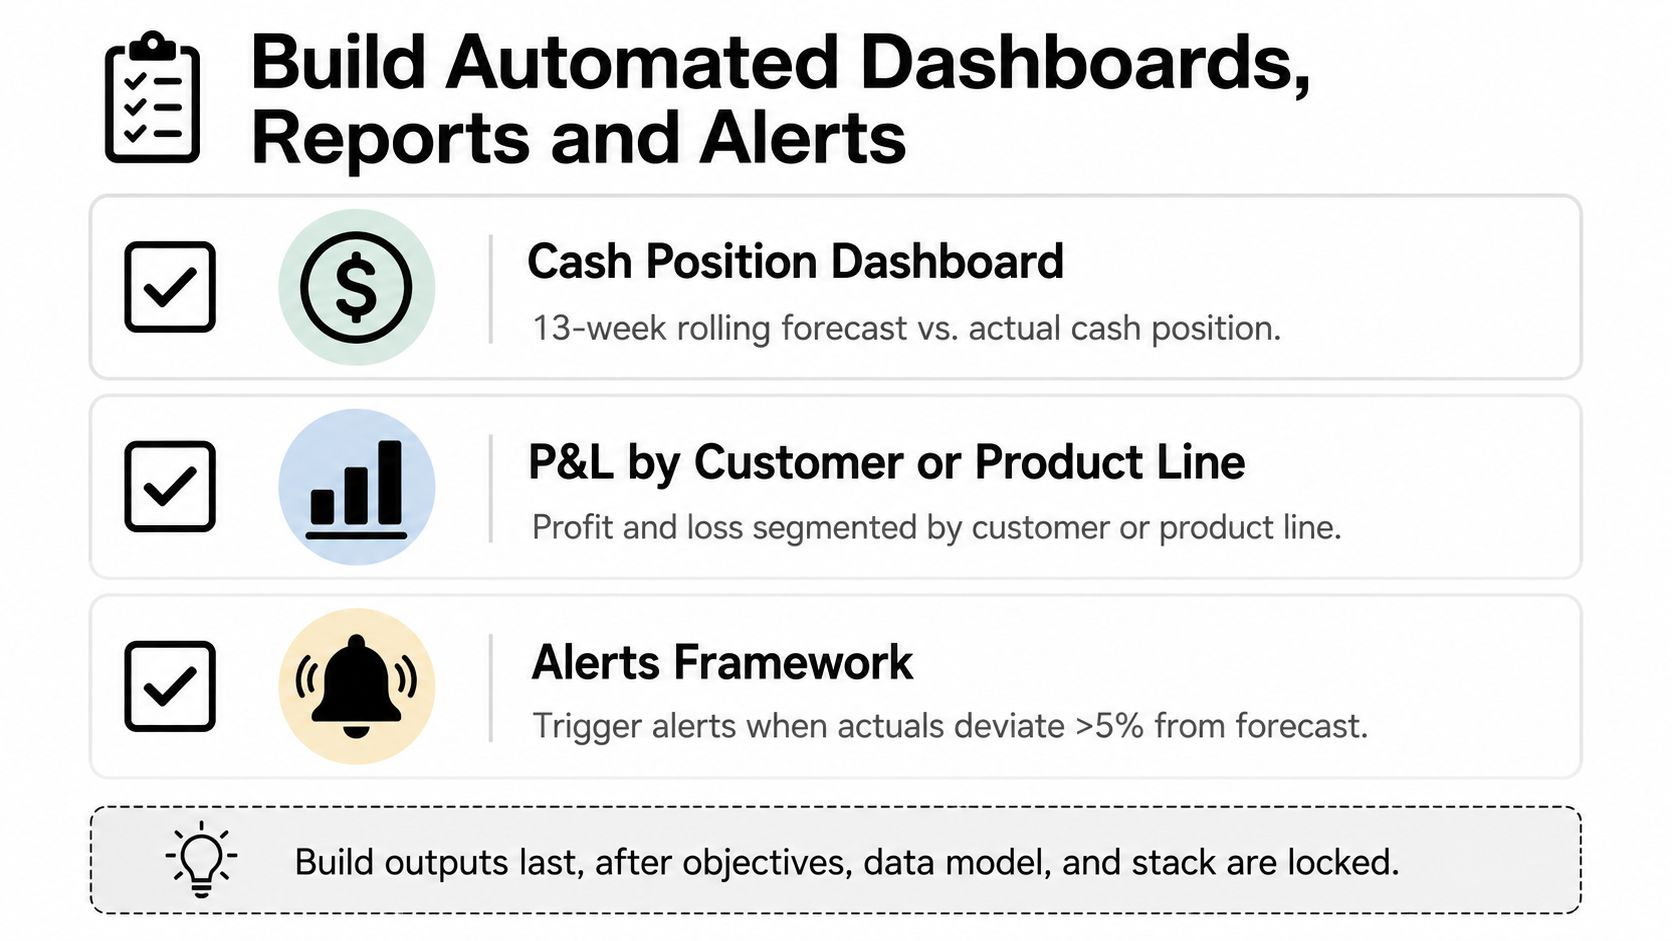
Build outputs last. Once objectives, data sources, calculations and technology are settled, create a small set of reports that people will use.
Start with three core views:
Cash position: Show a rolling cash forecast against actual cash movement, upcoming commitments and the assumptions behind the forecast.
Profit and loss by customer or product line: Separate revenue, direct costs and contribution so managers can investigate mix and pricing.
Working-capital scorecard: Bring together debtors, stock and creditors, with clear owners for each exception.
Each dashboard should have a consistent structure. Put the headline KPI at the top, show the trend beneath it, include a variance table and leave a written commentary field for the person responsible for the review. A dashboard without commentary can show movement but not meaning.
Schedule delivery around decisions
Map delivery to the audience:
Board pack: A concise report delivered on the first business day, with unresolved data issues clearly marked.
Leadership sales flash: A Monday update covering sales, invoices, collections and material changes.
Operations exception report: A Friday list of overdue actions, failed reconciliations and unusual cost movements.
Alerts should fire only when someone knows what to do next. Useful rules might include debtor days above an agreed threshold, a bank balance below the business's minimum cash policy or a material change in gross margin. The threshold must be documented, reviewed and linked to an owner. Don't use a generic rule because the software offers it.
For readers comparing the direction of the market, this overview of accounting automation predictions 2026 provides broader context. Your own alert design still needs to reflect the business's risks and operating rhythm.
This video can help teams visualise the difference between a report that merely displays information and one that supports an operating cadence.
Keep judgement visible
Accruals, inter-company eliminations, board narrative and judgement-heavy variance explanations should usually remain human-led. Automation can prepare the evidence, suggest an exception and preserve the review trail. It shouldn't decide how an unusual transaction affects management's interpretation.
Review each dashboard monthly. Remove unused KPIs, check that owners still exist, inspect failed refreshes, test a sample back to the general ledger and confirm that every alert still leads to an action.
Test, Validate and Roll Out Without Breaking Trust
Go-live should be a controlled cutover, not a switch-flip. The Productivity Commission's interim reporting on digital financial reporting found that no digital financial reports had been submitted as of June 2025, despite voluntary lodging being available since 2010. For finance teams, that points to an adoption problem involving workflow redesign, standards alignment and trust, not a shortage of software. The Commission's findings support starting with a controlled pilot and tracing data from source to submission.
Use a four-week validation cycle:
Week one, parallel run: Produce the automated report alongside the manual version and log every variance above the agreed investigation threshold.
Week two, reconciliation: Have the CFO, finance lead or external accountant review the causes and sign off reconciled totals.
Week three, silent rollout: Publish the dashboard to users, but don't make it the formal basis for decisions until the review group is comfortable.
Week four, controlled cutover: Retire the old report, activate alerts and document the support process.
The trust protocol belongs inside the build. Add source-system timestamps to figures, a data-lineage note to each report tab, a reconciliation footer comparing automated totals with the general ledger and a named owner for every dashboard.
Train people for their actual roles
Executives consume the report and make decisions. Managers investigate the underlying movement. Finance maintains the data, calculations and controls. Train those groups separately because they need different skills.
Give sceptical users a one-page guide titled “How to question a number”. It should explain where to check the source, how to identify a stale refresh, who owns the calculation and how to record an adjustment. A clear challenge path builds more trust than telling people that the new dashboard is accurate.
If two consecutive weekly reports fail reconciliation, revert to the manual process, identify the root cause and retry only after the control has been fixed.
Quick Wins, Common Pitfalls and Your 30-60-90 Plan
You don't need a full warehouse rebuild to improve reporting. Start with work that removes repeated handling while preserving review points.
Three useful first moves
Automate the bank reconciliation pack: Standardise the source extracts, unresolved-item list, reconciliation status and review sign-off.
Create a one-page weekly cash snapshot: Show actual cash, expected receipts, committed payments and the decisions that need attention.
Standardise chart-of-accounts tags: Agree how teams classify customers, jobs, products, direct costs and overheads so reports remain comparable.
The common failure is treating the BI tool as the strategy. Australian organisations are already using automation widely, but the coverage of individual finance processes remains uneven. In the 2025 Robert Half Australian finance survey, 89% of employers used AI and 95% used automation in some capacity, while financial reporting automation was used by 59%, AP and invoice processing by 56%, AR and cash application by 53%, and tax compliance by 54%. The same survey reported planned adoption of 33% for treasury and cash management and 33% for tax reporting. Robert Half's survey shows why a finance stack should be prioritised task by task rather than automated indiscriminately.
A practical 30-60-90 plan
Days 1 to 30: Lock report objectives, list audiences, audit every source, classify ownership and choose two pilot reports.
Days 31 to 60: Build the staging and reporting model, connect the selected systems, create the dashboards and run parallel reporting.
Days 61 to 90: Retire approved manual versions, activate exception alerts, formalise ownership and schedule a monthly dashboard review.
The wider adoption picture reinforces the need for discipline. KPMG reported that 75% of Australian companies were using or piloting AI in financial reporting, with 9% using generative AI, and 52% expecting generative AI to be their top financial-reporting technology priority by 2027. KPMG's Australian reporting research describes a market moving quickly, but adoption alone doesn't prove that a particular workflow is controlled.
Don't automate accrual judgement, unusual revenue recognition, inter-company eliminations or the final explanation of a material variance because a platform can process them. Reporting automation is a finance-operations redesign, not a software purchase, and the close-out phase is where teams most often stop investing too early.
Nexist helps Australian SMEs build recurring management packs, cash-flow reporting and KPI review workflows that connect finance data with practical decisions. If you want to replace fragile spreadsheet reporting with an owned, maintainable finance operating rhythm, visit Nexist to start the conversation.
reporting automation, automated reporting, SME finance, KPI dashboards, virtual CFO

" width="24px"/><g d="M 0 24.129 L 0 0.129 L 24 0.129 L 24 24.129 Z M 0 24.129 L 0 0.129 L 24 0.129 L 24 24.129 Z M 24 3 C 24 1.344 22.656 0 21 0 L 3 0 C 1.344 0 0 1.344 0 3 L 0 21 C 0 22.656 1.344 24 3 24 L 21 24 C 22.656 24 24 22.656 24 21 Z M 6.883 8.375 L 2.863 8.375 L 2.863 20.467 L 6.883 20.467 Z M 4.899 2.545 C 3.524 2.545 2.625 3.449 2.625 4.634 C 2.625 5.795 3.496 6.724 4.846 6.724 L 4.872 6.724 C 6.273 6.724 7.146 5.795 7.146 4.634 C 7.12 3.449 6.274 2.545 4.899 2.545 Z M 16.747 8.09 C 14.614 8.09 13.659 9.263 13.124 10.086 L 13.124 8.374 L 9.105 8.374 C 9.159 9.508 9.105 20.466 9.105 20.466 L 13.124 20.466 L 13.124 13.713 C 13.124 13.352 13.15 12.99 13.257 12.732 C 13.547 12.01 14.209 11.262 15.319 11.262 C 16.773 11.262 17.355 12.372 17.355 13.996 L 17.355 20.466 L 21.374 20.466 L 21.374 13.532 C 21.374 9.818 19.391 8.09 16.747 8.09 Z" fill="transparent" height="24.12890599668026px" id="dSFdkJotL" width="24px"><path d="M 0 24 L 0 0 L 24 0 L 24 24 Z" fill="transparent" height="24px" id="wscNJE44G" transform="translate(0 0.129)" width="24px"/><g d="M 0 24.129 L 0 0.129 L 24 0.129 L 24 24.129 Z M 24 3 C 24 1.344 22.656 0 21 0 L 3 0 C 1.344 0 0 1.344 0 3 L 0 21 C 0 22.656 1.344 24 3 24 L 21 24 C 22.656 24 24 22.656 24 21 Z M 6.883 8.375 L 2.863 8.375 L 2.863 20.467 L 6.883 20.467 Z M 4.899 2.545 C 3.524 2.545 2.625 3.449 2.625 4.634 C 2.625 5.795 3.496 6.724 4.846 6.724 L 4.872 6.724 C 6.273 6.724 7.146 5.795 7.146 4.634 C 7.12 3.449 6.274 2.545 4.899 2.545 Z M 16.747 8.09 C 14.614 8.09 13.659 9.263 13.124 10.086 L 13.124 8.374 L 9.105 8.374 C 9.159 9.508 9.105 20.466 9.105 20.466 L 13.124 20.466 L 13.124 13.713 C 13.124 13.352 13.15 12.99 13.257 12.732 C 13.547 12.01 14.209 11.262 15.319 11.262 C 16.773 11.262 17.355 12.372 17.355 13.996 L 17.355 20.466 L 21.374 20.466 L 21.374 13.532 C 21.374 9.818 19.391 8.09 16.747 8.09 Z" fill="transparent" height="24.12890599668026px" id="sTpjGo1tb" width="24px"><path d="M 0 24 L 0 0 L 24 0 L 24 24 Z" fill="transparent" height="24px" id="s7ffpmKOD" transform="translate(0 0.129)" width="24px"/><g d="M 24 3 C 24 1.344 22.656 0 21 0 L 3 0 C 1.344 0 0 1.344 0 3 L 0 21 C 0 22.656 1.344 24 3 24 L 21 24 C 22.656 24 24 22.656 24 21 Z M 6.883 8.375 L 2.863 8.375 L 2.863 20.467 L 6.883 20.467 Z M 4.899 2.545 C 3.524 2.545 2.625 3.449 2.625 4.634 C 2.625 5.795 3.496 6.724 4.846 6.724 L 4.872 6.724 C 6.273 6.724 7.146 5.795 7.146 4.634 C 7.12 3.449 6.274 2.545 4.899 2.545 Z M 16.747 8.09 C 14.614 8.09 13.659 9.263 13.124 10.086 L 13.124 8.374 L 9.105 8.374 C 9.159 9.508 9.105 20.466 9.105 20.466 L 13.124 20.466 L 13.124 13.713 C 13.124 13.352 13.15 12.99 13.257 12.732 C 13.547 12.01 14.209 11.262 15.319 11.262 C 16.773 11.262 17.355 12.372 17.355 13.996 L 17.355 20.466 L 21.374 20.466 L 21.374 13.532 C 21.374 9.818 19.391 8.09 16.747 8.09 Z" fill="transparent" height="24.000006px" id="D0ecaHEcW" transform="translate(0 0)" width="24px"><path d="M 24 3 C 24 1.344 22.656 0 21 0 L 3 0 C 1.344 0 0 1.344 0 3 L 0 21 C 0 22.656 1.344 24 3 24 L 21 24 C 22.656 24 24 22.656 24 21 Z" fill="rgb(55, 184, 218)" height="24.000006px" id="IPLFE6zXx" width="24px"/><path d="M 4.02 0 L 0 0 L 0 12.092 L 4.02 12.092 Z" fill="rgb(255, 255, 255)" height="12.09201px" id="FWhtzAyuY" transform="translate(2.863 8.375)" width="4.02px"/><path d="M 2.274 0 C 0.899 0 0 0.904 0 2.089 C 0 3.25 0.871 4.179 2.221 4.179 L 2.247 4.179 C 3.648 4.179 4.521 3.25 4.521 2.089 C 4.495 0.904 3.649 0 2.274 0 Z" fill="rgb(255, 255, 255)" height="4.17876px" id="VmOsKv4kO" transform="translate(2.625 2.545)" width="4.52095px"/><path d="M 7.641 0 C 5.509 0 4.554 1.173 4.019 1.996 L 4.019 0.284 L 0 0.284 C 0.053 1.419 0 12.376 0 12.376 L 4.019 12.376 L 4.019 5.623 C 4.019 5.262 4.045 4.9 4.151 4.642 C 4.442 3.92 5.103 3.172 6.214 3.172 C 7.667 3.172 8.25 4.282 8.25 5.907 L 8.25 12.376 L 12.269 12.376 L 12.269 5.442 C 12.269 1.728 10.286 0 7.641 0 Z" fill="rgb(255, 255, 255)" height="12.37626px" id="n1XUbhaq0" transform="translate(9.105 8.09)" width="12.268830000000001px"/></g></g></g></g></svg>)