Growth Accounting for Australian SMEs Explained
Learn how growth accounting helps Australian SMEs diagnose profit drivers, fix cash leaks, and turn financial data into strategic decisions with a virtual CFO.
Ansh Malhotra

Australia's economy grew 1.4% in 2024–25, yet labour productivity fell 0.7%, according to the Australian Bureau of Statistics national accounts release. For a founder, that divergence carries a practical warning: revenue and activity can rise while each hour of work produces less value.
That's the problem growth accounting helps expose. It separates growth created by more labour, more capital, and better use of both, so you can see whether the business is becoming more productive or becoming larger and more expensive to run.
Table of Contents
Why Growth Accounting Matters for Australian Founders
Founders often read growth through visible activity. The team has expanded, a warehouse has been fitted out, sales are up, and the monthly P&L shows a profit. Those signals feel positive, but they don't answer the question that matters most: did output increase faster than the resources required to produce it?
The ABS defines multifactor productivity as real output per combined unit of labour and capital. Its methodology derives productivity indexes from chain-volume market-sector GDP divided by combined labour and capital services, giving Australian businesses a formal way to distinguish input growth from efficiency growth. The ABS productivity methodology also explains that industry-level KLEMS multifactor productivity covers the market-sector industries, incorporating inputs such as energy, materials, and services in detailed analysis.
An SME doesn't need a government statistical model to use the underlying logic. A virtual CFO can apply the same diagnostic to revenue, gross margin, labour hours, equipment, inventory, software, and workflow data.
Macro Indicator, ABS Data | SME Symptom | Hidden Cost to Founders |
|---|---|---|
Economy grew 1.4%, while labour productivity fell 0.7% in 2024–25, as reported by the ABS. | Sales rise, but more hours are needed to deliver each order or project. | Margin narrows despite top-line growth. |
MFP measures output not explained by labour and capital inputs, as defined by the ABS. | New people and tools don't produce the expected operating lift. | Cash is committed to overhead without a matching return. |
Australia's MFP fell 0.5% in 2024–25, according to the Productivity Commission. | Growth depends on adding resources rather than improving the system. | The business becomes harder to scale and less attractive to buyers. |
The silent damage usually starts before the cash-flow crisis. Overtime increases, managers absorb coordination work, stock sits longer, and software subscriptions accumulate without changing throughput. Each cost may look reasonable on its own. Together, they create a business that needs more input to produce the same commercial result.
Founders also need to separate employment structure from productivity diagnosis. Questions about whether a worker is engaged through a direct employment model, co-employment arrangement, or employer-of-record provider can affect administration and responsibility. A practical overview of co-employment vs employer of record can help clarify that distinction, but neither structure replaces measuring output per labour input.
Practical rule: Don't approve the next hire, asset purchase, or software rollout until you can state which input it changes and which output should improve.
Growth accounting gives you that discipline. It reveals whether the business is adding capacity, improving efficiency, or paying more to stand still.
How Growth Accounting Differs from Traditional Accounting
Traditional accounting records what happened. It captures sales, wages, rent, depreciation, interest, tax, assets, liabilities, and cash movements so the business can meet compliance requirements and assess historical performance. That work remains essential, but it rarely explains why an apparently healthy result emerged or whether it can be repeated.
Growth accounting asks a different question. It decomposes output growth into the contribution from labour input, capital input, and multifactor productivity. The ABS describes the framework as output growth separated into capital and labour contributions, plus an MFP residual, with each input contribution weighted by its share of value added. The ABS growth-accounting framework sets out that structure formally.
Dimension | Traditional Compliance Accounting | Growth Accounting |
|---|---|---|
Primary question | What profit, tax position, and balance-sheet position did the business report? | What drove the change in output and productivity? |
Main inputs | Revenue, expenses, assets, liabilities, and cash. | Labour services, capital services, output, and the MFP residual. |
Time perspective | Historical reporting period. | Change across comparable periods. |
Decision enabled | Lodge, report, reconcile, and monitor financial control. | Hire, invest, redesign, price, automate, or stop. |
Main limitation | A variance may show movement without identifying the operating cause. | Results depend on clean operational definitions and consistent data. |
A P&L can show that profit improved because revenue rose faster than expenses. A growth-accounting review goes further. It tests whether the lift came from extra staff, higher use of equipment, better pricing, fewer errors, faster fulfilment, or a temporary surge that required disproportionate effort.
That distinction matters because standard variance analysis often treats labour as a cost line rather than a productive input. A warehouse may report higher wages and higher revenue at the same time. Without order volume, labour hours, pick-pack time, and contribution margin, the founder can't tell whether the new team created capacity or compensated for an inefficient layout.
Management accounting sits between compliance reporting and strategic control. A useful guide to management accounting for Australian businesses provides context for using financial information in planning and decision-making. Growth accounting adds a specific lens, it ties those decisions to the relationship between inputs and output.
The two systems should work together. Your bookkeeper or accountant keeps the ledger accurate. Your virtual CFO converts that ledger, operational data, and commercial context into decisions about the next dollar of labour or capital.
The Three Pillars of the Growth Accounting Framework
The framework has three practical pillars: labour contribution, capital contribution, and multifactor productivity. The first two measure the resources a business applies. The third captures the change in output that those measured inputs don't explain.
Consider an Australian ecommerce brand expanding its warehouse operation. Orders are rising, so the founder adds pick-and-pack staff, leases additional equipment, and installs warehouse management software.
Labour contribution
Labour contribution reflects the output associated with changes in labour input. At SME level, that means looking beyond headcount. The useful measures include hours worked, productive hours, skill mix, overtime, absenteeism, and the revenue or gross margin generated by those hours.
Hiring more people can increase fulfilment capacity. It can also create more supervision, handovers, training, and scheduling complexity. If hours rise faster than orders or gross margin, the business is buying activity rather than productivity.
Capital contribution
Capital contribution captures the productive role of assets and technology. In the warehouse example, conveyor systems, scanners, racking, forklifts, and warehouse management software may all increase capacity. The investment only earns its place when the business uses those assets effectively and produces more valuable output as a result.
A virtual CFO tests utilisation, throughput, downtime, maintenance, lease costs, and the timing of the investment. An expensive system that staff bypass because the workflow is poorly designed isn't delivering its intended capital contribution.
Multifactor productivity
MFP is the residual. The ABS defines it as output growth minus combined-input growth, and its framework treats it as the part of performance not explained by measured labour and capital inputs. In a business, that residual can reflect layout redesign, better management, improved skills, fewer defects, stronger scheduling, clearer processes, or unmeasured friction.
Suppose the ecommerce brand's revenue rises 18%, while labour hours rise 22% and capital spending rises 15%. Those figures are supplied as a teaching example, not Australian official data. The message is straightforward: top-line growth hasn't proved efficient scaling. The founder needs to investigate whether each additional hour and asset is producing enough incremental output.
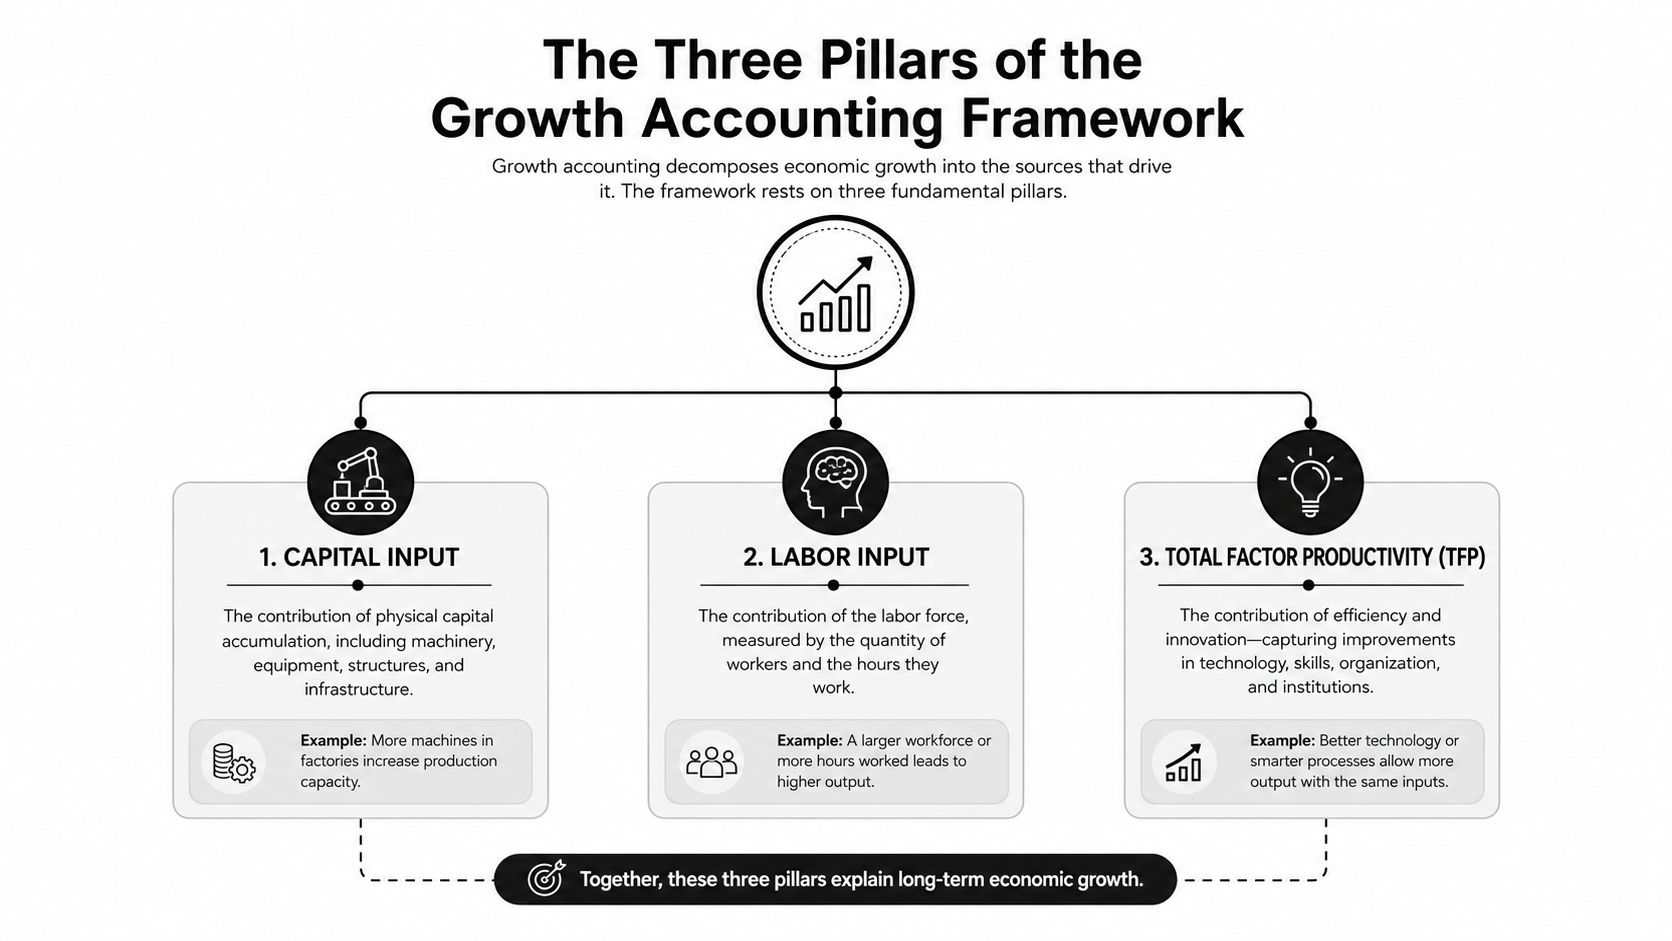
MFP is often the most actionable pillar because founders can influence it directly through process design, pricing discipline, training, system adoption, and operating cadence. It isn't a magic efficiency score. It's a prompt to find the operational change that allows the existing labour and capital base to produce more.
Core Metrics and KPIs That Drive Growth Decisions
Growth accounting becomes useful when every metric leads to a decision. A dashboard full of ratios can create the appearance of control while leaving the founder unsure what to change next.
For labour, start with revenue per full-time equivalent, labour cost as a share of gross margin, and overtime leakage. These measures reveal whether headcount is growing ahead of productive output. If revenue per employee falls while overtime rises, the answer may be a workflow redesign or pricing correction, not another hire.
Capital requires a different view. Inventory turnover days, fixed-asset utilisation, and the working-capital cycle show whether money is producing output or sitting idle. A retailer with slow-moving stock may report sales growth while cash remains trapped in inventory. A service firm may own productive equipment but use it inconsistently, leaving depreciation and finance costs to absorb margin.
Pillar | KPI | What It Reveals | Decision Trigger |
|---|---|---|---|
Labour | Revenue per full-time equivalent | Whether staffing growth is keeping pace with output. | Review hiring, role design, pricing, or workload allocation. |
Labour | Labour cost as a percentage of gross margin | Whether labour is consuming an expanding share of contribution. | Freeze recruitment, change rosters, or improve job pricing. |
Capital | Inventory turnover days | Whether stock is converting into sales efficiently. | Reduce purchasing, clear aged stock, or renegotiate supplier terms. |
Capital | Fixed-asset utilisation | Whether equipment or facilities are generating sufficient output. | Improve scheduling, consolidate capacity, or delay replacement. |
MFP | Process cycle time | Whether workflow changes are reducing friction. | Map the process, remove handovers, or automate repetitive work. |
MFP | Gross margin per square metre | Whether physical space is earning its keep. | Reconfigure the site, change the product mix, or review pricing. |
The MFP layer connects operational measures such as process cycle time, gross margin per square metre, and customer acquisition cost relative to lifetime value. These metrics combine several inputs, which makes them useful for detecting system-level problems. A longer cycle time may involve labour scheduling, software adoption, layout, approvals, or supplier delays.
Forecasting also matters because the next decision depends on expected output, not just historical performance. Founders comparing forecasting approaches should choose a method that matches their data quality, seasonality, and planning horizon rather than treating a forecast as an automatic answer.
A business scorecard turns the dashboard into a management rhythm. A practical business scorecard framework can help connect financial results with the operating indicators that explain them. Review the numbers often enough to act, but don't change definitions every period. Consistent measurement matters more than decorative complexity.
Real Australian SME Case Examples
The most useful growth-accounting discussions start with a leak, not a theory. The following examples are illustrative practitioner scenarios, designed to show the diagnostic sequence without presenting invented results as verified Australian case data.
A Melbourne ecommerce brand had grown its warehouse team while order volume failed to keep pace. The P&L still looked healthy because sales were increasing and gross margin remained positive. The founder initially blamed wage rates, but the operating data pointed elsewhere.
The virtual CFO compared orders, productive hours, overtime, error corrections, and pick-pack cycle time before and after a warehouse move. The move had lengthened walking routes and created extra handovers between picking and packing. Staff were working harder, but the process was producing less output per hour.
The recommended response wasn't an immediate headcount reduction. The team mapped the warehouse flow, tested slotting changes, clarified replenishment responsibilities, and assessed targeted automation. The founder then judged any equipment purchase against expected cycle-time improvement, labour-hour reduction, and service reliability. That sequence matters because automation can lock in a poor process if the underlying workflow hasn't been examined.
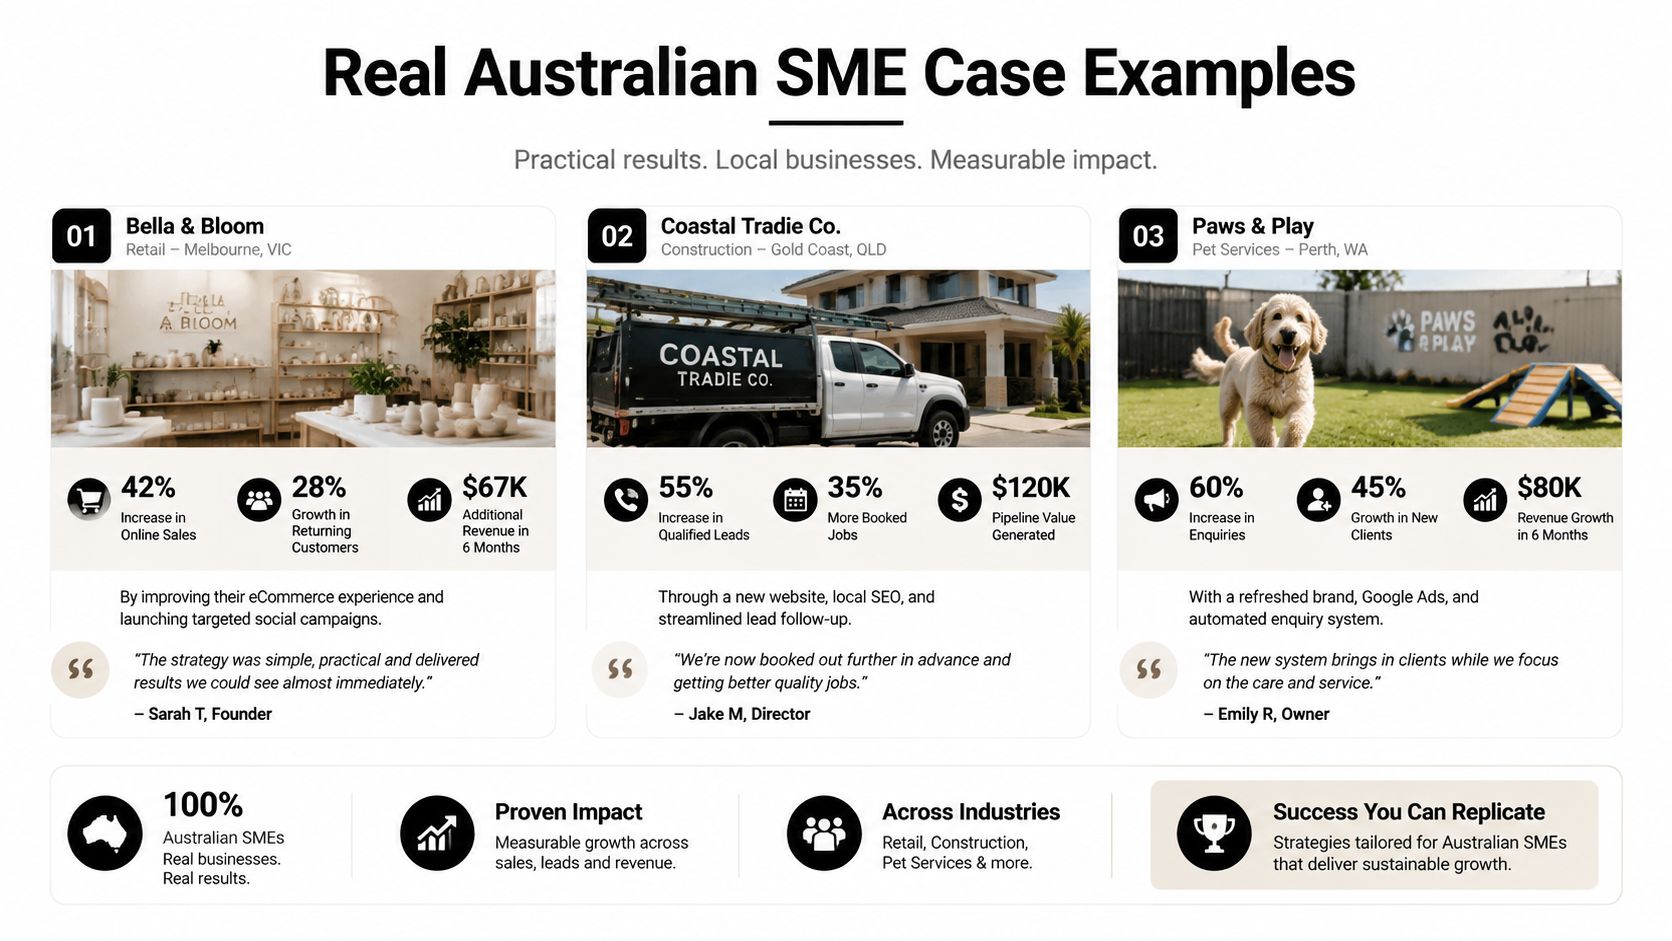
A Brisbane professional services firm faced a different constraint. The business kept hiring because its utilisation report appeared acceptable, yet cash conversion remained uncomfortable. A growth-accounting review separated billable labour from total labour, examined fixed-fee scope changes, and traced receivables by client and milestone.
The issue wasn't just low utilisation. Consultants were spending unbilled time absorbing scope creep, while invoices were issued later than the work deserved. The firm renegotiated selected client arrangements, tightened change-control language, and linked billing to completed milestones. Its capital wasn't warehouse stock. It was cash tied up in work already performed but not collected.
These examples share a repeatable sequence:
Measure the inputs: Capture hours, assets, stock, systems, and working capital consistently.
Define the output: Use orders, gross margin, completed projects, collected cash, or another commercially meaningful result.
Decompose the movement: Identify what came from labour, capital, and the combined efficiency of the operating system.
Act on the constraint: Choose the smallest operational intervention that can change the weak pillar.
Recheck the result: Keep the same definitions so the next review distinguishes improvement from noise.
The point isn't to copy another business's intervention. It's to locate the specific input that has grown faster than the value it produces.
Implementing Growth Accounting with a Virtual CFO
Most founders shouldn't build a detailed growth-accounting model alone. The work requires consistent financial data, operational definitions, and enough distance from day-to-day firefighting to challenge the assumptions behind the numbers.
A practical implementation begins with a data audit.
Establish the baseline
Bring the P&L, balance sheet, payroll, sales data, inventory records, timesheets, project reports, and asset register into one reporting view. Then agree on definitions. “Revenue per employee” is meaningless if one period includes contractors, another includes owners, and a third counts unpaid overtime differently.
Use the opening phase to answer:
What is output? Revenue may be appropriate for one business, while gross margin, completed jobs, orders, or collected cash may be better for another.
Which labour input counts? Separate paid hours, productive hours, overtime, contractors, and management time where the data supports it.
Which capital is active? Include equipment, technology, facilities, and working capital only when the measurement reflects how they support production.
What data is trusted? Identify missing fields, duplicated records, inconsistent dates, and manual adjustments before interpreting performance.
Decompose the constraint
Once the baseline is stable, hold a decomposition workshop with the founder and operational leaders. Look for the pillar that explains the weakest commercial outcome, then select no more than a small number of levers for the next action cycle.
A useful review asks whether the business should change its pricing, roster, purchasing rules, system configuration, warehouse layout, project scope controls, or collection process. The virtual CFO should translate each decision into an owner, a measure, and a review date.
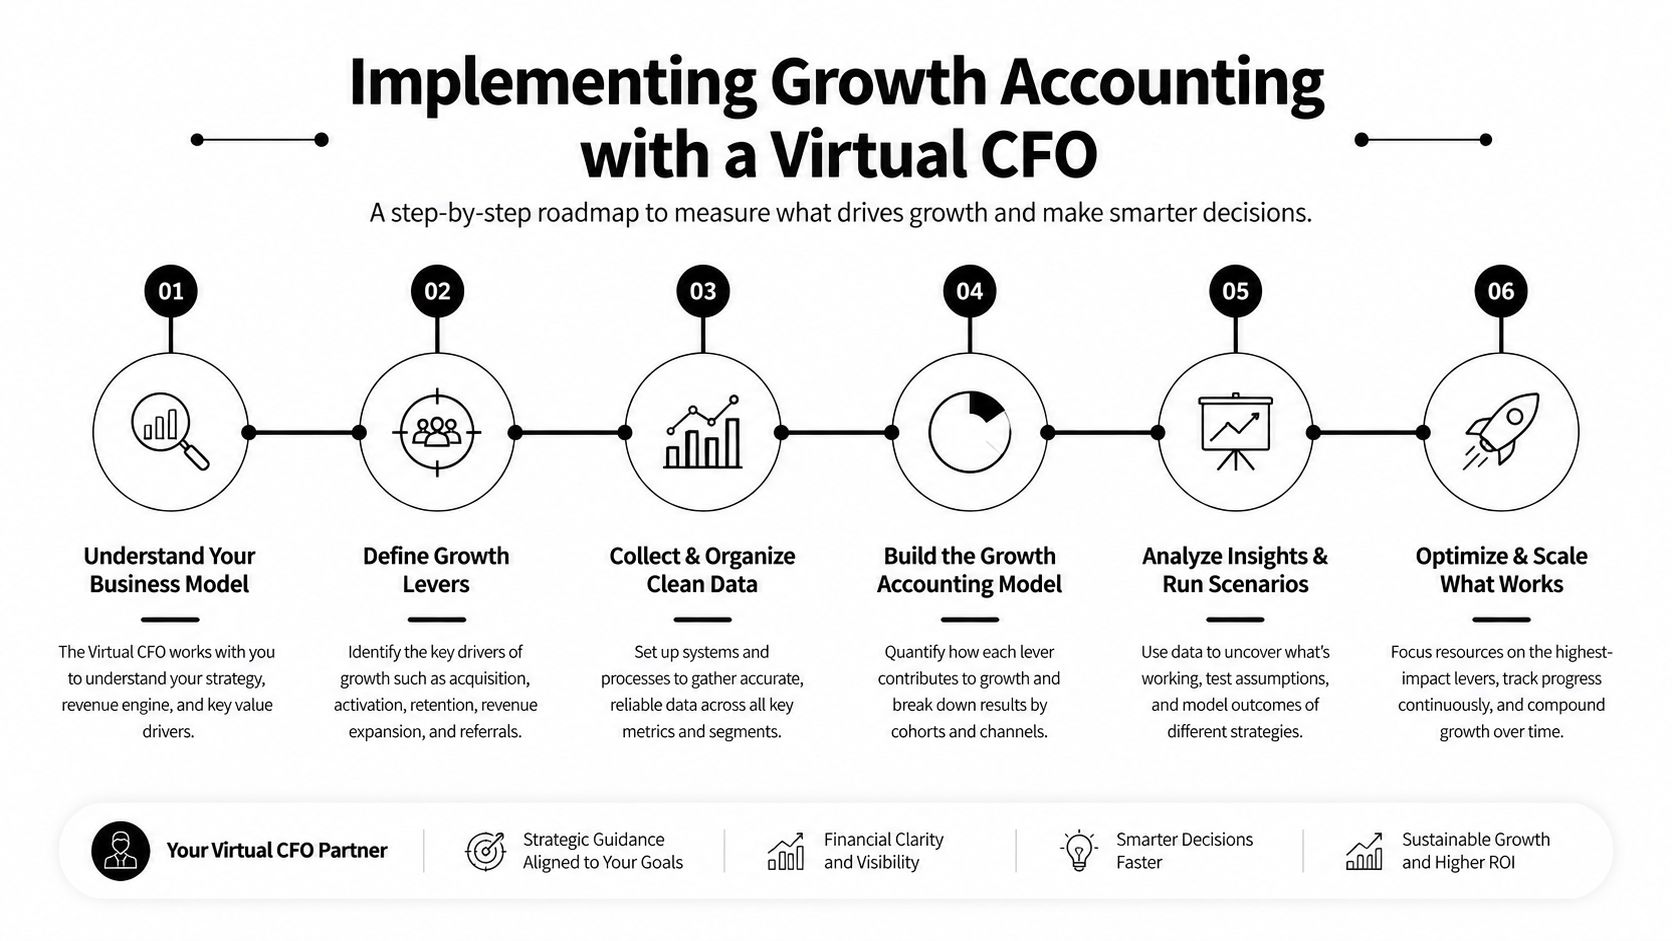
Run the action cadence
Treat implementation as an operating system, not a one-off report. Review the scorecard monthly, investigate material changes, and conduct a deeper quarterly review of assumptions, input mix, pricing, capacity, and cash conversion.
A fractional CFO can provide this capability without requiring a full-time executive hire. Founders assessing external support can review HireAccountants fractional CFO services as one example of the type of finance leadership available through a fractional model. The right provider should connect reporting to decisions, not merely deliver another spreadsheet.
For a broader explanation of the role, see what a virtual chief financial officer does. The essential test is practical: after each review, does the founder know which lever to pull, who owns it, and how the next result will be measured?
Turning Financial Data into Strategic Action
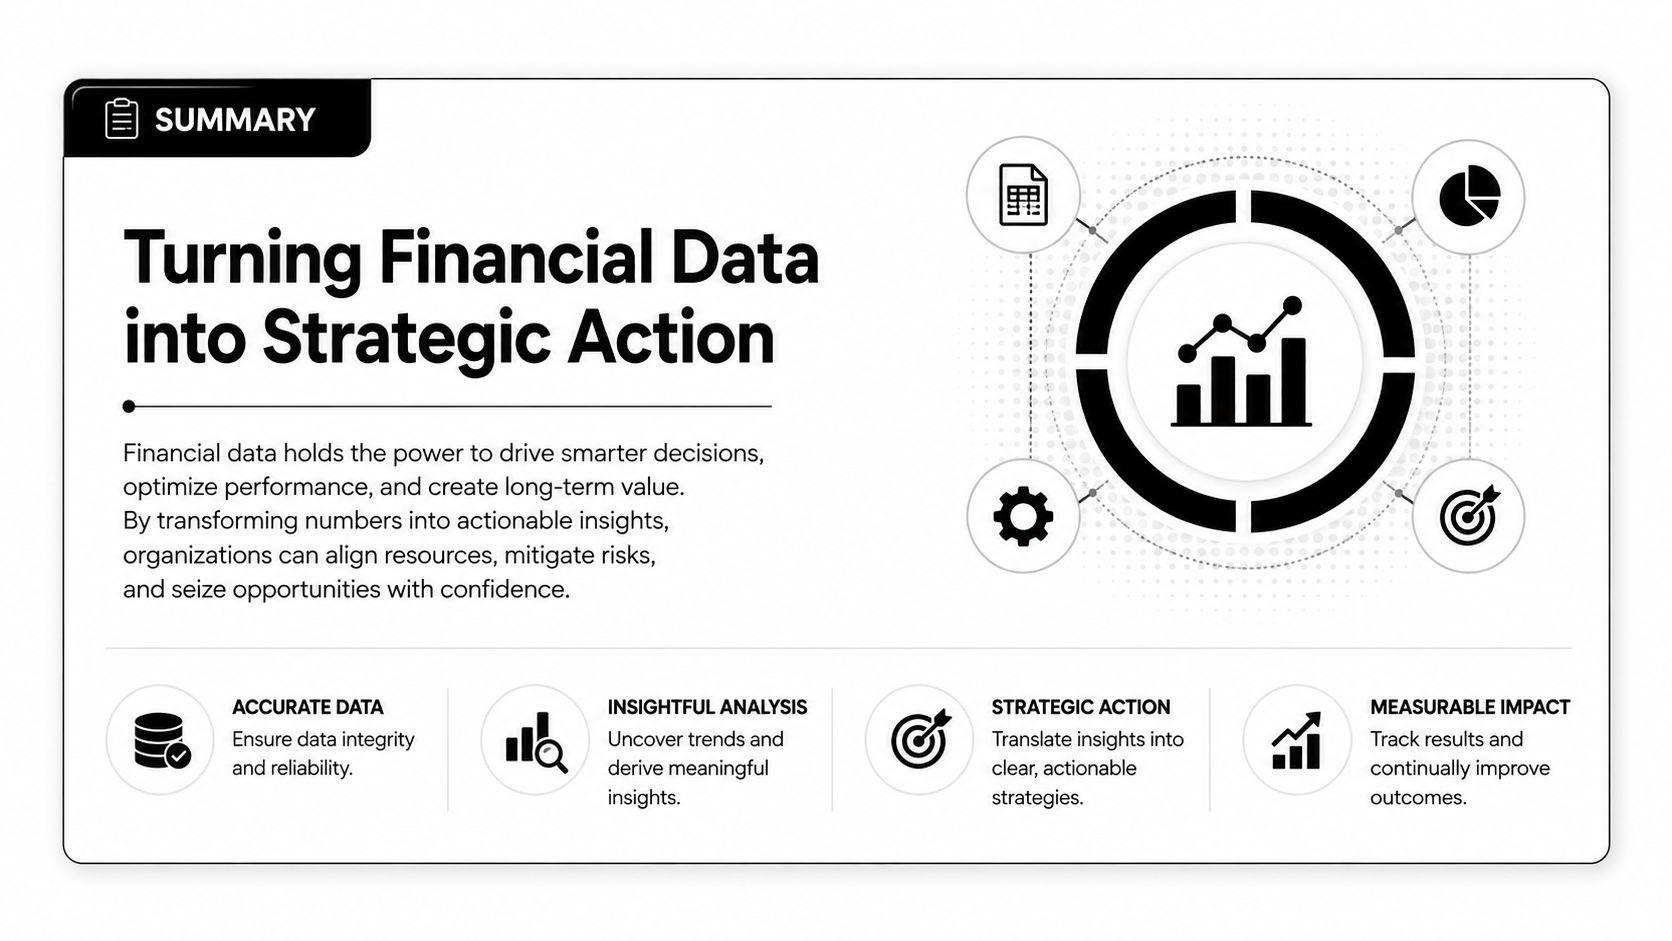
Growth accounting is the missing link between bookkeeping and strategy. Most established SMEs have financial records, but clean records don't automatically tell the owner whether the next dollar of revenue will strengthen margin or create more work, stock, debt, and management overhead.
The framework changes the conversation. Labour costs become a question about productive capacity and output per hour. Equipment and software become questions about utilisation and throughput. The residual, MFP, becomes an investigation into process quality, pricing, skills, coordination, and the decisions that allow the whole system to perform better.
The Productivity Commission's recent Australian data reinforces the need for that diagnosis. Its 2026 productivity bulletin reported that MFP fell 0.5% in 2024–25, below the 0.4% 20-year average and below the 1.6% average annual increase recorded from 1994–95 to 2003–04. The same source reports that MFP grew 0.1% in 2023–24, which illustrates how a weak residual can persist even when businesses continue adding resources.
Don't wait for a cash-flow crisis to ask why growth feels harder than it should. Pull the last four quarters of financial and operating data, define your output, classify the main labour and capital inputs, and run a three-pillar review before your next planning meeting. Then choose one constraint to address, rather than launching another unfocused cost-cutting programme.
The founders who win in tight Australian markets aren't always the ones with the biggest top line. They're the ones who know exactly which lever to pull when growth stalls.
Nexist helps Australian founders connect bookkeeping, cash-flow forecasting, KPI reporting, inventory, process improvement, and virtual CFO support through one finance-led operating system. Book a diagnostic conversation through Nexist and bring your recent financial and operating data so the first review can identify where labour, capital, or process inefficiency is trapping profit.
growth accounting, virtual CFO, SME finance, cash flow, productivity metrics

" width="24px"/><g d="M 0 24.129 L 0 0.129 L 24 0.129 L 24 24.129 Z M 0 24.129 L 0 0.129 L 24 0.129 L 24 24.129 Z M 24 3 C 24 1.344 22.656 0 21 0 L 3 0 C 1.344 0 0 1.344 0 3 L 0 21 C 0 22.656 1.344 24 3 24 L 21 24 C 22.656 24 24 22.656 24 21 Z M 6.883 8.375 L 2.863 8.375 L 2.863 20.467 L 6.883 20.467 Z M 4.899 2.545 C 3.524 2.545 2.625 3.449 2.625 4.634 C 2.625 5.795 3.496 6.724 4.846 6.724 L 4.872 6.724 C 6.273 6.724 7.146 5.795 7.146 4.634 C 7.12 3.449 6.274 2.545 4.899 2.545 Z M 16.747 8.09 C 14.614 8.09 13.659 9.263 13.124 10.086 L 13.124 8.374 L 9.105 8.374 C 9.159 9.508 9.105 20.466 9.105 20.466 L 13.124 20.466 L 13.124 13.713 C 13.124 13.352 13.15 12.99 13.257 12.732 C 13.547 12.01 14.209 11.262 15.319 11.262 C 16.773 11.262 17.355 12.372 17.355 13.996 L 17.355 20.466 L 21.374 20.466 L 21.374 13.532 C 21.374 9.818 19.391 8.09 16.747 8.09 Z" fill="transparent" height="24.12890599668026px" id="dSFdkJotL" width="24px"><path d="M 0 24 L 0 0 L 24 0 L 24 24 Z" fill="transparent" height="24px" id="wscNJE44G" transform="translate(0 0.129)" width="24px"/><g d="M 0 24.129 L 0 0.129 L 24 0.129 L 24 24.129 Z M 24 3 C 24 1.344 22.656 0 21 0 L 3 0 C 1.344 0 0 1.344 0 3 L 0 21 C 0 22.656 1.344 24 3 24 L 21 24 C 22.656 24 24 22.656 24 21 Z M 6.883 8.375 L 2.863 8.375 L 2.863 20.467 L 6.883 20.467 Z M 4.899 2.545 C 3.524 2.545 2.625 3.449 2.625 4.634 C 2.625 5.795 3.496 6.724 4.846 6.724 L 4.872 6.724 C 6.273 6.724 7.146 5.795 7.146 4.634 C 7.12 3.449 6.274 2.545 4.899 2.545 Z M 16.747 8.09 C 14.614 8.09 13.659 9.263 13.124 10.086 L 13.124 8.374 L 9.105 8.374 C 9.159 9.508 9.105 20.466 9.105 20.466 L 13.124 20.466 L 13.124 13.713 C 13.124 13.352 13.15 12.99 13.257 12.732 C 13.547 12.01 14.209 11.262 15.319 11.262 C 16.773 11.262 17.355 12.372 17.355 13.996 L 17.355 20.466 L 21.374 20.466 L 21.374 13.532 C 21.374 9.818 19.391 8.09 16.747 8.09 Z" fill="transparent" height="24.12890599668026px" id="sTpjGo1tb" width="24px"><path d="M 0 24 L 0 0 L 24 0 L 24 24 Z" fill="transparent" height="24px" id="s7ffpmKOD" transform="translate(0 0.129)" width="24px"/><g d="M 24 3 C 24 1.344 22.656 0 21 0 L 3 0 C 1.344 0 0 1.344 0 3 L 0 21 C 0 22.656 1.344 24 3 24 L 21 24 C 22.656 24 24 22.656 24 21 Z M 6.883 8.375 L 2.863 8.375 L 2.863 20.467 L 6.883 20.467 Z M 4.899 2.545 C 3.524 2.545 2.625 3.449 2.625 4.634 C 2.625 5.795 3.496 6.724 4.846 6.724 L 4.872 6.724 C 6.273 6.724 7.146 5.795 7.146 4.634 C 7.12 3.449 6.274 2.545 4.899 2.545 Z M 16.747 8.09 C 14.614 8.09 13.659 9.263 13.124 10.086 L 13.124 8.374 L 9.105 8.374 C 9.159 9.508 9.105 20.466 9.105 20.466 L 13.124 20.466 L 13.124 13.713 C 13.124 13.352 13.15 12.99 13.257 12.732 C 13.547 12.01 14.209 11.262 15.319 11.262 C 16.773 11.262 17.355 12.372 17.355 13.996 L 17.355 20.466 L 21.374 20.466 L 21.374 13.532 C 21.374 9.818 19.391 8.09 16.747 8.09 Z" fill="transparent" height="24.000006px" id="D0ecaHEcW" transform="translate(0 0)" width="24px"><path d="M 24 3 C 24 1.344 22.656 0 21 0 L 3 0 C 1.344 0 0 1.344 0 3 L 0 21 C 0 22.656 1.344 24 3 24 L 21 24 C 22.656 24 24 22.656 24 21 Z" fill="rgb(55, 184, 218)" height="24.000006px" id="IPLFE6zXx" width="24px"/><path d="M 4.02 0 L 0 0 L 0 12.092 L 4.02 12.092 Z" fill="rgb(255, 255, 255)" height="12.09201px" id="FWhtzAyuY" transform="translate(2.863 8.375)" width="4.02px"/><path d="M 2.274 0 C 0.899 0 0 0.904 0 2.089 C 0 3.25 0.871 4.179 2.221 4.179 L 2.247 4.179 C 3.648 4.179 4.521 3.25 4.521 2.089 C 4.495 0.904 3.649 0 2.274 0 Z" fill="rgb(255, 255, 255)" height="4.17876px" id="VmOsKv4kO" transform="translate(2.625 2.545)" width="4.52095px"/><path d="M 7.641 0 C 5.509 0 4.554 1.173 4.019 1.996 L 4.019 0.284 L 0 0.284 C 0.053 1.419 0 12.376 0 12.376 L 4.019 12.376 L 4.019 5.623 C 4.019 5.262 4.045 4.9 4.151 4.642 C 4.442 3.92 5.103 3.172 6.214 3.172 C 7.667 3.172 8.25 4.282 8.25 5.907 L 8.25 12.376 L 12.269 12.376 L 12.269 5.442 C 12.269 1.728 10.286 0 7.641 0 Z" fill="rgb(255, 255, 255)" height="12.37626px" id="n1XUbhaq0" transform="translate(9.105 8.09)" width="12.268830000000001px"/></g></g></g></g></svg>)