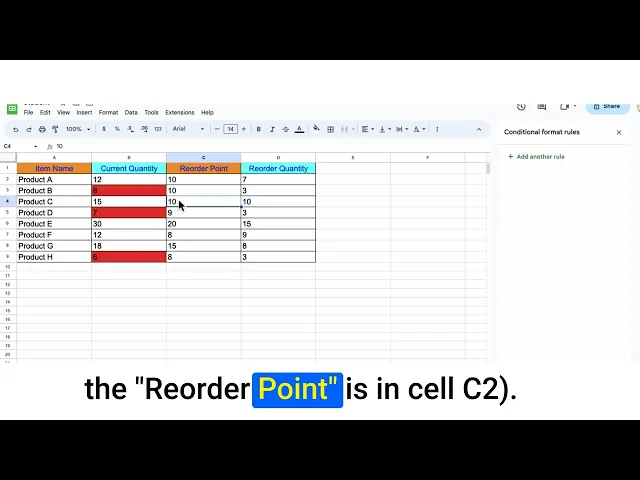
Reorder Point Calculation: A Practical Guide
Master reorder point calculation with step-by-step formulas, real examples, and Excel templates. Stop stock-related cash leaks and optimise inventory
Ansh Malhotra

An Australian ecommerce founder opens the warehouse report and finds $47,000 sitting in slow-moving stock that hasn't sold in 90 days. The problem isn't necessarily weak sales. It's usually a purchasing process built on gut feel, copied purchase orders, and optimistic supplier promises.
That stock has already consumed cash. It can't fund a campaign, product development, wages, or a supplier payment while it sits on a shelf. Reorder point calculation gives you a disciplined trigger for replenishment, so you can protect availability without treating every possible stockout as a reason to over-order.
The method below covers the formula, practical calculations for ecommerce and wholesale, and a spreadsheet tracker your team can use immediately. It also treats inventory as a finance issue, because the right reorder point protects customer service while keeping working capital moving.

Table of Contents
Why Reorder Point Calculation Matters for Your Cash Flow
Most small businesses don't deliberately choose excess inventory. The founder sees a strong sales week, orders more “just in case”, then repeats the same quantity because the last purchase order seemed to work. Another business copies last year's order, even though the product range, supplier reliability, and demand pattern have changed.
That approach creates two expensive outcomes. You either run out before the next delivery arrives, or you hold stock far beyond what customers are likely to buy. Both outcomes damage cash flow. A stockout can force emergency freight and lost sales, while overstock leaves cash trapped in products that may need discounting, bundling, or write-downs.
Australian inventory movements show why a single fixed trigger is inadequate. The Australian Bureau of Statistics explanation of inventories-to-sales measures defines private non-farm inventories-to-sales as the ratio of closing inventory book values to total sales. Its Business Indicators release reported inventories rising 0.5% in March 2026, with Mining up 5.8%, Wholesale Trade up 1.0%, and Manufacturing down 1.3%. Those sector differences reinforce the practical point. Reorder settings must reflect the product, supplier, sales cycle, and operating conditions.
Inventory is a balance-sheet decision
A reorder point answers one question: at what stock level must someone place the next order? It doesn't answer how much to buy, whether the item deserves more range space, or whether the product is commercially viable. Those decisions still require judgement.
The benefit comes from separating the decisions. You set a replenishment trigger from demand and lead-time evidence, then set order quantities using supplier minimums, cash availability, storage capacity, and expected sales. That prevents a common mistake, treating the reorder trigger and the purchase quantity as the same thing.
Cash-flow rule: Never approve a purchase order simply because stock is below a comfortable level. Approve it because the reorder point, expected demand, supplier timing, and order economics justify the cash commitment.
A clear view of warehouse movement also matters. If your receiving, put-away, picking, and dispatch processes are disorganised, the stock figure in your spreadsheet may not represent shelf-ready stock. A practical guide to distribution centre flow can help you assess the operational steps behind the numbers.
The objective isn't zero stockouts at any cost. It's reliable fulfilment with the minimum sensible capital tied up in stock. That's the standard your reorder point should support.
The Reorder Point Formula and Its Core Inputs
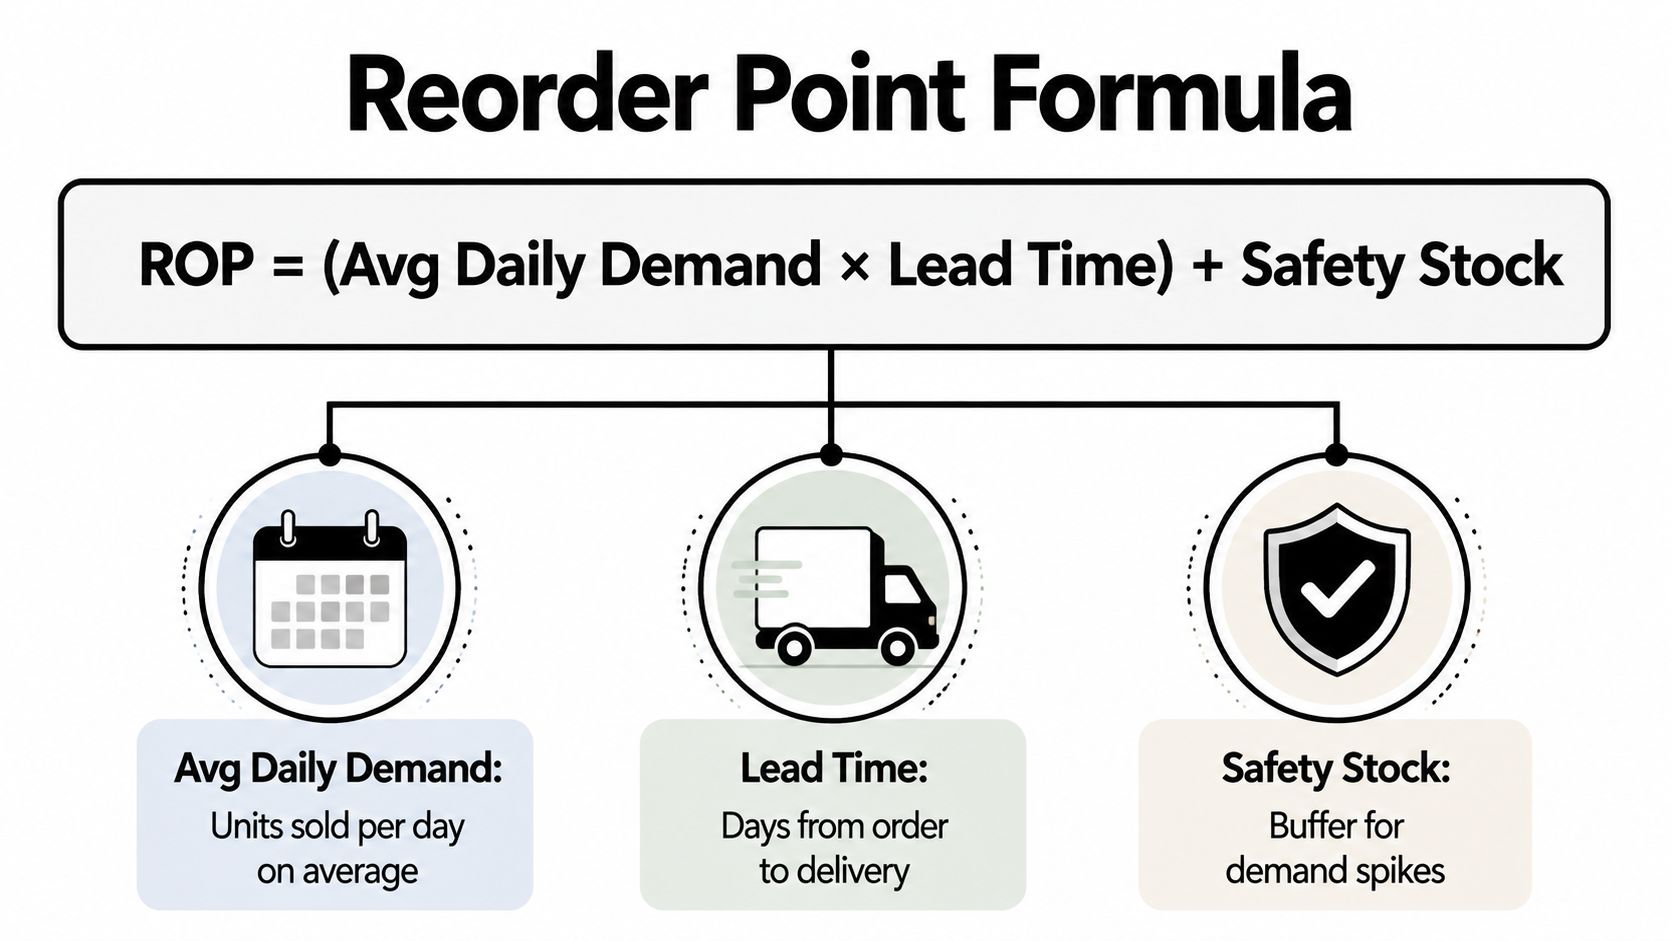
The core formula is straightforward:
ROP = (Average Daily Demand × Lead Time in Days) + Safety Stock
The formula works because it connects three operating facts. You need enough stock to cover normal demand while the supplier fulfils an order, plus a buffer for conditions that don't go to plan.
Start with average daily demand
Average daily demand is the number of units sold or consumed per day across a selected period. Calculate it by dividing total units sold by the number of days in that period.
For a practical baseline, use a rolling 30-day or 90-day average. A shorter window reflects recent movement more closely. A longer window smooths unusual spikes and dips. Neither should be accepted blindly. If a promotion, holiday period, new retail account, or product change is approaching, adjust the demand input to reflect the trading conditions you expect.
Suppose an Australian skincare brand sells 40 units per day. That is the average daily demand input, not the reorder point. It tells you how quickly stock is being consumed before lead time and risk are considered.
Measure the full supplier lead time
Lead time runs from the moment you place the purchase order until the goods are received, checked, and shelf-ready. Include supplier processing, production, transport, customs for imported stock, receiving, and any internal delay before the item can be sold.
If the skincare supplier takes 14 days, normal demand during lead time is:
40 units × 14 days = 560 units
The mistake I see most often is using the supplier's quoted lead time instead of actual elapsed time. Record order date and stock-ready date for every delivery. If the timing changes materially, your reorder point must change with it.
Add a defensible safety stock buffer
Safety stock protects against demand running higher than average or deliveries arriving later than expected. A basic formula is:
Safety Stock = (Maximum Daily Demand × Maximum Lead Time) − (Average Daily Demand × Average Lead Time)
For the skincare brand, if maximum daily demand and maximum lead time are known from its records, those values can be inserted into the formula. The resulting buffer is added to the normal lead-time requirement.
Don't set safety stock to zero just to make inventory look leaner. That removes the protection precisely when demand or supply moves away from plan. The better approach is to review the buffer by SKU, identify which products justify protection, and reduce it when the underlying variability improves.
For further practical guidance, review these reorder point calculation tips. The important discipline is to maintain the inputs rather than calculate the number once and forget it.
Worked Examples for Ecommerce and Wholesale Businesses
A formula becomes useful when a buyer can apply it without interpretation. The following examples use the same safety-stock method, but the business profiles produce very different reorder points.
Example one for an ecommerce brand
A Melbourne ecommerce business sells reusable water bottles. Its records show:
Average daily demand: 25 units
Lead time: 18 days
Maximum daily demand: 38 units
Maximum lead time: 23 days
Calculate safety stock first:
Safety Stock = (Maximum Daily Demand × Maximum Lead Time) − (Average Daily Demand × Lead Time)
Safety Stock = (38 × 23) − (25 × 18)
Safety Stock = 874 − 450 = 424 units
Now calculate the reorder point:
ROP = (25 × 18) + 424
ROP = 450 + 424 = 874 units
Operationally, the business should place a replenishment order when available stock reaches 874 units. That trigger covers the high-demand and long-lead-time combination represented in the input data. It doesn't mean the business should order 874 units every time. The purchase quantity is a separate decision based on supplier terms, expected demand, storage, and cash.
Example two for a wholesale distributor
A Sydney wholesaler supplies café products. Its inputs are:
Average daily demand: 120 units
Lead time: 7 days
Maximum daily demand: 160 units
Maximum lead time: 10 days
Safety stock:
Safety Stock = (160 × 10) − (120 × 7)
Safety Stock = 1,600 − 840 = 760 units
Reorder point:
ROP = (120 × 7) + 760
ROP = 840 + 760 = 1,600 units
The wholesale operation has a shorter stated lead time than the ecommerce example, so its normal demand-during-lead-time component is smaller relative to its sales volume. However, the higher daily throughput creates a much larger safety-stock requirement under the selected maximum conditions.
Input Variable | Ecommerce, Water Bottles | Wholesale, Café Supplies |
|---|---|---|
Average daily demand | 25 units | 120 units |
Lead time | 18 days | 7 days |
Maximum daily demand | 38 units | 160 units |
Maximum lead time | 23 days | 10 days |
Safety stock | 424 units | 760 units |
Reorder point | 874 units | 1,600 units |
The comparison shows why copying a standard percentage buffer across every SKU is poor practice. A low-volume item with a long supplier cycle can need a meaningful trigger, while a high-volume wholesale item can require substantial protection even when deliveries arrive faster.
For broader operational context, the ecommerce inventory management guide is useful when connecting reorder triggers with sales channels, fulfilment, and stock visibility.
Building Your Reorder Point Tracker in Excel or Google Sheets
A spreadsheet becomes useful when it tells someone what to do. Build one master SKU table rather than leaving reorder decisions across emails, supplier portals, and separate buyer notes.
Start with these columns:
Column | Field | Purpose |
|---|---|---|
A | SKU | Unique product identifier |
B | Item name | Human-readable product description |
C | Average daily demand | Rolling sales-based demand input |
D | Lead time in days | Observed supplier-to-shelf timing |
E | Safety stock | Approved buffer |
F | Reorder point | Trigger level |
G | Current stock on hand | Available sellable units |
H | Reorder flag | Action signal |
I | Suggested order quantity | Recommended purchase quantity |
In F2, enter:
=C2*D2+E2
In H2, enter:
=IF(G2<=F2,"REORDER NOW","OK")
Copy both formulas down the SKU list. Then use conditional formatting to turn the reorder flag red when the cell contains REORDER NOW. Keep the wording simple. A warehouse operator should understand the action without checking a separate instruction sheet.

Add order logic and ownership
Column I should not automatically repeat the reorder point. Use your economic order quantity calculation, supplier minimums, carton sizes, or a manually approved quantity. If a supplier only ships in cartons, round the suggested quantity to a valid carton multiple. If cash is tight, add a review field so the buyer can approve, reduce, or defer the proposed purchase.
A dashboard cell can count triggered SKUs:
=COUNTIF(H:H,"REORDER NOW")
That gives the operations lead a quick workload view. It also gives you a useful finance question: how much cash will the currently triggered purchase orders consume?
For more control over stock movements, pair the tracker with inventory control for your warehouse. The spreadsheet should show the decision, while your stock process must ensure the quantity is accurate.
Automate the data, not the judgement
Connect Google Sheets to your ecommerce platform through Zapier or a native API, where practical. Daily orders can update sales inputs, while a scheduled process recalculates the rolling demand view. A person should still review promotions, supplier disruption, aged stock, and unusual transactions before approving a purchase order.
The tracker can support a small catalogue well. As locations, bundles, purchase orders, and supplier rules multiply, manual spreadsheet updates become a dispatch and control risk. Tools focused on streamlining dispatch with software can help reduce repetitive hand-offs between inventory, fulfilment, and transport.
Avoiding the Overstocking Trap That Drains Working Capital
Higher stock doesn't automatically create better service. It creates better service only when the extra units protect against a real demand or supply risk. Otherwise, the business has converted cash into storage, handling, markdown, and obsolescence exposure.
Australian SME inventory data makes the cash problem concrete. An industry report found Australian manufacturers carried average excess product or ingredients of $231,700, while building and construction businesses carried average overstock of $370,528 in the cited industry group. The figures come from Australian SME overstocking coverage, and they show why replenishment needs a working-capital lens.
Review turnover beside the trigger
A reorder point can be mathematically correct and commercially wrong if demand has permanently weakened. Review stock movement by SKU, then ask whether the safety stock still reflects current conditions. A product that sells slowly shouldn't inherit the same buffer logic as a high-velocity bestseller.
ABC classification helps allocate attention:
Class | Revenue Share | SKU Share | Reorder Review | Safety Stock Strategy |
|---|---|---|---|---|
A | Highest contribution | Smallest group | Weekly | Tight trigger, evidence-based buffer |
B | Mid-range contribution | Mid-range group | Fortnightly | Balanced buffer and review |
C | Lowest contribution | Largest group | Monthly or exception-based | Lean buffer, supplier flexibility |
The table uses qualitative categories rather than arbitrary thresholds. Set the boundaries from your own revenue distribution, then document them so the team applies the same rule consistently.
Make dead stock visible
Run a monthly report for products with no sales across the selected review period. The verified Australian inventory history also shows how quickly stock positions can change. ABS-based reporting recorded business inventories falling 0.9% quarter-on-quarter in Q3 2025, with retailers down 1.6%, miners down 4.8%, and accommodation and food services down 1.3%. The reported inventory movements reinforce why quarterly conditions should inform your assumptions.
Don't respond to a stockout fear by lifting every reorder point. Reduce risk selectively, protect critical products, and challenge weak sellers. For the accounting treatment and decision impact, review inventory valuation methods alongside operational stock reports.
Your Action Plan to Implement Reorder Points This Week
You can establish a workable first version before Friday if you keep the scope tight. Start with the products that consume the most cash or generate the most customer impact, then expand once the process works.
Export recent sales data. Use the last 90 days of sales to calculate average daily demand for your top 20 SKUs by revenue. Remove cancelled orders and investigate unusual promotions before accepting the result.
Confirm supplier lead times. Ask each supplier for actual processing, transit, receiving, and shelf-ready timing. Call if necessary. Catalogue lead times often become outdated when suppliers change freight methods or production schedules.
Set safety stock. Where daily-demand variance is available, use standard deviation multiplied by the square root of lead time. If you lack reliable variance data, use a conservative flat buffer of 1.5 times average daily demand, then review the result against stockout and overstock experience.
Load the tracker. Enter average demand, lead time, safety stock, current stock, and the reorder point formula. Test the flag by changing stock on hand to a value below the trigger and checking that the sheet displays REORDER NOW.
Assign a weekly review. Schedule a recurring 30-minute Monday review with one accountable owner, usually the operations lead or bookkeeper. That person should review flagged SKUs, confirm open purchase orders, and escalate unusual demand or supplier delays.

Treat the first version as a control system, not a finished forecast. Recalibrate the inputs when promotions, suppliers, product launches, or sales patterns change. If your team needs finance and operations support to connect inventory decisions with cash forecasting, Nexist provides virtual CFO services covering cash-flow management, performance reporting, inventory control, and process automation.
Nexist helps Australian founders connect reorder point calculation with cash-flow forecasting, inventory controls, and practical operating systems. Visit Nexist to discuss where stock is trapping cash and how to turn your inventory data into clear weekly actions.
reorder point calculation, inventory management, safety stock formula, stock control, cash flow optimisation

" width="24px"/><g d="M 0 24.129 L 0 0.129 L 24 0.129 L 24 24.129 Z M 0 24.129 L 0 0.129 L 24 0.129 L 24 24.129 Z M 24 3 C 24 1.344 22.656 0 21 0 L 3 0 C 1.344 0 0 1.344 0 3 L 0 21 C 0 22.656 1.344 24 3 24 L 21 24 C 22.656 24 24 22.656 24 21 Z M 6.883 8.375 L 2.863 8.375 L 2.863 20.467 L 6.883 20.467 Z M 4.899 2.545 C 3.524 2.545 2.625 3.449 2.625 4.634 C 2.625 5.795 3.496 6.724 4.846 6.724 L 4.872 6.724 C 6.273 6.724 7.146 5.795 7.146 4.634 C 7.12 3.449 6.274 2.545 4.899 2.545 Z M 16.747 8.09 C 14.614 8.09 13.659 9.263 13.124 10.086 L 13.124 8.374 L 9.105 8.374 C 9.159 9.508 9.105 20.466 9.105 20.466 L 13.124 20.466 L 13.124 13.713 C 13.124 13.352 13.15 12.99 13.257 12.732 C 13.547 12.01 14.209 11.262 15.319 11.262 C 16.773 11.262 17.355 12.372 17.355 13.996 L 17.355 20.466 L 21.374 20.466 L 21.374 13.532 C 21.374 9.818 19.391 8.09 16.747 8.09 Z" fill="transparent" height="24.12890599668026px" id="dSFdkJotL" width="24px"><path d="M 0 24 L 0 0 L 24 0 L 24 24 Z" fill="transparent" height="24px" id="wscNJE44G" transform="translate(0 0.129)" width="24px"/><g d="M 0 24.129 L 0 0.129 L 24 0.129 L 24 24.129 Z M 24 3 C 24 1.344 22.656 0 21 0 L 3 0 C 1.344 0 0 1.344 0 3 L 0 21 C 0 22.656 1.344 24 3 24 L 21 24 C 22.656 24 24 22.656 24 21 Z M 6.883 8.375 L 2.863 8.375 L 2.863 20.467 L 6.883 20.467 Z M 4.899 2.545 C 3.524 2.545 2.625 3.449 2.625 4.634 C 2.625 5.795 3.496 6.724 4.846 6.724 L 4.872 6.724 C 6.273 6.724 7.146 5.795 7.146 4.634 C 7.12 3.449 6.274 2.545 4.899 2.545 Z M 16.747 8.09 C 14.614 8.09 13.659 9.263 13.124 10.086 L 13.124 8.374 L 9.105 8.374 C 9.159 9.508 9.105 20.466 9.105 20.466 L 13.124 20.466 L 13.124 13.713 C 13.124 13.352 13.15 12.99 13.257 12.732 C 13.547 12.01 14.209 11.262 15.319 11.262 C 16.773 11.262 17.355 12.372 17.355 13.996 L 17.355 20.466 L 21.374 20.466 L 21.374 13.532 C 21.374 9.818 19.391 8.09 16.747 8.09 Z" fill="transparent" height="24.12890599668026px" id="sTpjGo1tb" width="24px"><path d="M 0 24 L 0 0 L 24 0 L 24 24 Z" fill="transparent" height="24px" id="s7ffpmKOD" transform="translate(0 0.129)" width="24px"/><g d="M 24 3 C 24 1.344 22.656 0 21 0 L 3 0 C 1.344 0 0 1.344 0 3 L 0 21 C 0 22.656 1.344 24 3 24 L 21 24 C 22.656 24 24 22.656 24 21 Z M 6.883 8.375 L 2.863 8.375 L 2.863 20.467 L 6.883 20.467 Z M 4.899 2.545 C 3.524 2.545 2.625 3.449 2.625 4.634 C 2.625 5.795 3.496 6.724 4.846 6.724 L 4.872 6.724 C 6.273 6.724 7.146 5.795 7.146 4.634 C 7.12 3.449 6.274 2.545 4.899 2.545 Z M 16.747 8.09 C 14.614 8.09 13.659 9.263 13.124 10.086 L 13.124 8.374 L 9.105 8.374 C 9.159 9.508 9.105 20.466 9.105 20.466 L 13.124 20.466 L 13.124 13.713 C 13.124 13.352 13.15 12.99 13.257 12.732 C 13.547 12.01 14.209 11.262 15.319 11.262 C 16.773 11.262 17.355 12.372 17.355 13.996 L 17.355 20.466 L 21.374 20.466 L 21.374 13.532 C 21.374 9.818 19.391 8.09 16.747 8.09 Z" fill="transparent" height="24.000006px" id="D0ecaHEcW" transform="translate(0 0)" width="24px"><path d="M 24 3 C 24 1.344 22.656 0 21 0 L 3 0 C 1.344 0 0 1.344 0 3 L 0 21 C 0 22.656 1.344 24 3 24 L 21 24 C 22.656 24 24 22.656 24 21 Z" fill="rgb(55, 184, 218)" height="24.000006px" id="IPLFE6zXx" width="24px"/><path d="M 4.02 0 L 0 0 L 0 12.092 L 4.02 12.092 Z" fill="rgb(255, 255, 255)" height="12.09201px" id="FWhtzAyuY" transform="translate(2.863 8.375)" width="4.02px"/><path d="M 2.274 0 C 0.899 0 0 0.904 0 2.089 C 0 3.25 0.871 4.179 2.221 4.179 L 2.247 4.179 C 3.648 4.179 4.521 3.25 4.521 2.089 C 4.495 0.904 3.649 0 2.274 0 Z" fill="rgb(255, 255, 255)" height="4.17876px" id="VmOsKv4kO" transform="translate(2.625 2.545)" width="4.52095px"/><path d="M 7.641 0 C 5.509 0 4.554 1.173 4.019 1.996 L 4.019 0.284 L 0 0.284 C 0.053 1.419 0 12.376 0 12.376 L 4.019 12.376 L 4.019 5.623 C 4.019 5.262 4.045 4.9 4.151 4.642 C 4.442 3.92 5.103 3.172 6.214 3.172 C 7.667 3.172 8.25 4.282 8.25 5.907 L 8.25 12.376 L 12.269 12.376 L 12.269 5.442 C 12.269 1.728 10.286 0 7.641 0 Z" fill="rgb(255, 255, 255)" height="12.37626px" id="n1XUbhaq0" transform="translate(9.105 8.09)" width="12.268830000000001px"/></g></g></g></g></svg>)