How to Calculate DSO: A Practical Guide for Australian SMEs
Learn how to calculate DSO with real Australian benchmarks, worked examples, and actionable steps to improve cash flow and reduce late payments.
Ansh Malhotra

Australian B2B companies report an average DSO of 56.4 days, compared with a global average of 49 days, leaving a 7.4-day gap in cash collection performance (Fujifilm Australia). But the bigger problem is often hidden inside the average. A business can calculate a respectable DSO while its slowest customers stretch payment times and create a cash-flow squeeze.
For Australian founders, knowing how to calculate DSO is only the starting point. You need to know which receivables sit inside the number, how payment behaviour differs from invoice terms, and where the worst delays are concentrated. A useful DSO report doesn't just describe the past. It tells you which invoices to chase, which customers need tighter credit terms, and how much cash you can release.
Table of Contents
Why DSO Matters for Australian Cash Flow
DSO turns unpaid invoices into a time measure. It answers a practical question: how long does your business take to convert credit sales into cash? A higher result means more working capital remains tied up in trade receivables, limiting the cash available for stock, wages, tax, and growth.
The headline DSO is only the starting point. Australian founders should split payment behaviour into three views: average DSO, overdue DSO, and a worst-case collection scenario based on the slowest material customer balances. A respectable average can conceal customers paying well beyond their agreed terms, leaving your cash forecast exposed.
That distinction matters because customer payment patterns rarely move together. One large account paying late can create a funding gap even when smaller customers pay on time. Review DSO by customer, invoice age, and payment terms, then connect each result to a collection action.
DSO also belongs beside your broader cash conversion cycle. Receivables are one part of the time between paying suppliers and collecting customer cash. If inventory sits longer or supplier terms tighten, a stable DSO can still coincide with worsening cash pressure.
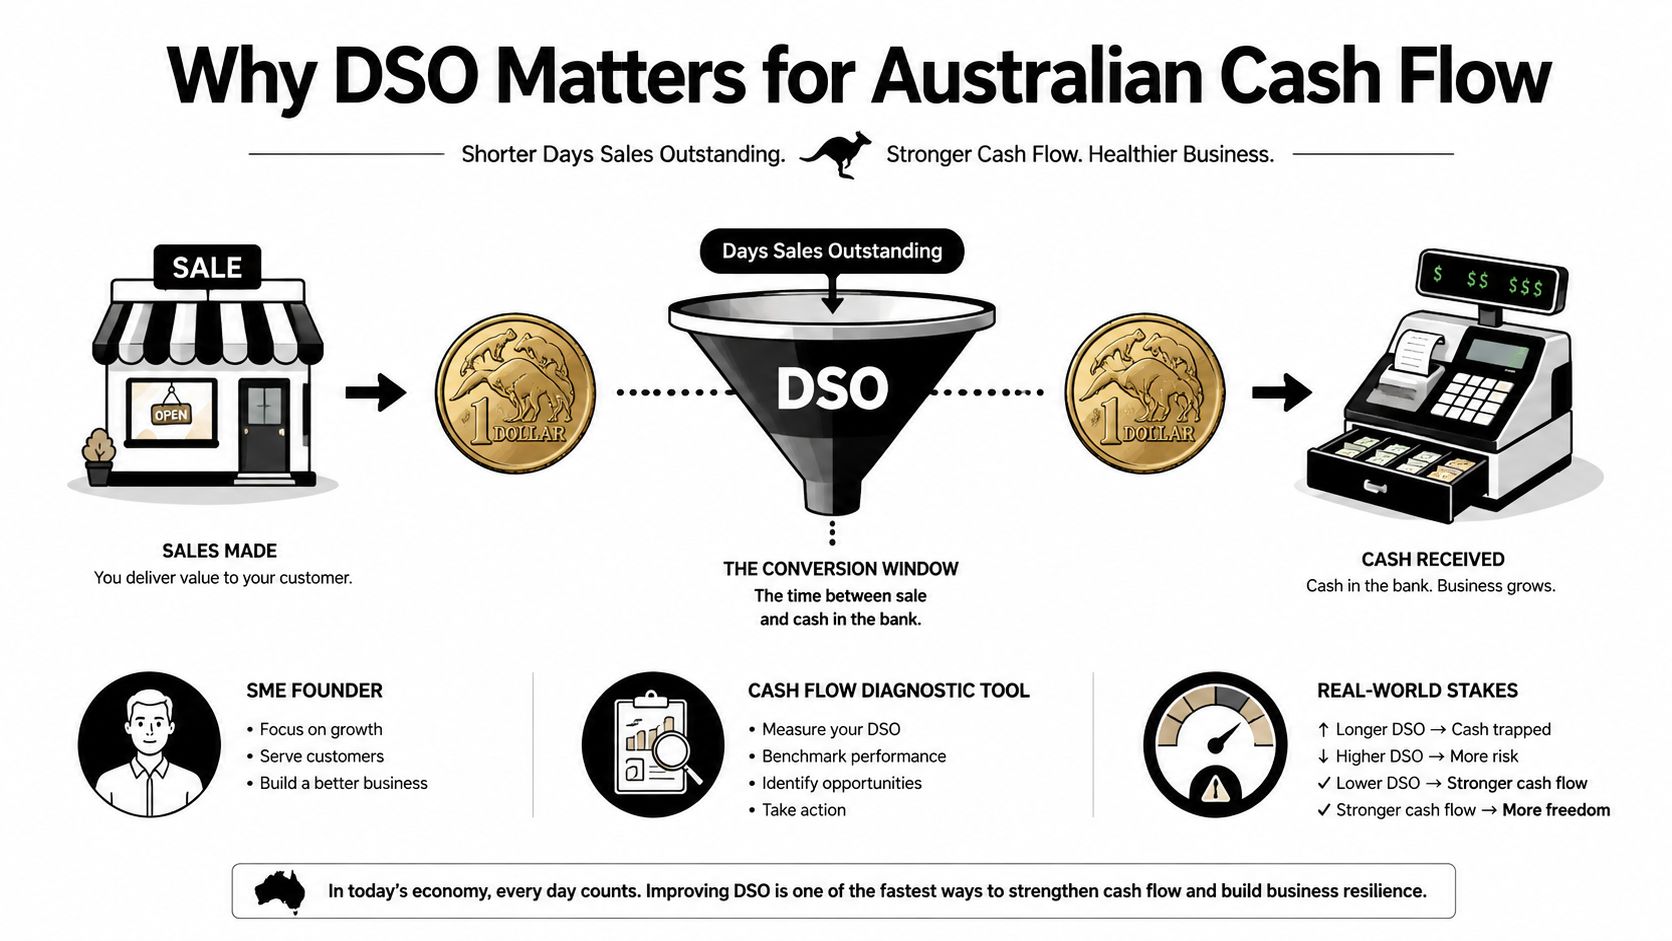
DSO turns a balance sheet figure into a decision
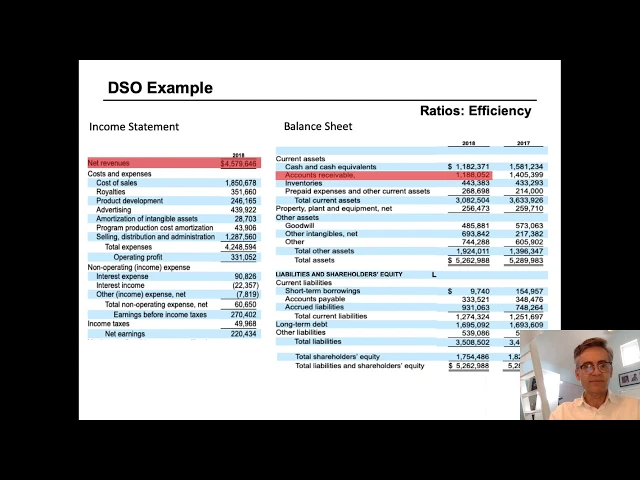
Use average trade receivables rather than relying only on the closing balance. A large invoice raised before reporting day can make the closing figure look unusually high or low. The 2026 Australian working capital trends report applies DSO = (Avg. Trade Receivables/Revenue) * 365, providing a consistent annual measure.
Treat DSO as a cash allocation metric. If it rises, identify the customers, invoices, disputes, or billing steps consuming the additional cash. Track the average figure for planning, overdue DSO for immediate control, and the worst-case view for funding decisions.
A one-day movement matters at scale. On $10 million of revenue, a one-day increase in DSO can tie up roughly $27,400 in working capital, based on the report's example. Calculate the result consistently and feed it into your weekly cash forecast. Your goal is not only a lower nominal DSO. It is reliable payment behaviour that protects operating cash.
The DSO Formula and Your First Calculation
Start with the formula:
DSO = (Average Trade Receivables ÷ Revenue) × Number of Days in the Period
For annual reporting, the calculation uses 365 days. The KPMG Australian working capital trends report presents the same method as DSO = (Avg. Trade Receivables/Revenue) * 365.

Gather the three inputs
Use trade receivables, not the entire current asset balance. This figure covers amounts customers owe for ordinary sales. Remove unrelated balances, including director loans, tax receivables, and other non-trade amounts.
Average the opening and closing receivables balances where possible:
Average Trade Receivables = (Opening Trade Receivables + Closing Trade Receivables) ÷ 2
Next, choose the sales denominator. Credit revenue is the best input when your accounting system records it separately. If credit sales make up nearly all revenue and cash sales are immaterial, total revenue can serve as a practical proxy. Keep the method consistent. Receivables and revenue must cover the same period and include the relevant billed sales.
The final input is the number of days in that period. Annual DSO uses 365 days. Quarterly and monthly calculations use the actual days in the selected quarter or month.
Work through an Australian example
Suppose an SME records $1 million in annual revenue and average trade receivables of $126,000. The calculation produces DSO of roughly 46 days. If average receivables increase to $129,000, DSO rises to roughly 47 days.
The calculation is:
($126,000 ÷ $1,000,000) × 365 = approximately 46 days
That figure describes the receivables balance as an equivalent number of sales days. It does not show how each customer pays. Some customers may pay immediately, while others pay after the due date. A small group can also account for most overdue invoices.
Use the formula for the headline. Use invoice-level analysis to explain the headline.
For better cash-flow control, calculate three views: average DSO for planning, overdue DSO for collection management, and the worst-case customer or invoice position for funding decisions. Nominal DSO can look acceptable while late payments from a few large customers consume cash.
If your system does not separate credit revenue, record that limitation in the monthly finance pack. Do not alter the denominator from month to month to improve the result. A consistent approximation creates a more useful trend than a precise-looking figure built from changing inputs.
Calculating DSO Across Monthly, Rolling, and Annual Periods
Annual DSO is useful for board reporting and external benchmarking, but it can hide a worsening collection pattern. A seasonal hospitality venue may collect efficiently during busy periods and struggle during quieter months. A trade business may raise most invoices when projects finish. An ecommerce brand may have a steadier sales pattern and get more insight from monthly monitoring.
Use the same logic across each period, but change the sales denominator and day count to match the window.
Choose the period that matches the risk
A monthly DSO snapshot compares the receivables balance at month end with revenue for that month. It's fast and useful, but a partial month or a single large invoice can make the result jump sharply.
A rolling period smooths those distortions. A rolling 90-day view, for example, compares the current receivables position with sales generated over the same recent window. It gives a better signal for a project-based business than comparing one quiet month with one busy month.
An annual calculation provides the broadest view. It works well for businesses with relatively consistent sales, but founders shouldn't rely on it alone where revenue is seasonal or lumpy.
Time Period | Formula | Best For | Key Consideration |
|---|---|---|---|
Monthly | Average or closing trade receivables ÷ monthly credit sales × days in month | Fast operational monitoring | A single invoice or partial month can distort the result |
Rolling period | Receivables ÷ credit sales during the rolling window × days in that window | Seasonal and project-based businesses | Keep the window consistent so trends remain comparable |
Annual | Average trade receivables ÷ annual revenue or credit sales × 365 | Annual reporting and benchmarking | Seasonality can make the average less diagnostic |
Build a simple trend view
Create a spreadsheet with one row per month and columns for opening receivables, closing receivables, average receivables, credit sales, days in period, and calculated DSO. Add a separate note for unusual events such as a major project invoice, a disputed account, or a temporary billing backlog.
For an accounts receivable team, pair this trend with an accounts receivable ageing report. The DSO line tells you whether the overall position is moving. The ageing report tells you whether the movement comes from current invoices, overdue balances, or a small group of seriously delayed accounts.
Don't average away seasonality. If monthly DSO rises while annual DSO stays flat, treat the monthly movement as an early warning.
Use monthly DSO for action, rolling DSO for management review, and annual DSO for context. That combination gives founders a faster warning system without abandoning a consistent benchmark.
The Gap Between Your DSO and Real Payment Behaviour
Your formula can be correct and still fail to describe the cash reality. DSO uses balances and sales over a period. It doesn't automatically show whether customers pay just after the due date, whether invoices sit in approval queues, or whether one large account creates a dangerous tail.
Recent Australian small-business data reported that businesses waited 24.1 days to be paid after invoicing in the March quarter of 2026, while invoices were paid 6.9 days late on average (Australian small-business late payment data). A business offering nominal 30-day terms may therefore experience about 36 days of cash collection in practice. That difference affects payroll timing, supplier payments, and the amount of cash available for growth.
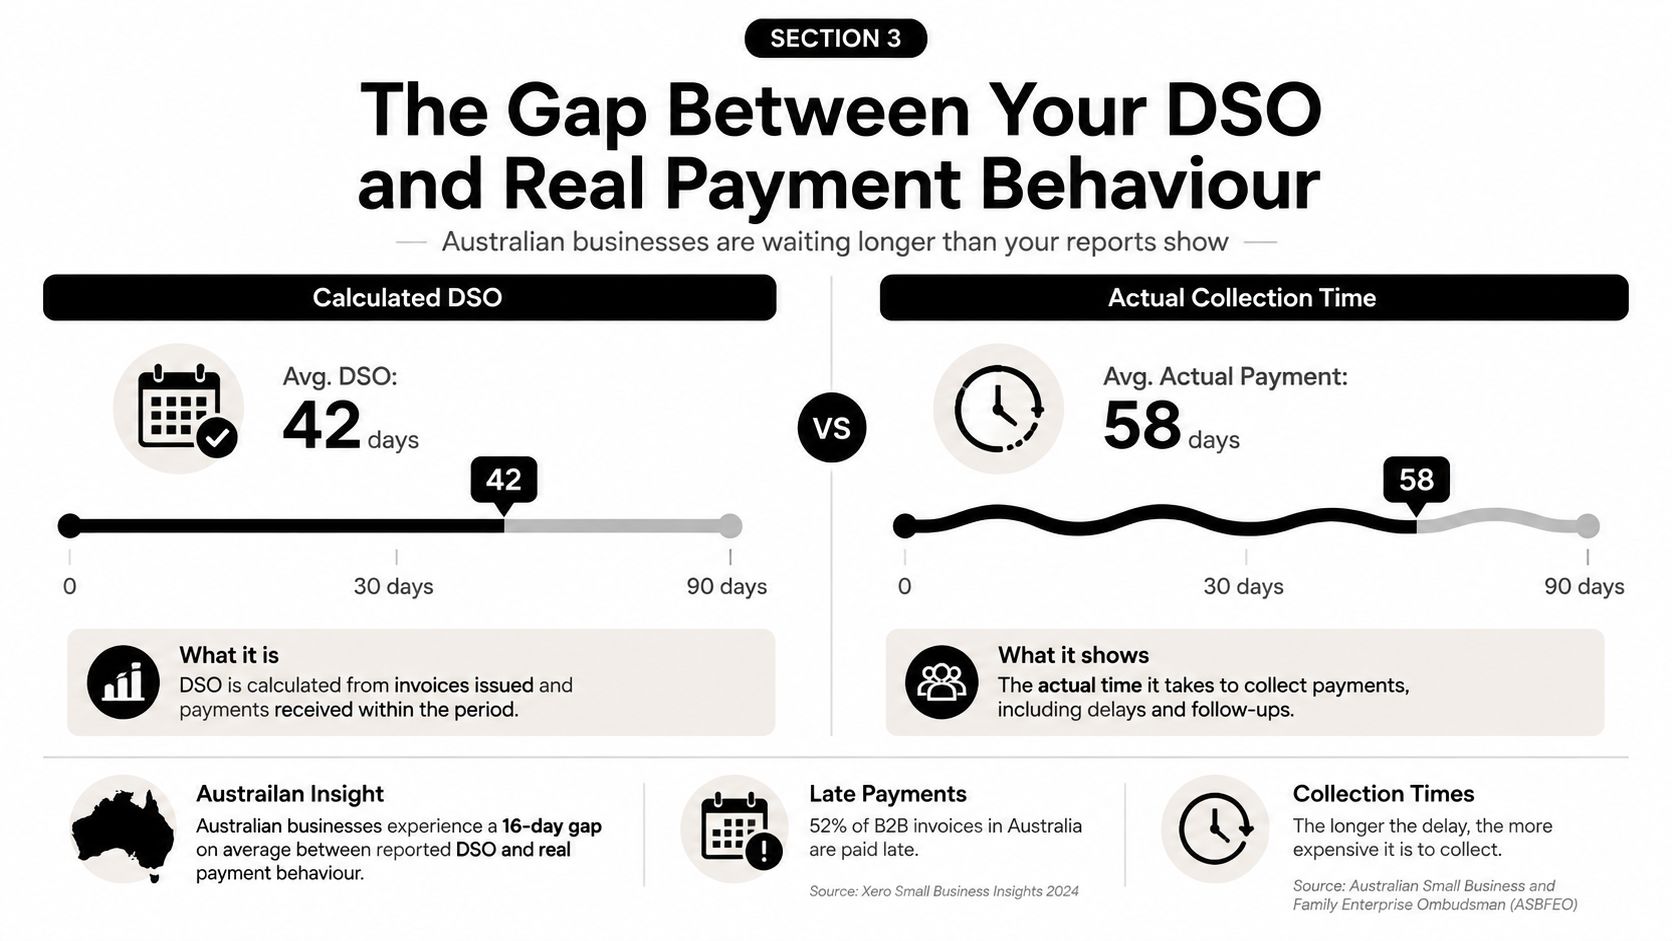
Split the number before you act
A single company-wide DSO is a useful headline, but it isn't a collection plan. Segment it into three views:
Average DSO: The overall receivables-to-sales relationship for the selected period.
Overdue DSO: The portion connected to invoices past their contractual due date.
Worst-case DSO: The payment experience created by the slowest customers or oldest invoice tail.
The last view matters because averages can look stable while risk concentrates in a few accounts. Australian Payment Times Reporting data showed 74.3% of invoices were paid on time, yet the 95th percentile payment time worsened to 64 days from 58 days (Payment Times Reporting regulator update). The message is clear. On-time performance and tail risk can move in opposite directions.
For each major customer, review invoice date, due date, paid date, outstanding value, dispute status, and payment method. Rank accounts by cash exposure, not by the number of invoices. Chasing a collection of small invoices may feel productive, but one large overdue balance can matter more to your forecast.
The Business Loan Warrior AR ageing guide is useful when you need to explain receivables quality to a lender or finance partner. A lender wants more than a total balance. You need to show what is current, what is overdue, and what action is underway.
Averages guide attention. The overdue and worst-case segments guide decisions.
Australian DSO Benchmarks and Industry Comparisons
A benchmark only helps when the comparison matches your sales model. A business selling to large corporate buyers under formal procurement terms should not measure itself against a business collecting payment at checkout. Customer concentration, contract structure, invoice approvals, disputes, and credit policy all shape DSO.
The Australian B2B benchmark of 56.4 days, compared with 49 days globally, provides useful context for the length of the local receivables cycle. Do not use either figure as a pass or fail threshold. Compare your result with similar customer segments, contractual terms, and your own historical performance.
Read DSO with the rest of working capital
A lower DSO can come at the cost of profitable sales if you reject commercially sound customers or impose terms that damage margins. A higher DSO may remain manageable when customers pay consistently and supplier terms help fund the gap.
Review DSO alongside:
Days Payables Outstanding: The time your business takes to pay suppliers. Paying suppliers quickly while customers pay slowly puts pressure on cash.
Inventory turnover: The speed at which stock becomes sales. Stock-heavy businesses can have cash tied up in inventory and receivables at the same time.
Receivables ageing: The split between current, overdue, disputed, and older invoices.
Customer concentration: The extent to which one or two large accounts determine your cash result.
Cash forecast: The expected timing of receipts, rather than the date invoices technically become due.
Set a benchmark that drives action
Use annual DSO for external context, then track monthly and rolling DSO for internal control. Segment the result by customer type, payment terms, salesperson, and account manager.
Your headline DSO can conceal payment risk. Keep the average view, then compare overdue balances and the slowest customer or invoice group. This separates a stable collection pattern from a result supported by a few fast-paying accounts while older balances accumulate elsewhere.
If your DSO exceeds the Australian comparison, identify the cause before setting a reduction target. Inaccurate invoices, slow approvals, generous credit limits, weak follow-up, and customer disputes require different responses.
A useful benchmark is a DSO you can explain and forecast, with overdue exposure visible. It should guide cash decisions without sacrificing profitable sales.
Practical Actions to Reduce DSO and Free Up Cash
Reducing DSO starts before the invoice is issued. Tighten the commercial process, remove avoidable payment friction, and focus collection effort where it releases the most cash.
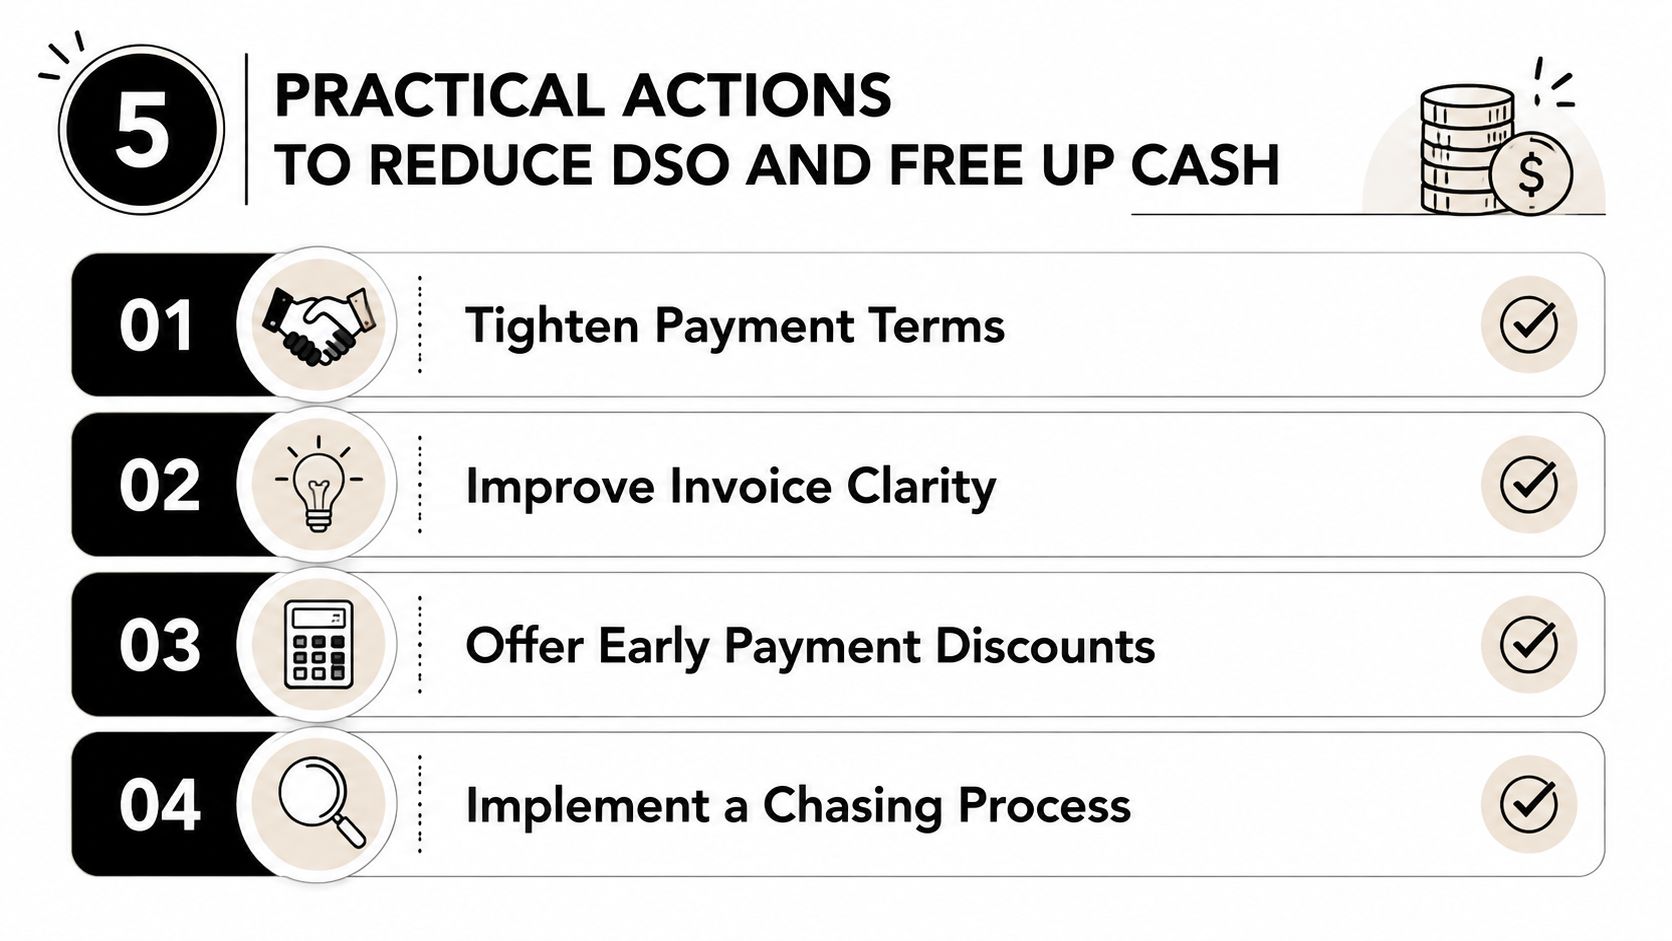
Four actions worth implementing
Set terms before delivery. Put payment terms, approval requirements, purchase order details, and payment methods in the proposal and contract. Don't discover the customer's procurement process after the work is complete.
Issue accurate invoices immediately. Include the correct legal entity, reference numbers, line items, tax treatment, bank details, and due date. An invoice that needs correction has already delayed collection.
Create a chasing rhythm. Send a reminder before the due date, follow up promptly after it passes, and escalate based on value, age, and customer risk. Assign ownership for every overdue account.
Review credit by behaviour. A customer who repeatedly pays late shouldn't automatically receive the same terms as a reliable payer. Consider deposits, staged billing, credit limits, or revised terms where the risk justifies it.
For recurring revenue businesses, a cohort analysis for subscriptions can help separate customer groups and identify whether payment behaviour changes by start period or plan type. That analysis complements DSO by showing where collection patterns may be developing.
Don't offer early-payment discounts without calculating the margin cost. The discount may accelerate cash, but it can also reward customers who already pay on time. Prioritise large overdue balances, recurring disputes, and customers whose behaviour threatens your forecast.
Use a disciplined accounts receivable management process to turn the metric into assigned actions, clear escalation rules, and regular review.
If your DSO is rising or your cash forecast feels unreliable, Nexist can help you diagnose the receivables bottleneck, improve cash-flow forecasting, and install practical finance systems. Visit Nexist to turn your DSO report into a focused collection plan and more dependable cash in the bank.
calculate DSO, days sales outstanding, cash flow management, DSO formula, accounts receivable

" width="24px"/><g d="M 0 24.129 L 0 0.129 L 24 0.129 L 24 24.129 Z M 0 24.129 L 0 0.129 L 24 0.129 L 24 24.129 Z M 24 3 C 24 1.344 22.656 0 21 0 L 3 0 C 1.344 0 0 1.344 0 3 L 0 21 C 0 22.656 1.344 24 3 24 L 21 24 C 22.656 24 24 22.656 24 21 Z M 6.883 8.375 L 2.863 8.375 L 2.863 20.467 L 6.883 20.467 Z M 4.899 2.545 C 3.524 2.545 2.625 3.449 2.625 4.634 C 2.625 5.795 3.496 6.724 4.846 6.724 L 4.872 6.724 C 6.273 6.724 7.146 5.795 7.146 4.634 C 7.12 3.449 6.274 2.545 4.899 2.545 Z M 16.747 8.09 C 14.614 8.09 13.659 9.263 13.124 10.086 L 13.124 8.374 L 9.105 8.374 C 9.159 9.508 9.105 20.466 9.105 20.466 L 13.124 20.466 L 13.124 13.713 C 13.124 13.352 13.15 12.99 13.257 12.732 C 13.547 12.01 14.209 11.262 15.319 11.262 C 16.773 11.262 17.355 12.372 17.355 13.996 L 17.355 20.466 L 21.374 20.466 L 21.374 13.532 C 21.374 9.818 19.391 8.09 16.747 8.09 Z" fill="transparent" height="24.12890599668026px" id="dSFdkJotL" width="24px"><path d="M 0 24 L 0 0 L 24 0 L 24 24 Z" fill="transparent" height="24px" id="wscNJE44G" transform="translate(0 0.129)" width="24px"/><g d="M 0 24.129 L 0 0.129 L 24 0.129 L 24 24.129 Z M 24 3 C 24 1.344 22.656 0 21 0 L 3 0 C 1.344 0 0 1.344 0 3 L 0 21 C 0 22.656 1.344 24 3 24 L 21 24 C 22.656 24 24 22.656 24 21 Z M 6.883 8.375 L 2.863 8.375 L 2.863 20.467 L 6.883 20.467 Z M 4.899 2.545 C 3.524 2.545 2.625 3.449 2.625 4.634 C 2.625 5.795 3.496 6.724 4.846 6.724 L 4.872 6.724 C 6.273 6.724 7.146 5.795 7.146 4.634 C 7.12 3.449 6.274 2.545 4.899 2.545 Z M 16.747 8.09 C 14.614 8.09 13.659 9.263 13.124 10.086 L 13.124 8.374 L 9.105 8.374 C 9.159 9.508 9.105 20.466 9.105 20.466 L 13.124 20.466 L 13.124 13.713 C 13.124 13.352 13.15 12.99 13.257 12.732 C 13.547 12.01 14.209 11.262 15.319 11.262 C 16.773 11.262 17.355 12.372 17.355 13.996 L 17.355 20.466 L 21.374 20.466 L 21.374 13.532 C 21.374 9.818 19.391 8.09 16.747 8.09 Z" fill="transparent" height="24.12890599668026px" id="sTpjGo1tb" width="24px"><path d="M 0 24 L 0 0 L 24 0 L 24 24 Z" fill="transparent" height="24px" id="s7ffpmKOD" transform="translate(0 0.129)" width="24px"/><g d="M 24 3 C 24 1.344 22.656 0 21 0 L 3 0 C 1.344 0 0 1.344 0 3 L 0 21 C 0 22.656 1.344 24 3 24 L 21 24 C 22.656 24 24 22.656 24 21 Z M 6.883 8.375 L 2.863 8.375 L 2.863 20.467 L 6.883 20.467 Z M 4.899 2.545 C 3.524 2.545 2.625 3.449 2.625 4.634 C 2.625 5.795 3.496 6.724 4.846 6.724 L 4.872 6.724 C 6.273 6.724 7.146 5.795 7.146 4.634 C 7.12 3.449 6.274 2.545 4.899 2.545 Z M 16.747 8.09 C 14.614 8.09 13.659 9.263 13.124 10.086 L 13.124 8.374 L 9.105 8.374 C 9.159 9.508 9.105 20.466 9.105 20.466 L 13.124 20.466 L 13.124 13.713 C 13.124 13.352 13.15 12.99 13.257 12.732 C 13.547 12.01 14.209 11.262 15.319 11.262 C 16.773 11.262 17.355 12.372 17.355 13.996 L 17.355 20.466 L 21.374 20.466 L 21.374 13.532 C 21.374 9.818 19.391 8.09 16.747 8.09 Z" fill="transparent" height="24.000006px" id="D0ecaHEcW" transform="translate(0 0)" width="24px"><path d="M 24 3 C 24 1.344 22.656 0 21 0 L 3 0 C 1.344 0 0 1.344 0 3 L 0 21 C 0 22.656 1.344 24 3 24 L 21 24 C 22.656 24 24 22.656 24 21 Z" fill="rgb(55, 184, 218)" height="24.000006px" id="IPLFE6zXx" width="24px"/><path d="M 4.02 0 L 0 0 L 0 12.092 L 4.02 12.092 Z" fill="rgb(255, 255, 255)" height="12.09201px" id="FWhtzAyuY" transform="translate(2.863 8.375)" width="4.02px"/><path d="M 2.274 0 C 0.899 0 0 0.904 0 2.089 C 0 3.25 0.871 4.179 2.221 4.179 L 2.247 4.179 C 3.648 4.179 4.521 3.25 4.521 2.089 C 4.495 0.904 3.649 0 2.274 0 Z" fill="rgb(255, 255, 255)" height="4.17876px" id="VmOsKv4kO" transform="translate(2.625 2.545)" width="4.52095px"/><path d="M 7.641 0 C 5.509 0 4.554 1.173 4.019 1.996 L 4.019 0.284 L 0 0.284 C 0.053 1.419 0 12.376 0 12.376 L 4.019 12.376 L 4.019 5.623 C 4.019 5.262 4.045 4.9 4.151 4.642 C 4.442 3.92 5.103 3.172 6.214 3.172 C 7.667 3.172 8.25 4.282 8.25 5.907 L 8.25 12.376 L 12.269 12.376 L 12.269 5.442 C 12.269 1.728 10.286 0 7.641 0 Z" fill="rgb(255, 255, 255)" height="12.37626px" id="n1XUbhaq0" transform="translate(9.105 8.09)" width="12.268830000000001px"/></g></g></g></g></svg>)