
Profitability Analysis: Uncover Hidden SME Gains
Unlock hidden profits! Our guide to profitability analysis helps Australian SMEs find financial strength, optimize cash flow, and make smarter decisions.
Ansh Malhotra

Sales are up. You're busier than ever. The team is flat out, orders keep coming in, and yet the bank balance still feels tight at the end of the month.
That usually means the problem isn't sales. It's profit visibility. Somewhere between pricing, stock, freight, payroll, software, rework, write-offs, and customer service, cash is leaking out faster than the topline suggests. Founders often see this first as a feeling before they see it in a report. Revenue looks healthy, but the business still can't breathe.
That's why profitability analysis matters. It isn't an academic finance exercise. It's the practical discipline of finding out which products, customers, jobs, or channels leave money behind after all costs are counted.
Table of Contents
Why Revenue Growth Does Not Equal More Cash in the Bank
A common founder story goes like this. Sales climb for three straight months, the team celebrates, then BAS, supplier payments, wages, and freight land in the same week. The owner opens the bank app and wonders how a business doing “record revenue” can still feel so fragile.
That gap exists because revenue is only the starting line. Cash gets tied up in stock, delayed by debtors, eaten by discounting, and thinned out by fulfilment, labour, software, and admin. If you're running ecommerce, wholesale, trades, hospitality, or a service business with delivery costs, the pressure gets worse when demand grows faster than your systems.
Australia's business base makes this especially relevant. The ABS reported 2.7 million actively trading businesses in Australia at the end of the 2023-24 financial year, with 98% classified as small businesses and around 67% operating as non-employing businesses (Insightsoftware summary of ABS business counts). In practice, that means most businesses doing profitability analysis don't have a large finance team. The founder is often making margin decisions from a basic P&L and a gut feel.
Where cash usually goes missing
The culprits are rarely dramatic. They're usually ordinary operating decisions repeated often enough to hurt.
Discounts that became standard. A one-off offer turns into everyday pricing.
Freight and fulfilment drift. Costs rise, but selling prices stay put.
Slow stock. Inventory looks like an asset on paper, but it traps cash.
Customer mix changes. New buyers might bring volume while demanding more support.
Timing pressure. Cash leaves long before it comes back.
If inventory is part of your model, critical ecommerce inventory management then becomes tightly linked to profitability rather than just operations. A product can show a decent gross margin and still leave you short on cash if it sits too long, gets returned often, or needs expensive handling.
Profitability analysis works best when you treat it as a leak-detection exercise, not a bookkeeping exercise.
Founders also need to connect margin with working capital. A sale that looks profitable on the P&L can still stretch cash if stock turns slowly or receivables lag. That's why a sharper reading of the cash conversion cycle often sits beside profitability analysis in any serious finance review.
The Three Layers of Profit You Must Understand
Most founders look at one profit number and assume they understand the business. They don't. A useful profitability analysis separates profit into layers, because each layer answers a different management question.
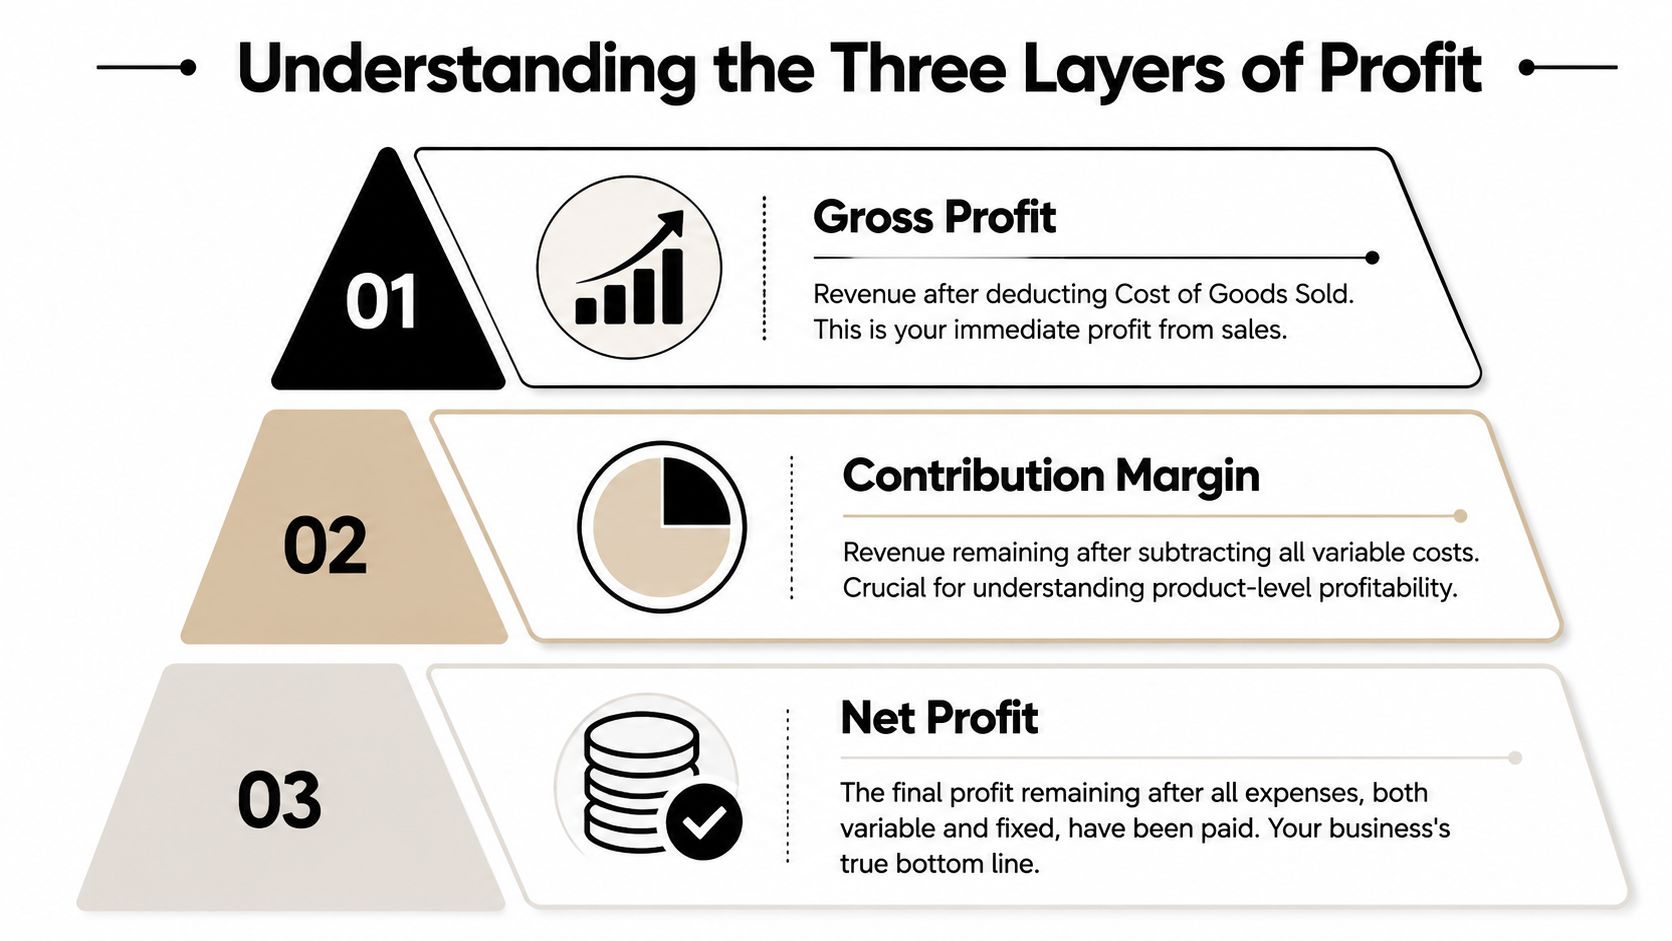
Gross profit tells you if the offer has legs
Use a simple coffee shop example. You sell a flat white. The selling price comes in. You subtract the beans, milk, cup, lid, and direct barista time tied closely to making that drink. What's left is gross profit.
Gross profit answers a narrow but important question. Is the core thing you sell viable before broader operating costs enter the picture? If gross profit is weak, you likely have a pricing issue, a supplier cost issue, or both.
The trap is stopping there. Plenty of businesses report acceptable gross margins while subtly bleeding money elsewhere.
Contribution margin tells you what actually helps cover overhead
Now take that same coffee and include more variable costs linked to the sale. Think merchant fees, delivery app commissions, packaging upgrades, or a sales commission if one applies. That gets you closer to contribution margin.
Decision-making sharpens. A product or service with healthy gross profit may have a poor contribution margin once the true cost to fulfil and serve it is included. For Australian SMEs, profitability analysis becomes far more useful when it moves beyond company-wide ratios and into segment-level contribution analysis by product, customer, channel, or geography, because misallocated shared costs can hide unprofitable lines (Abacum on segment-level profitability analysis).
Practical rule: If you only track gross margin, you'll keep feeding revenue streams that look good early in the P&L and disappoint at the bottom.
Net profit gives the final verdict
Net profit is what remains after fixed overheads and broader operating costs are paid. Rent, management salaries, software subscriptions, insurance, accounting, admin support, and other business-wide expenses all sit here.
A short comparison helps:
Profit layer | What it answers | Common mistake |
|---|---|---|
Gross profit | Does the product or service sell above direct production cost? | Treating this as the full profitability picture |
Contribution margin | Does this sale, customer, or channel genuinely help cover overhead? | Ignoring fulfilment, support, or transaction costs |
Net profit | Is the whole business model producing surplus after all costs? | Looking only at the total and missing bad segments |
A strong business needs all three views. Gross profit tells you if the unit economics start well. Contribution margin shows what deserves more volume. Net profit confirms whether the whole engine works.
A Step-by-Step Framework to Analyse Your Profitability
Good profitability analysis isn't complicated because the formulas are hard. It's complicated because the data usually sits in different places, and shared costs are easy to allocate badly.
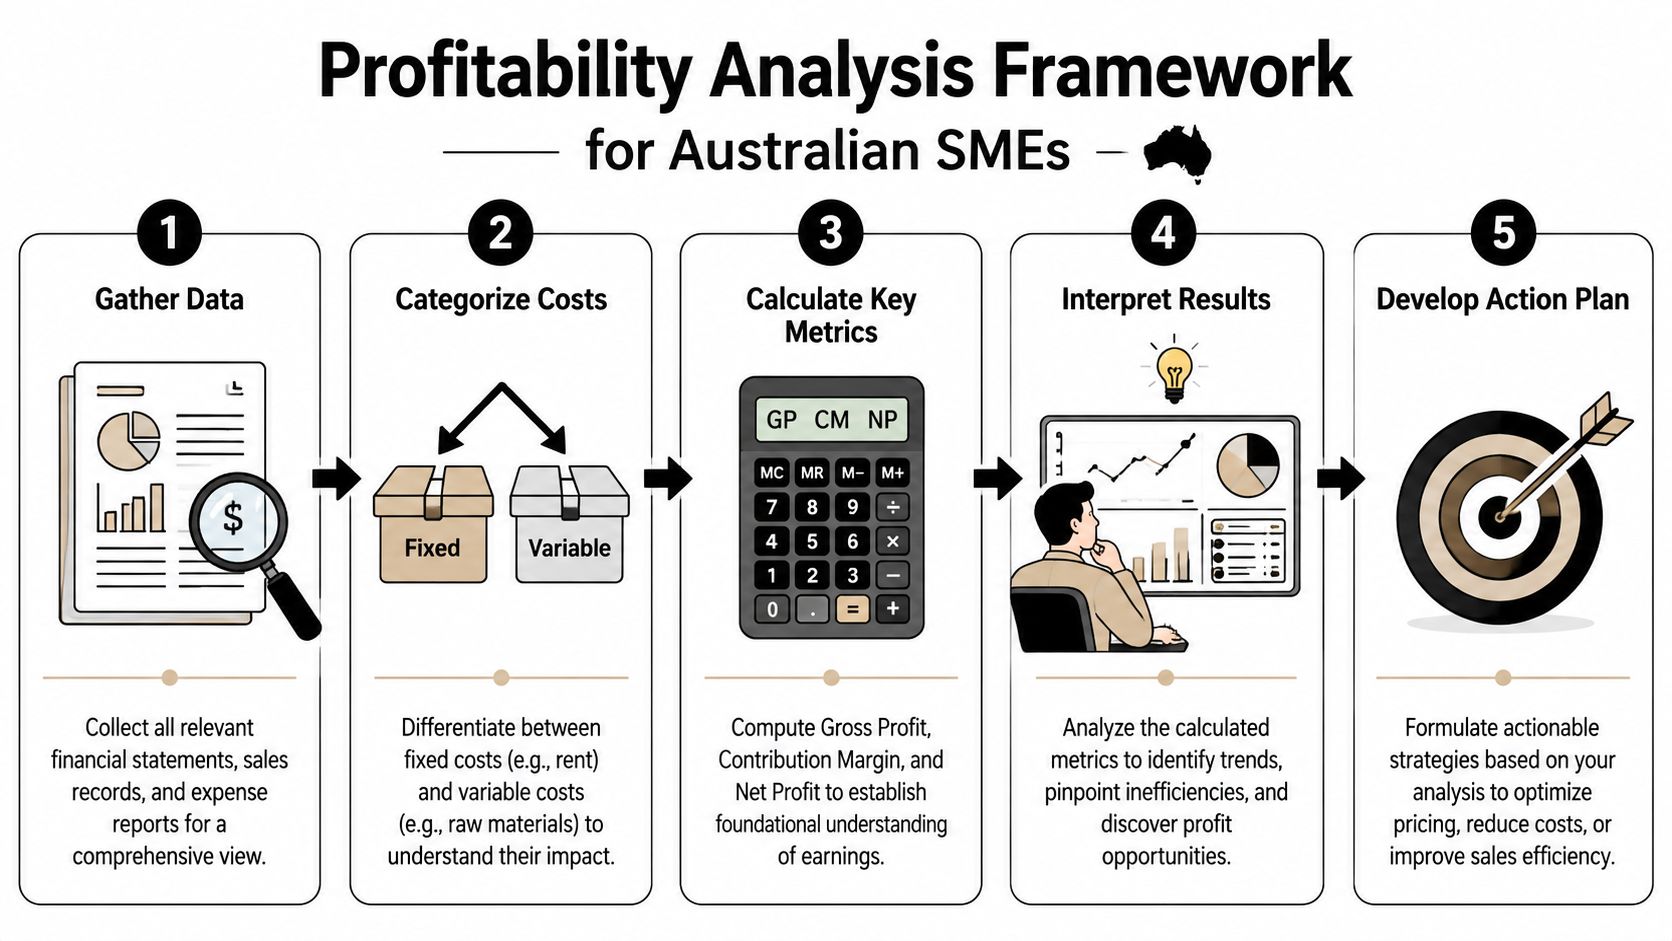
Start with data you don't get from the P and L alone
Your accounting file gives you part of the answer. It rarely gives you the whole answer. A founder who wants useful results needs financial and operational data side by side.
Pull data from places such as:
Accounting software for revenue, direct costs, payroll, overheads, and journals
Inventory or commerce platforms for SKU sales, returns, freight, and channel fees
CRM or job systems for customer activity, service time, travel, and scope changes
Banking and debt schedules for financing pressure and interest burden
Then clean obvious distortions. Remove owner-specific discretionary items if they aren't relevant to operating decisions. Separate one-off expenses from normal trading. Keep the raw version as well, because lenders and investors still care about reported outcomes.
A short walkthrough can help frame the process before you build your own model:
Choose segments that match how decisions are made
Don't segment because a template says you should. Segment based on decisions you're willing to make.
Useful segment options include:
By product or SKU if you carry inventory or manufacture.
By customer or client group if service demands vary widely.
By channel if marketplace fees, sales commissions, or fulfilment differ.
By geography if delivery, labour, or travel changes by location.
If you run a trades business, customer and job-type profitability often matter more than broad company averages. If you run ecommerce, product and channel analysis usually matter first.
Allocate shared costs by usage, not convenience
Most analyses go wrong due to a specific practice: founders often spread overhead evenly across products or customers because it's quick. That gives a tidy spreadsheet and a distorted answer.
A common mistake in profitability analysis is allocating overhead evenly instead of based on actual usage. More advanced methods use cost-to-serve analysis with both operational and financial data so shared costs are assigned on a defensible basis (Farseer on overhead allocation and cost-to-serve).
Use a practical allocation method like this:
Cost type | Better allocation basis | Avoid this |
|---|---|---|
Freight and fulfilment | Orders, weight, cubic size, delivery zone | Equal split across all SKUs |
Warehouse and packing labour | Pick-pack time, order count, units handled | Flat percentage of revenue |
Sales and account management | Time spent, account touches, proposals, visits | Allocating only to largest customers |
Software tied to transactions | Usage volume, users, orders, tickets | Spreading everything evenly |
Admin overhead | Leave partly unallocated for segment decisions if no clear driver exists | Forcing arbitrary precision |
If you can't defend the driver in one sentence, don't use it.
Not every cost should be pushed down to the segment level. Some business-wide costs belong at the company level. The point is to avoid fake precision. Segment analysis should inform decisions, not create mathematical theatre.
Build the review into a repeatable monthly rhythm
A one-off analysis helps. A monthly rhythm changes behaviour.
At minimum, review:
Margin movement by product, customer, or channel
Variance drivers such as price, volume, mix, and cost
Cash implications including stock build, debtor stretch, or supplier pressure
Action list with one owner per issue
Tools can range from a disciplined spreadsheet model to Power BI, Fathom, inventory platforms, and a virtual CFO workflow. Some founders also use an external finance partner such as Nexist to pull the data together, build allocation logic, and turn the numbers into operating actions.
How to Interpret Your Results and Build a KPI Dashboard
The first pass of profitability analysis usually creates surprise. The highest-revenue customer isn't always the best customer. The “hero” product isn't always the most profitable. The fastest-growing channel may be the one creating the most friction.

Read the gaps before you rush to fix them
Results only matter if you interpret them in context. Recent ABS releases show annual CPI inflation has remained positive and labour-related cost pressures have stayed material, while the RBA has continued to emphasise restrictive policy settings through 2025-26. A better Australian reading of profitability analysis combines margin review with inflation-adjusted thinking so you can tell whether the issue is pricing, cost structure, or financing pressure (Fathom on profitability analysis in current conditions).
That distinction matters.
Pricing problem. Volume is stable, but margins keep slipping because price hasn't kept up with input costs.
Cost structure problem. Revenue is fine, but labour, software, delivery, or overhead has grown faster than useful output.
Financing problem. Operations may still work, but debt servicing or working capital strain is pulling down the end result.
A founder who mixes these up often chooses the wrong fix. They cut marketing when the actual issue is pricing. They chase more sales when the actual issue is servicing complexity.
A weak month doesn't automatically mean poor execution. Sometimes the numbers are reacting to higher labour cost, slower stock turns, or expensive debt.
If payroll is a major part of your cost base, broader reading around PEO impact on profitability can be useful when comparing internal employment costs with outsourced structures. The point isn't to chase a fad. It's to understand which operating model leaves more margin after the true cost to serve is included.
What to keep on a founder dashboard
A founder dashboard should be short enough to read in a few minutes. If it becomes a report pack no one opens, it's failed.
Track a practical set of KPIs such as:
Gross margin by segment to spot direct cost drift
Contribution margin by segment to show what helps cover overhead
Net margin trend to confirm the business model is still working
Inventory turnover or stock ageing if you hold product
Receivables ageing if customers pay on terms
Interest coverage view if debt or finance costs matter materially
Cost-to-serve flags for difficult customers, channels, or service types
A disciplined quarterly business review helps turn these metrics into management decisions rather than dashboard wallpaper. Numbers only help when someone uses them to reprice, simplify, stop, or double down.
Five Practical Ways to Fix Leaks and Boost Your Profit
Most businesses don't need a dramatic turnaround. They need a handful of clear decisions made consistently. Once profitability analysis shows where the leaks sit, the work becomes operational.
Reprice where value is clear
Many founders avoid repricing because they fear churn. The bigger risk is keeping customers who only stay because you're undercharging.
Start with the segments that already absorb more service time, more customisation, or more delivery complexity. Don't apply one flat price rise to everything. Reprice where demand is less sensitive, where value is obvious, and where the work is hardest to fulfil.
Treat stock like cash sitting on a shelf
Inventory-heavy businesses often defend broad product ranges because “customers expect choice”. In practice, too much choice often means too much trapped cash.
Take action on three fronts:
Cull low-quality SKUs that consume space, handling, and attention without strong contribution.
Review landed cost properly so freight, duties, returns, and packaging aren't hidden.
Separate hero products from vanity products based on real contribution, not just sales volume.
The best-selling item in the catalogue can still be the worst use of cash.
Tighten receivables before chasing more sales
A profitable customer who pays late still creates pressure. If debtors are stretching, the business funds growth itself.
Focus on a few basics and do them well:
Invoice immediately when work is complete or milestones are hit.
Use clearer payment terms so there's less room for dispute.
Escalate overdue accounts consistently instead of hoping they self-correct.
Link sales and finance so account managers don't keep promising work to slow payers.
If this area is messy, a tighter process for accounts receivable management usually improves both cash timing and margin discipline.
Cut complexity that forces manual work
A lot of overhead isn't really “overhead”. It's rework. Team members fixing purchase order errors, correcting invoices, chasing missing approvals, and answering preventable customer questions all consume margin.
Look for friction points such as:
Leak | What usually fixes it |
|---|---|
Repeated data entry | Better system integration or simple automation |
Frequent stock discrepancies | Cleaner SKU setup and receiving discipline |
Job scope creep | Tighter quoting, change orders, and job notes |
Approval bottlenecks | Clear spend limits and simpler workflows |
Reducing manual work does two things at once. It lowers cost and improves decision speed.
Stop subsidising hard-to-serve customers
Founders often tolerate bad-fit customers because the revenue looks important. But some accounts soak up calls, custom work, returns, complaints, delivery exceptions, and delayed payment. Those customers don't just reduce profit. They consume management attention that could go to better-fit accounts.
Practical responses include:
changing minimum order values
charging for urgent or custom work
resetting scope boundaries
moving some accounts to lower-touch service models
exiting relationships that no longer make economic sense
That last one is uncomfortable. It's also sometimes the cleanest margin improvement available.
Profitability Analysis in Action for Australian Businesses
The numbers become useful when they change an operating decision. Two common examples show where profitability analysis earns its keep.
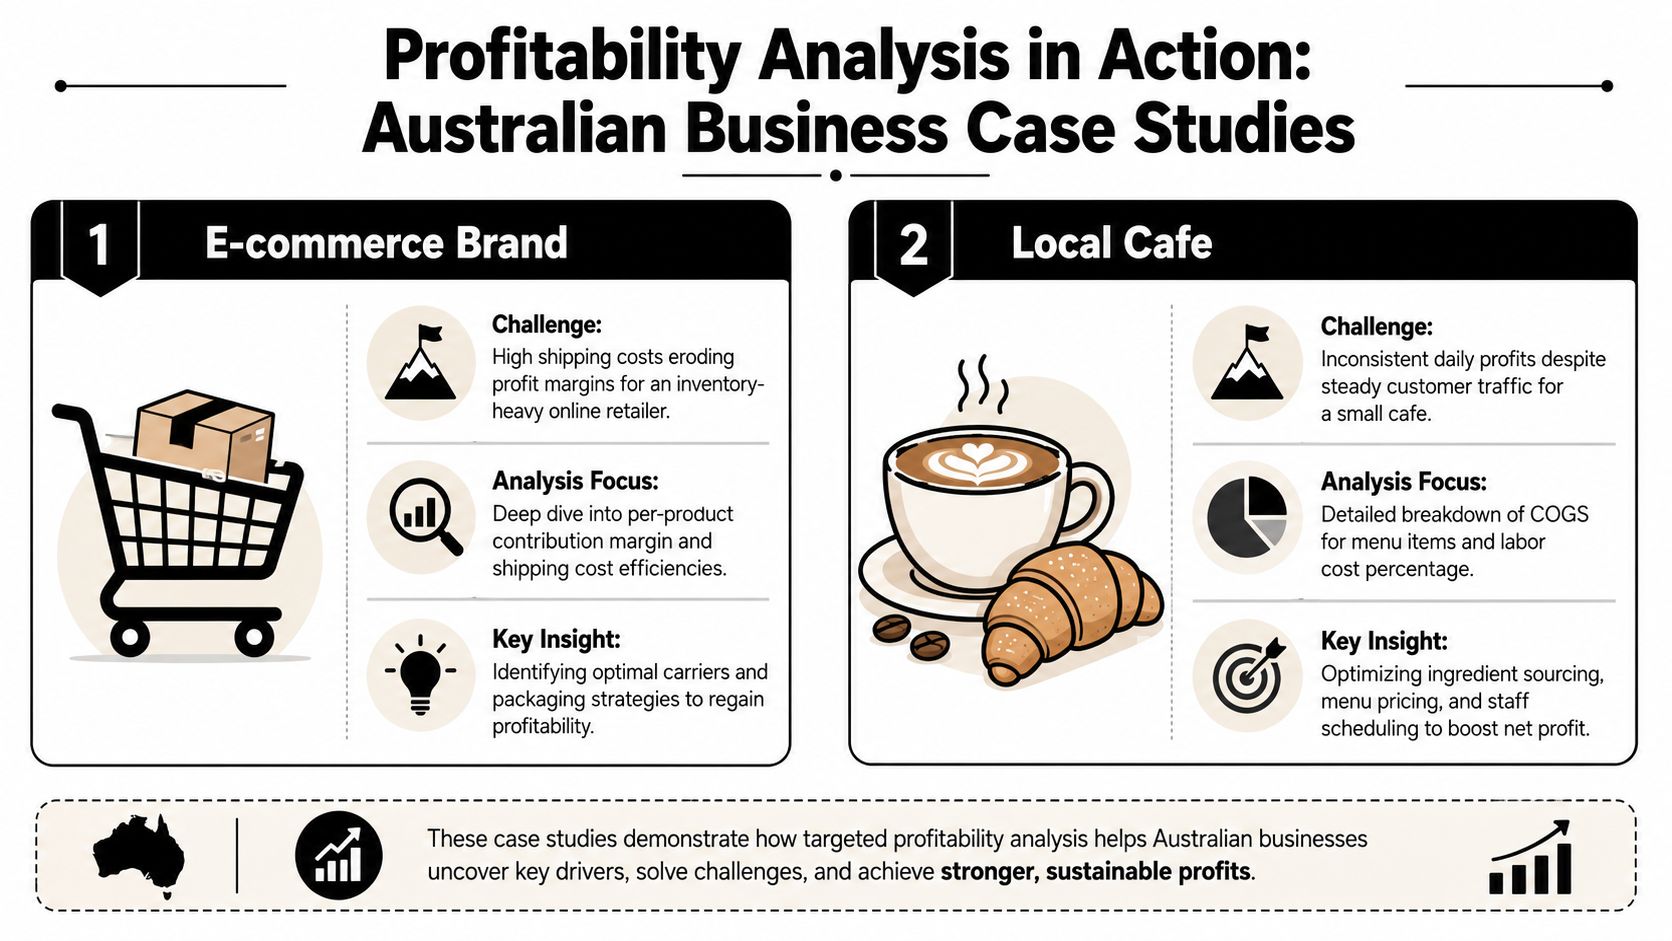
Ecommerce brand with strong sales and weak margins
An online retailer looked healthy from the topline. Sales were moving, paid ads were working, and a small group of products appeared to drive most of the growth. The founder assumed those products were the business's strongest assets.
The margin review told a different story. Once landed cost, packaging, freight, returns handling, and marketplace fees were included, the apparent winners were only marginal contributors. For inventory-heavy Australian businesses such as retail, wholesale, and ecommerce, profitability analysis should incorporate landed cost and inventory turnover because product-level margin can be overstated if freight, duties, and returns handling are excluded. A defensible analysis calculates profit per unit after all direct and indirect costs (Finale Inventory on landed cost and turnover in profitability analysis).
The response wasn't to cut all low-margin products immediately. The founder first split the catalogue into keep, reprice, bundle, and exit. Slow-moving stock was cleared. Packaging was standardised. Marketplace pricing was reviewed separately from direct-channel pricing. The business ended up with a narrower range, cleaner replenishment decisions, and less cash trapped in weak stock.
Trades business with a big client and poor returns
A service and trades business had one customer that looked essential. The account generated high revenue, gave the owner confidence, and kept a large portion of the team busy.
Customer-level analysis changed the picture. The client demanded urgent scheduling changes, extra travel, frequent quote revisions, and a level of communication that far exceeded the revenue benefit. Once supervisor time, callback risk, and admin load were recognised, the account's contribution looked far weaker than smaller, better-scoped clients.
The fix was commercial, not emotional. The business tightened scope, changed callout terms, revised pricing for non-standard work, and stopped treating revenue size as a proxy for value. That gave the team space to prioritise cleaner jobs with stronger contribution and less disruption.
High revenue customers can become low-quality customers when service complexity goes unmeasured.
Your Next Steps From Analysis to Sustainable Growth
The point of profitability analysis isn't to produce a clever spreadsheet. It's to give you a clearer operating playbook. Once you know which products, customers, channels, and costs are helping or hurting, you can build pricing changes, stock decisions, service boundaries, and cash planning around reality.
There's urgency in that. ASIC reported 11,053 company insolvency appointments in 2023-24, up from 7,994 in 2022-23 and 5,958 in 2021-22. That's about a 38% rise year on year and about 85% over two years (Numeric summary of ASIC insolvency trend). Weak margins and uncontrolled overhead don't stay theoretical for long.
Start with a monthly review rhythm. Keep the dashboard short. Build forecasts from actual margin drivers. And remember that retention matters too. If you can reduce customer churn among your better-fit, higher-quality customers, the profitability gains often compound faster than chasing more low-quality volume.
If you want help turning profitability analysis into a working finance system, Nexist helps Australian founders get control of margins, cash flow, forecasting, and operating decisions. A practical virtual CFO process can show where profit is leaking, build the right KPIs, and give you a clear action plan without adding more admin to your week.
profitability analysis, virtual cfo, cash flow management, business profitability, small business australia

" width="24px"/><g d="M 0 24.129 L 0 0.129 L 24 0.129 L 24 24.129 Z M 0 24.129 L 0 0.129 L 24 0.129 L 24 24.129 Z M 24 3 C 24 1.344 22.656 0 21 0 L 3 0 C 1.344 0 0 1.344 0 3 L 0 21 C 0 22.656 1.344 24 3 24 L 21 24 C 22.656 24 24 22.656 24 21 Z M 6.883 8.375 L 2.863 8.375 L 2.863 20.467 L 6.883 20.467 Z M 4.899 2.545 C 3.524 2.545 2.625 3.449 2.625 4.634 C 2.625 5.795 3.496 6.724 4.846 6.724 L 4.872 6.724 C 6.273 6.724 7.146 5.795 7.146 4.634 C 7.12 3.449 6.274 2.545 4.899 2.545 Z M 16.747 8.09 C 14.614 8.09 13.659 9.263 13.124 10.086 L 13.124 8.374 L 9.105 8.374 C 9.159 9.508 9.105 20.466 9.105 20.466 L 13.124 20.466 L 13.124 13.713 C 13.124 13.352 13.15 12.99 13.257 12.732 C 13.547 12.01 14.209 11.262 15.319 11.262 C 16.773 11.262 17.355 12.372 17.355 13.996 L 17.355 20.466 L 21.374 20.466 L 21.374 13.532 C 21.374 9.818 19.391 8.09 16.747 8.09 Z" fill="transparent" height="24.12890599668026px" id="dSFdkJotL" width="24px"><path d="M 0 24 L 0 0 L 24 0 L 24 24 Z" fill="transparent" height="24px" id="wscNJE44G" transform="translate(0 0.129)" width="24px"/><g d="M 0 24.129 L 0 0.129 L 24 0.129 L 24 24.129 Z M 24 3 C 24 1.344 22.656 0 21 0 L 3 0 C 1.344 0 0 1.344 0 3 L 0 21 C 0 22.656 1.344 24 3 24 L 21 24 C 22.656 24 24 22.656 24 21 Z M 6.883 8.375 L 2.863 8.375 L 2.863 20.467 L 6.883 20.467 Z M 4.899 2.545 C 3.524 2.545 2.625 3.449 2.625 4.634 C 2.625 5.795 3.496 6.724 4.846 6.724 L 4.872 6.724 C 6.273 6.724 7.146 5.795 7.146 4.634 C 7.12 3.449 6.274 2.545 4.899 2.545 Z M 16.747 8.09 C 14.614 8.09 13.659 9.263 13.124 10.086 L 13.124 8.374 L 9.105 8.374 C 9.159 9.508 9.105 20.466 9.105 20.466 L 13.124 20.466 L 13.124 13.713 C 13.124 13.352 13.15 12.99 13.257 12.732 C 13.547 12.01 14.209 11.262 15.319 11.262 C 16.773 11.262 17.355 12.372 17.355 13.996 L 17.355 20.466 L 21.374 20.466 L 21.374 13.532 C 21.374 9.818 19.391 8.09 16.747 8.09 Z" fill="transparent" height="24.12890599668026px" id="sTpjGo1tb" width="24px"><path d="M 0 24 L 0 0 L 24 0 L 24 24 Z" fill="transparent" height="24px" id="s7ffpmKOD" transform="translate(0 0.129)" width="24px"/><g d="M 24 3 C 24 1.344 22.656 0 21 0 L 3 0 C 1.344 0 0 1.344 0 3 L 0 21 C 0 22.656 1.344 24 3 24 L 21 24 C 22.656 24 24 22.656 24 21 Z M 6.883 8.375 L 2.863 8.375 L 2.863 20.467 L 6.883 20.467 Z M 4.899 2.545 C 3.524 2.545 2.625 3.449 2.625 4.634 C 2.625 5.795 3.496 6.724 4.846 6.724 L 4.872 6.724 C 6.273 6.724 7.146 5.795 7.146 4.634 C 7.12 3.449 6.274 2.545 4.899 2.545 Z M 16.747 8.09 C 14.614 8.09 13.659 9.263 13.124 10.086 L 13.124 8.374 L 9.105 8.374 C 9.159 9.508 9.105 20.466 9.105 20.466 L 13.124 20.466 L 13.124 13.713 C 13.124 13.352 13.15 12.99 13.257 12.732 C 13.547 12.01 14.209 11.262 15.319 11.262 C 16.773 11.262 17.355 12.372 17.355 13.996 L 17.355 20.466 L 21.374 20.466 L 21.374 13.532 C 21.374 9.818 19.391 8.09 16.747 8.09 Z" fill="transparent" height="24.000006px" id="D0ecaHEcW" transform="translate(0 0)" width="24px"><path d="M 24 3 C 24 1.344 22.656 0 21 0 L 3 0 C 1.344 0 0 1.344 0 3 L 0 21 C 0 22.656 1.344 24 3 24 L 21 24 C 22.656 24 24 22.656 24 21 Z" fill="rgb(55, 184, 218)" height="24.000006px" id="IPLFE6zXx" width="24px"/><path d="M 4.02 0 L 0 0 L 0 12.092 L 4.02 12.092 Z" fill="rgb(255, 255, 255)" height="12.09201px" id="FWhtzAyuY" transform="translate(2.863 8.375)" width="4.02px"/><path d="M 2.274 0 C 0.899 0 0 0.904 0 2.089 C 0 3.25 0.871 4.179 2.221 4.179 L 2.247 4.179 C 3.648 4.179 4.521 3.25 4.521 2.089 C 4.495 0.904 3.649 0 2.274 0 Z" fill="rgb(255, 255, 255)" height="4.17876px" id="VmOsKv4kO" transform="translate(2.625 2.545)" width="4.52095px"/><path d="M 7.641 0 C 5.509 0 4.554 1.173 4.019 1.996 L 4.019 0.284 L 0 0.284 C 0.053 1.419 0 12.376 0 12.376 L 4.019 12.376 L 4.019 5.623 C 4.019 5.262 4.045 4.9 4.151 4.642 C 4.442 3.92 5.103 3.172 6.214 3.172 C 7.667 3.172 8.25 4.282 8.25 5.907 L 8.25 12.376 L 12.269 12.376 L 12.269 5.442 C 12.269 1.728 10.286 0 7.641 0 Z" fill="rgb(255, 255, 255)" height="12.37626px" id="n1XUbhaq0" transform="translate(9.105 8.09)" width="12.268830000000001px"/></g></g></g></g></svg>)