
Profit Margin vs Gross Margin: A Founder's Guide
Confused about profit margin vs gross margin? Our guide for Australian SMEs explains the formulas, key differences, and how to use them to fix cash flow.
Ansh Malhotra

You've had a strong month of sales. Orders are moving, revenue looks encouraging, and the team is working flat out. Yet suppliers are asking when they'll be paid, wages are approaching, and the bank balance is lower than expected.
That situation is common in Australian retail, ecommerce, wholesale, hospitality, trades and other growing businesses. Sales measure activity, not necessarily financial health. The difference between gross margin and profit margin helps explain where the money goes, why a product can look profitable while the business struggles, and which decision deserves attention first.
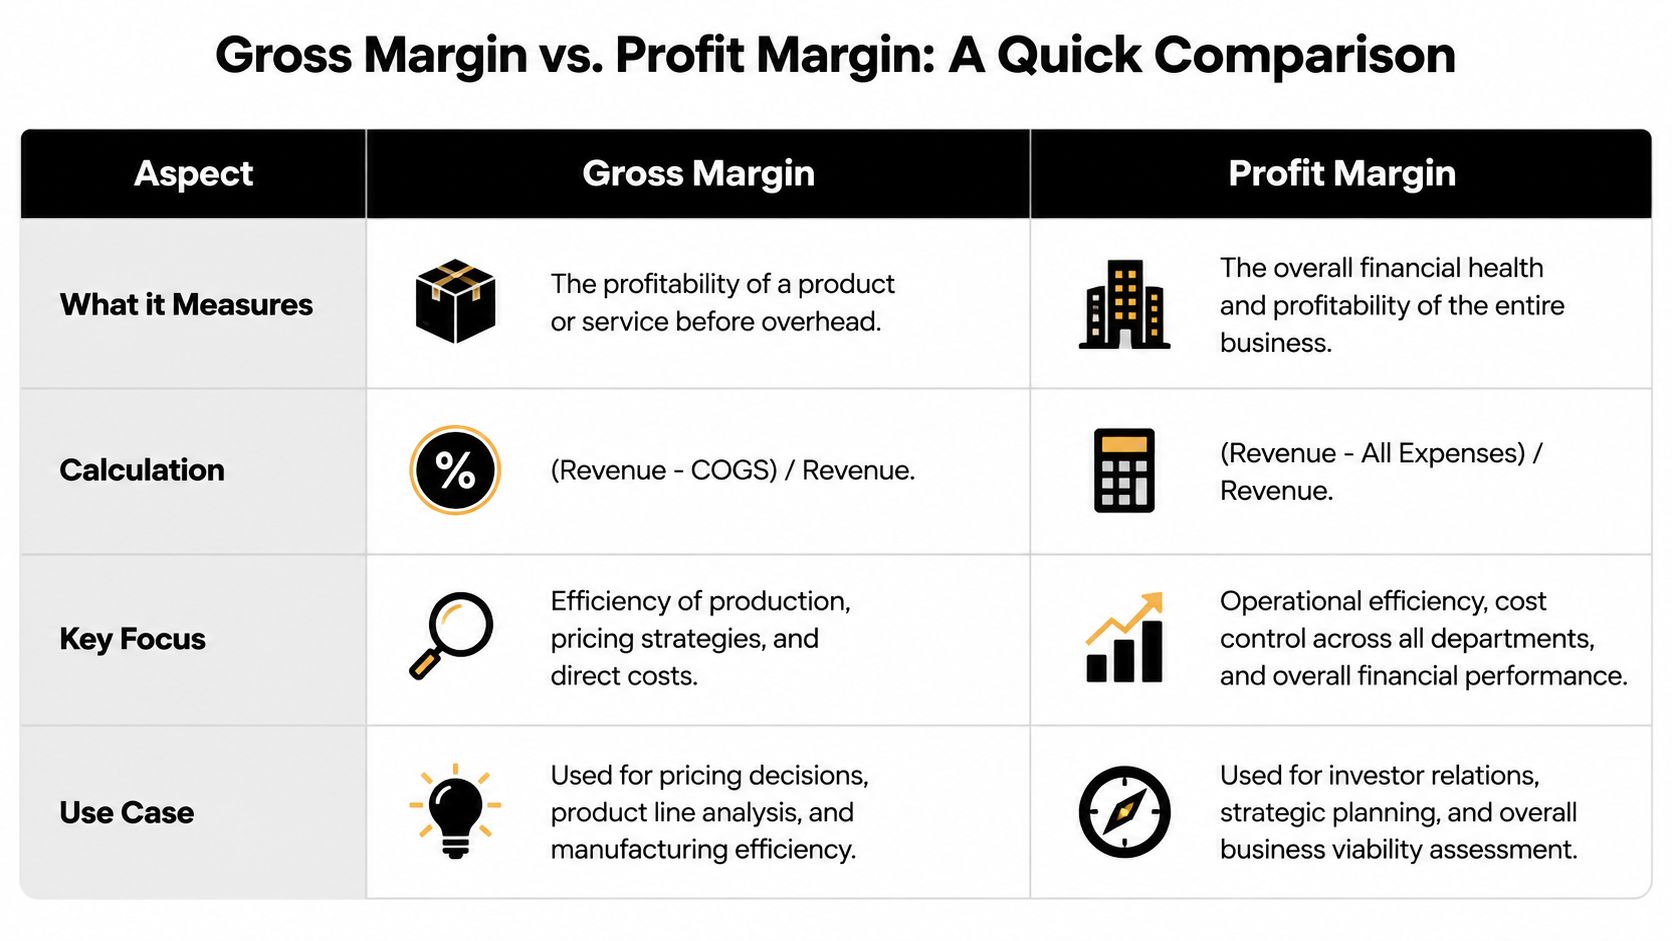
Criteria | Gross margin | Profit margin, net |
|---|---|---|
What it measures | Revenue left after direct costs | Revenue left after all business expenses |
Main costs included | Cost of goods sold, or COGS | COGS, wages, rent, marketing, software, interest and tax |
Primary question | Are our products or services priced and delivered efficiently? | Is the whole business model profitable and sustainable? |
Best used for | Pricing, supplier review, product mix and inventory decisions | Budgeting, cash planning, overhead control and strategic decisions |
Result shown as | A percentage, with gross profit also shown in dollars | A percentage based on net profit |
Table of Contents
Why Strong Sales Don't Always Mean More Cash
A retail founder can be busy packing orders while the bank account gets tighter. The business may be buying stock before customers pay, offering payment terms, absorbing freight increases, and carrying wages and rent regardless of daily sales. Revenue rises, but cash remains trapped in inventory and receivables.
That's why profit margin vs gross margin isn't an accounting terminology exercise. These measures answer different operational questions. Gross margin shows what remains after direct product costs. Profit margin, usually referring to net profit margin in this context, shows what remains after the wider cost of running the company.

The cash gap behind the headline margin
Gross margin doesn't include wage intensity, lease costs, debt servicing or stock holding costs. A company can therefore report an attractive product margin while its operating costs consume the amount needed to produce a meaningful bottom line.
The RBA's analysis of Australian small-business economic and financial conditions shows that operating profit margins vary materially by industry, with hospitality and retail notably lower than other sectors. That difference matters because a food item, clothing line or imported product can carry a reasonable gross return while labour, rent, debt and administration leave little operating profit.
Start with three questions:
What remains after each sale? Use gross margin to test product economics.
What remains after the business operates? Use net profit margin to test the complete model.
Where is cash delayed or consumed? Review stock purchases, customer collections, supplier terms and recurring payments through a cash conversion cycle analysis.
Practical rule: A healthy gross margin is permission to investigate further, not proof that the business is financially healthy.
If the bank balance is falling, don't respond by chasing more sales automatically. More low-margin sales can increase purchasing, fulfilment, payroll and working-capital pressure. First identify whether the leak sits in pricing, COGS, overheads, payment timing or inventory.
Gross Margin The Health of Your Products
Gross margin is the percentage of revenue left after COGS has been deducted. COGS covers direct costs associated with producing or acquiring the goods or services sold. For a retailer, that may include the supplier cost of stock. For a manufacturer, it may include direct materials and production costs. The exact classification should be consistent, because moving costs between COGS and overheads changes the reported margin.
The core formula is:
Gross margin = (Revenue − COGS) ÷ Revenue × 100
Gross profit is the dollar amount produced by the same calculation. Australian business guidance, including Xero's explanation of gross profit margin, distinguishes the dollar result from the percentage result. Both matter, but they support different decisions.
A worked Australian example
Suppose an Australian company generates $500,000 in revenue and records $200,000 in COGS. Its gross profit is $300,000, and its gross profit margin is 60%, as shown in this Australian gross-margin example from ScaleSuite.
The calculation is:
Revenue: $500,000
COGS: $200,000
Gross profit: $500,000 − $200,000 = $300,000
Gross margin: $300,000 ÷ $500,000 × 100 = 60%
That 60% means $0.60 of every sales dollar remains before overheads. It doesn't mean the company has $300,000 available to distribute or spend freely. Wages, rent, freight not classified as COGS, software, marketing, finance costs, tax and other expenses still need to be paid.

What gross margin tells a founder
Gross margin is most useful when you break it down by product, category, customer, channel or service line. A company-wide figure can hide a weak product that sells heavily, or a high-margin product that customers rarely buy.
Use it to test:
Pricing: Does the selling price leave enough room after direct costs?
Supplier terms: Have purchase prices, minimum orders or freight changed?
Discounting: Do promotions generate useful contribution, or do they instead increase low-return volume?
Product mix: Which categories deserve more stock, sales attention or marketing?
Production discipline: Are waste, rework, returns or direct labour reducing the expected return?
For a quick calculation, the Calcolatore ELECTE margine lordo can help translate revenue and direct cost inputs into a margin percentage. You can also follow a practical guide to calculating gross profit margin, then apply the same method consistently across your reporting.
The limitation is equally important. Gross margin tells you whether the offer works at the direct-cost level. It doesn't tell you whether the company has enough volume, cost control or cash discipline to support itself.
Profit Margin The Health of Your Business
A business can report strong gross margins and still leave its founder asking why the bank balance is weak. Net profit margin explains what remains after the full operating model has taken its share.
Net profit margin measures what the business keeps after all relevant expenses have been deducted. It starts with revenue, removes COGS, then accounts for operating expenses, interest and tax. That makes it a company-level measure, not a product-level measure.
The formula is:
Net profit margin = Net income ÷ Revenue × 100
Net income is the amount left after the full cost base has been recognised. That includes wages, rent, marketing, administration, software subscriptions, insurance, interest and tax where applicable. Gross profit is a dollar amount, gross margin is a percentage, and net profit margin addresses whether the wider business model can support itself.
Continuing the example
Return to the company with $500,000 in revenue, $200,000 in COGS and $300,000 in gross profit. The gross result shows what remains after direct costs, but it does not show the cash or profit left after paying the team, premises, customer acquisition, systems and financing.
Subtract operating costs and other expenses from gross profit to calculate net income. Divide that result by revenue to produce the net profit margin. Each expense reduces the revenue available as profit, and many of those payments leave the bank account before the accounting result is reviewed.
That is why a product range can have a strong gross margin while the company produces a weak net margin. A labour-heavy operating model, expensive premises, high acquisition costs, substantial finance commitments or excessive administrative complexity can absorb the gross profit.

The decision this metric supports
Net profit margin shows whether growth is strengthening the company or increasing workload and financial exposure. If revenue rises while net margin falls, examine the cost required to generate each additional sale and the timing of those payments.
Review:
Wages: Is staffing growing faster than profitable activity?
Rent and facilities: Does the premises cost match the revenue capacity it supports?
Marketing: Are campaigns producing profitable customers, rather than sales that consume cash?
Software and administration: Are overlapping systems creating recurring waste?
Interest and tax: Can financing commitments be carried through slower periods?
Net profit margin also separates a planned investment phase from a structurally weak model. Higher overhead may be sensible when it supports a clear return, but the owner still needs to know whether trading cash can fund the decision without relying on additional borrowing.
A gross margin problem usually starts with the offer or direct costs. A net margin problem may sit anywhere across the operating model.
The remedy depends on the diagnosis. Raising prices may improve gross margin but will not solve excessive rent. Cutting supplier costs may strengthen a product line but will not fix unproductive labour. Net margin gives the founder the wider view needed to connect operating choices with profit and cash availability.
Gross Margin vs Profit Margin at a Glance
The cleanest way to remember the difference is to match each metric to the decision it can support. Gross margin is closer to the product. Net profit margin is closer to the business owner's final economic outcome.
Criteria | Gross margin | Profit margin, net |
|---|---|---|
Scope | Product, category, service or channel | Entire business |
Costs included | COGS and other consistently defined direct costs | COGS, operating expenses, interest and tax |
Key question | Is pricing and direct-cost control working? | Is the whole model sustainable? |
Financial result | Gross profit percentage | Net profit percentage |
Useful decisions | Pricing, supplier negotiation, product mix and inventory | Budgeting, hiring, debt, growth and overhead control |
Main blind spot | Doesn't show the full cost of operating the business | Can hide which individual products create or destroy value |
A product may have a strong gross margin but require expensive storage, frequent returns or heavy customer support. Those costs may appear outside COGS, depending on the accounting policy, yet they still affect the company's final profit and cash position.
Conversely, a lower gross-margin product can sometimes contribute meaningfully if it sells reliably, requires little support and converts stock into cash quickly. You shouldn't judge it from the percentage alone. Review the margin alongside sales volume, inventory movement, payment timing and operating resources.
This video provides another visual explanation of the distinction:
The practical sequence is simple. Use gross margin to decide whether a sale, product or service is economically sound. Use net profit margin to decide whether the organisation around those sales is affordable.
Using Margins to Make Smarter Business Decisions
Margins become valuable when they change what you do next. A report that shows gross and net figures without connecting them to pricing, stock, staffing or cash planning is descriptive, not useful.
Pricing and product mix
Start at the item level. Compare gross margin across products and services, then examine whether the higher-margin offerings also generate dependable demand and acceptable fulfilment effort.
A low gross margin may indicate:
supplier pricing has increased
discounts are too aggressive
freight or packaging is being missed from direct costs
returns, wastage or rework are higher than expected
the price no longer reflects the cost of delivering the offer
Don't raise every price by the same amount. A broad increase may damage demand where customers are price-sensitive, while leaving a high-value or differentiated offer underpriced. Test the commercial logic by product category and customer segment.
For sales reporting, a tool such as calculate true profit fast can help clarify the revenue figure before you assess the resulting margin. The quality of the decision depends on using net sales consistently, rather than treating gross sales as money the business retains.
Inventory management
Inventory can create a strange result. The product margin may look healthy when the item sells, but stock that sits on shelves has already consumed cash. The business has paid suppliers, storage costs may continue, and the owner may need to reorder faster-moving lines before the original stock converts back into cash.
Use gross margin by category alongside:
stock age and movement
supplier payment timing
order quantities
markdown and return exposure
cash required for the next purchasing cycle
A product that earns a good margin but turns slowly can create more cash pressure than a lower-margin line that sells consistently. That doesn't make the lower-margin item automatically better. It means the decision needs both return per sale and cash timing.
Operational efficiency
When gross margin is stable but net profit margin falls, look below the gross-profit line. Rising wages, rent, marketing, software, administration and finance costs can absorb the amount that product sales appear to generate.
Australian benchmarks demonstrate why context matters. ScaleSuite's industry benchmark guidance reports professional services gross margins around 50% to 70%, retail and ecommerce around 25% to 45%, trades around 35% to 50%, and hospitality gross margins often around 55% to 65% but net margins around 2% to 5%. These ranges shouldn't become rigid targets. They show why an owner must compare like with like, particularly where labour and rent intensity differ.
Cash flow forecasting
Profit and cash aren't interchangeable. A profitable sale may be unpaid, tied up in stock, or followed by a supplier payment before the customer settles. Tax, loan repayments and asset purchases can also reduce the bank balance without appearing as ordinary operating expenses in the same way.
Build a forecast that connects:
expected sales and collection timing
gross margin by major category
supplier and payroll commitments
recurring overheads
tax, debt and planned purchases
opening and projected closing cash
Net profit margin helps estimate whether the model creates value over time. The cash forecast shows whether the business can survive the timing between paying out and collecting in.
How to Track and Benchmark Your Margins Effectively
Margin tracking works when it becomes part of the operating rhythm, not an annual accounting exercise. The owner needs a consistent definition of revenue, COGS, operating expenses and net profit. Without that consistency, a changing margin may reflect classification decisions rather than a real change in performance.
Build a reporting rhythm
Review gross margin at the level where decisions happen. For an ecommerce business, that may be by product and category. For a trade business, it may be by job type or customer. For a service firm, it may be by service line and delivery team.
A practical reporting pack should show:
revenue and gross profit
gross margin by product or service
net profit margin for the whole business
major overhead movements
inventory and receivables pressure
actual cash against forecast
actions, owners and due dates
The frequency should reflect how quickly the business can change. Product costs, pricing and stock decisions often need closer attention than annual reporting. Net profit margin deserves regular management review because overhead commitments can build gradually while sales remain strong.
Use a financial ratio analysis framework to place margins beside liquidity, debt and operating measures. A margin that looks acceptable in isolation may sit alongside weak cash coverage or excessive stock investment.
Compare with the right benchmark
A generic “good margin” answer can mislead an Australian SME. The ATO small business benchmarks are built from 1.9 million tax returns across 100 industries, giving owners an industry-specific reference point rather than a universal target.
Use benchmarks as a diagnostic, not a verdict. If your result differs from comparable businesses, ask whether the cause is pricing, wages, occupancy, freight, stock, customer mix, financing or an unusual growth phase. Then choose one controllable driver and test an action against the next reporting period.
Official data also reinforces the need for caution. The ABS Business Indicators reported company gross operating profits at 0.0% quarterly growth in seasonally adjusted terms and down 2.4% year on year, while the RBA noted that small-business profit margins were around pre-pandemic averages for most small businesses as of March 2024. Those figures don't diagnose an individual company, but they do show why owners shouldn't assume that revenue growth will automatically improve profitability.
The founder question is therefore not, “Which margin is better?” It's, “Which margin matches the decision I'm making, and what does the cash forecast say?” Track both, investigate the gap, and turn each variance into a specific operational action.
Nexist helps Australian founders connect margin reporting with cash-flow forecasting, KPI management and practical fixes across pricing, inventory, receivables and operations. Visit Nexist to explore virtual CFO support that turns margin data into clearer decisions and more cash control.
profit margin vs gross margin, business finance, sme profitability, financial kpis, cash flow management

" width="24px"/><g d="M 0 24.129 L 0 0.129 L 24 0.129 L 24 24.129 Z M 0 24.129 L 0 0.129 L 24 0.129 L 24 24.129 Z M 24 3 C 24 1.344 22.656 0 21 0 L 3 0 C 1.344 0 0 1.344 0 3 L 0 21 C 0 22.656 1.344 24 3 24 L 21 24 C 22.656 24 24 22.656 24 21 Z M 6.883 8.375 L 2.863 8.375 L 2.863 20.467 L 6.883 20.467 Z M 4.899 2.545 C 3.524 2.545 2.625 3.449 2.625 4.634 C 2.625 5.795 3.496 6.724 4.846 6.724 L 4.872 6.724 C 6.273 6.724 7.146 5.795 7.146 4.634 C 7.12 3.449 6.274 2.545 4.899 2.545 Z M 16.747 8.09 C 14.614 8.09 13.659 9.263 13.124 10.086 L 13.124 8.374 L 9.105 8.374 C 9.159 9.508 9.105 20.466 9.105 20.466 L 13.124 20.466 L 13.124 13.713 C 13.124 13.352 13.15 12.99 13.257 12.732 C 13.547 12.01 14.209 11.262 15.319 11.262 C 16.773 11.262 17.355 12.372 17.355 13.996 L 17.355 20.466 L 21.374 20.466 L 21.374 13.532 C 21.374 9.818 19.391 8.09 16.747 8.09 Z" fill="transparent" height="24.12890599668026px" id="dSFdkJotL" width="24px"><path d="M 0 24 L 0 0 L 24 0 L 24 24 Z" fill="transparent" height="24px" id="wscNJE44G" transform="translate(0 0.129)" width="24px"/><g d="M 0 24.129 L 0 0.129 L 24 0.129 L 24 24.129 Z M 24 3 C 24 1.344 22.656 0 21 0 L 3 0 C 1.344 0 0 1.344 0 3 L 0 21 C 0 22.656 1.344 24 3 24 L 21 24 C 22.656 24 24 22.656 24 21 Z M 6.883 8.375 L 2.863 8.375 L 2.863 20.467 L 6.883 20.467 Z M 4.899 2.545 C 3.524 2.545 2.625 3.449 2.625 4.634 C 2.625 5.795 3.496 6.724 4.846 6.724 L 4.872 6.724 C 6.273 6.724 7.146 5.795 7.146 4.634 C 7.12 3.449 6.274 2.545 4.899 2.545 Z M 16.747 8.09 C 14.614 8.09 13.659 9.263 13.124 10.086 L 13.124 8.374 L 9.105 8.374 C 9.159 9.508 9.105 20.466 9.105 20.466 L 13.124 20.466 L 13.124 13.713 C 13.124 13.352 13.15 12.99 13.257 12.732 C 13.547 12.01 14.209 11.262 15.319 11.262 C 16.773 11.262 17.355 12.372 17.355 13.996 L 17.355 20.466 L 21.374 20.466 L 21.374 13.532 C 21.374 9.818 19.391 8.09 16.747 8.09 Z" fill="transparent" height="24.12890599668026px" id="sTpjGo1tb" width="24px"><path d="M 0 24 L 0 0 L 24 0 L 24 24 Z" fill="transparent" height="24px" id="s7ffpmKOD" transform="translate(0 0.129)" width="24px"/><g d="M 24 3 C 24 1.344 22.656 0 21 0 L 3 0 C 1.344 0 0 1.344 0 3 L 0 21 C 0 22.656 1.344 24 3 24 L 21 24 C 22.656 24 24 22.656 24 21 Z M 6.883 8.375 L 2.863 8.375 L 2.863 20.467 L 6.883 20.467 Z M 4.899 2.545 C 3.524 2.545 2.625 3.449 2.625 4.634 C 2.625 5.795 3.496 6.724 4.846 6.724 L 4.872 6.724 C 6.273 6.724 7.146 5.795 7.146 4.634 C 7.12 3.449 6.274 2.545 4.899 2.545 Z M 16.747 8.09 C 14.614 8.09 13.659 9.263 13.124 10.086 L 13.124 8.374 L 9.105 8.374 C 9.159 9.508 9.105 20.466 9.105 20.466 L 13.124 20.466 L 13.124 13.713 C 13.124 13.352 13.15 12.99 13.257 12.732 C 13.547 12.01 14.209 11.262 15.319 11.262 C 16.773 11.262 17.355 12.372 17.355 13.996 L 17.355 20.466 L 21.374 20.466 L 21.374 13.532 C 21.374 9.818 19.391 8.09 16.747 8.09 Z" fill="transparent" height="24.000006px" id="D0ecaHEcW" transform="translate(0 0)" width="24px"><path d="M 24 3 C 24 1.344 22.656 0 21 0 L 3 0 C 1.344 0 0 1.344 0 3 L 0 21 C 0 22.656 1.344 24 3 24 L 21 24 C 22.656 24 24 22.656 24 21 Z" fill="rgb(55, 184, 218)" height="24.000006px" id="IPLFE6zXx" width="24px"/><path d="M 4.02 0 L 0 0 L 0 12.092 L 4.02 12.092 Z" fill="rgb(255, 255, 255)" height="12.09201px" id="FWhtzAyuY" transform="translate(2.863 8.375)" width="4.02px"/><path d="M 2.274 0 C 0.899 0 0 0.904 0 2.089 C 0 3.25 0.871 4.179 2.221 4.179 L 2.247 4.179 C 3.648 4.179 4.521 3.25 4.521 2.089 C 4.495 0.904 3.649 0 2.274 0 Z" fill="rgb(255, 255, 255)" height="4.17876px" id="VmOsKv4kO" transform="translate(2.625 2.545)" width="4.52095px"/><path d="M 7.641 0 C 5.509 0 4.554 1.173 4.019 1.996 L 4.019 0.284 L 0 0.284 C 0.053 1.419 0 12.376 0 12.376 L 4.019 12.376 L 4.019 5.623 C 4.019 5.262 4.045 4.9 4.151 4.642 C 4.442 3.92 5.103 3.172 6.214 3.172 C 7.667 3.172 8.25 4.282 8.25 5.907 L 8.25 12.376 L 12.269 12.376 L 12.269 5.442 C 12.269 1.728 10.286 0 7.641 0 Z" fill="rgb(255, 255, 255)" height="12.37626px" id="n1XUbhaq0" transform="translate(9.105 8.09)" width="12.268830000000001px"/></g></g></g></g></svg>)