
Financial Ratio Analysis: A Founder's 2026 Guide for AU SMEs
Master financial ratio analysis with our 2026 founder's guide. Learn key formulas, AU SME benchmarks, & actionable insights for cash flow and profit.
Ansh Malhotra

You're probably doing what most founders do. You log into Xero, glance at the bank balance, check whether sales look decent, and make a call from there. If cash is tight, you feel stress. If cash looks healthy, you breathe out. Then payroll, supplier bills, BAS, stock reorders, and overdue invoices pull you straight back into the weeds.
That approach is too shallow. A healthy bank balance can hide weak margins, bloated inventory, slow collections, or a debt position that's increasingly harder to carry. A profitable month can sit on top of ugly working capital. And a strong sales run can make cash flow worse if operations aren't keeping up.
Financial ratio analysis fixes that. It turns your reports into a decision tool. Not an accountant's exercise. Not a boardroom vanity deck. A working diagnostic that tells you where cash is leaking, where profit is being squeezed, and where founder time is getting wasted.
Table of Contents
Beyond the Bank Balance Understanding Your Numbers
A founder I speak to often has the same problem in different clothes. Revenue is moving. Bills are being paid. The team is busy. Yet they can't answer simple questions quickly.
Are we liquid? Are we pricing properly? Is debt helping or hurting? Is inventory working for us or trapping cash?
That's where financial ratio analysis earns its place. It forces clarity by measuring relationships between the numbers, not just the numbers themselves. A bank balance is a snapshot. A ratio tells you whether the engine underneath that balance is healthy.
Practical rule: If you only look at profit and cash, you'll react late. Ratios show stress earlier.
Financial ratio analysis serves as a business health check. Your P&L might show profit, but your current ratio can reveal short-term pressure. Your sales report might look strong, but inventory turnover can show stock isn't moving fast enough. Your equity might look solid, but debt-to-equity tells you whether lenders are starting to own too much of the story.
This matters even more for Australian SMEs where cash gets tied up in stock, debt, payroll timing, and slow-paying customers. Founders don't need more reports. They need fewer numbers with more meaning.
Why the raw figures mislead
Raw figures can flatter a business. Higher revenue might come from discounting. More inventory might make current assets look stronger while cash gets weaker. A larger loan can pad the bank balance while increasing future pressure.
Financial ratio analysis strips away the false comfort. It asks sharper questions:
Can you cover short-term obligations?
Are sales converting into enough gross and net profit?
Are you relying on debt sensibly?
Are your assets, receivables, and stock productive?
What founders should expect from ratios
Good ratios don't just diagnose. They trigger action. If your current ratio is weak, you tighten collections, clean up stock, and manage payables deliberately. If gross margin slips, you audit pricing and cost creep. If turnover slows, you fix operations, not just reporting.
That's the standard to hold. If a ratio doesn't change behaviour, it's just decoration.
Your Business Dashboard The Four Key Ratio Categories
Most founders make ratio analysis harder than it needs to be. You don't need to memorise a finance textbook. You need a clear mental model.
Use this one. Your ratios are your business dashboard.
Think like a driver, not a bookkeeper
When you drive, you don't stare at a hundred dials. You watch a few critical signals. Fuel. Speed. Engine temperature. Warning lights. Business works the same way.
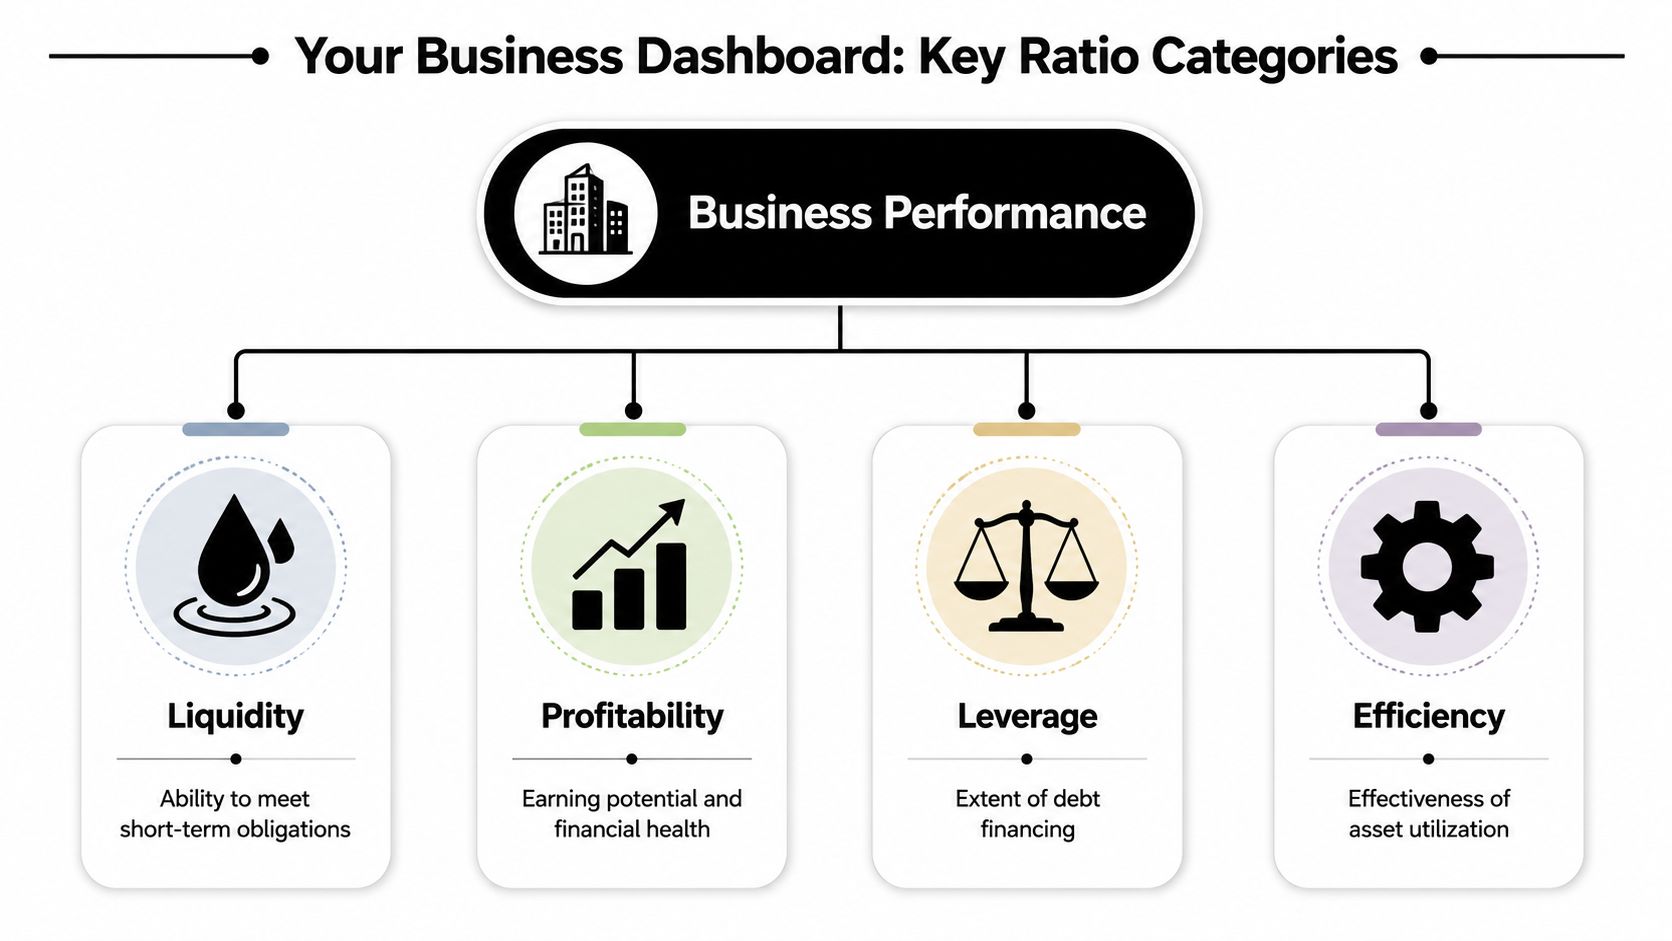
The four categories that matter most are:
Liquidity. This is your fuel gauge. It tells you whether the business can keep moving without choking on short-term obligations.
Profitability. This is engine performance. It tells you whether revenue is creating enough profit to justify the effort, risk, and capital.
Capital Structure. This is your financing mix. It tells you how much of the business is backed by owners versus lenders.
Efficiency. This is fuel economy. It tells you how well the business uses stock, receivables, assets, and processes to generate cash and revenue.
If you ignore one category, the others can fool you. A business can be profitable and still illiquid. It can be liquid and still inefficient. It can grow fast and still be heavily indebted.
Key financial ratio categories at a glance
Ratio Category | What It Measures | Example Ratios |
|---|---|---|
Liquidity | Ability to meet short-term obligations | Current Ratio, Quick Ratio |
Profitability | Ability to turn revenue into profit | Gross Profit Margin, Net Profit Margin |
Leverage | Reliance on debt versus equity | Debt-to-Equity, Debt-to-Assets |
Efficiency | How well assets and working capital are used | Inventory Turnover, Days Sales Outstanding |
What each category is really asking
Liquidity asks one blunt question. Can you pay what's due soon without drama? If the answer is shaky, growth won't save you. More sales can add pressure if cash collection and stock discipline are poor.
Profitability asks whether your model works. Not whether customers like you. Not whether turnover is up. Whether enough profit remains after direct costs and overhead to build a durable business.
A founder who confuses revenue growth with financial strength usually discovers the mistake in their cash flow.
How a business structures its finances influences its control and resilience. Debt can be useful. Sensible debt can fund equipment, inventory, expansion, or working capital. But too much debt reduces room to manoeuvre. It makes ordinary trading volatility feel like an emergency.
Efficiency is the category founders underestimate most. It captures the daily mechanics of the business. How quickly stock moves. How long customers take to pay. Whether assets earn their keep. Hidden cash leaks often manifest in these operational details.
The no-nonsense way to use the dashboard
Don't build a dashboard with every ratio you've ever heard of. Most SMEs need a short, disciplined set.
Start with one or two ratios from each category. Review them monthly. For cash-sensitive businesses, review parts of the dashboard weekly. If you're inventory-heavy or carrying debt, watch efficiency and debt levels closely. If you're service-led, margins and receivables usually deserve more attention.
The job isn't to admire the dashboard. The job is to use it to run the business harder and cleaner.
The Vital Signs Key Ratios with Formulas and Examples
It's Monday morning. Sales looked strong last month, yet cash is tight, supplier calls are stacking up, and you're still approving payments manually because no one trusts the numbers. That's exactly why ratios matter. They turn a messy set of reports into a short list of operating signals you can act on.
Use these ratios to make decisions, assign owners, and build them into your dashboard. If a number moves, someone should know what to do within the hour, not after month-end.
Liquidity ratios that protect survival
1. Current Ratio
Formula:
Current Ratio = Current Assets ÷ Current Liabilities
For many Australian businesses, a current ratio between 1.5 and 2.0 is a sensible reference point, and a ratio below 1.0 is a clear warning sign, based on Business Queensland's financial ratio guidance.
Example:
A trade business has cash, receivables, and inventory sitting in current assets. Its current liabilities include supplier bills, wages, GST, and short-term debt. If current assets are 1.6 times current liabilities, the business has more breathing room than one sitting at 0.9.
Interpretation:
Don't stop at the formula. A current ratio can look healthy while cash is still under pressure if receivables are old and stock is slow. Put this ratio on your live dashboard beside aged debtors and stock ageing. Otherwise, you are staring at a comfort number.
2. Quick Ratio
Formula:
Quick Ratio = (Current Assets − Inventory) ÷ Current Liabilities
Example:
An ecommerce business can show a decent current ratio because the warehouse is full. Strip inventory out and the quick ratio often shows the true position fast.
Interpretation:
This ratio matters most when stock is hard to move, seasonal, or exposed to discounting. If the quick ratio is weak, tighten purchasing, clear dead stock, and review payment terms immediately. Then build that rule into your purchasing SOP so the same problem doesn't return next quarter.
Profitability ratios that show economic reality
3. Gross Profit Margin
Formula:
Gross Profit Margin = (Revenue − Cost of Goods Sold) ÷ Revenue
Example:
A product business can increase sales and still get poorer if direct costs rise faster than pricing. Freight, supplier increases, discounting, and waste all hit this number first.
Interpretation:
Gross margin is your first operating filter. If it drops, fix pricing, purchasing, packaging, freight recovery, or product mix before you chase more sales. Founders who miss this end up buying revenue.
If you want a practical walkthrough on setting it up correctly, this gross profit margin calculation guide is worth reading.
4. Net Profit Margin
Formula:
Net Profit Margin = Net Profit ÷ Revenue
Example:
A services firm can post solid revenue and still finish with a weak net margin once wages, software, subcontractors, rework, and admin bloat are accounted for.
Interpretation:
Net margin shows what survives. Watch it monthly. If it slips, don't respond with vague cost-cutting. Split the problem properly: labour efficiency, pricing discipline, overhead creep, or low-quality revenue. Then assign each fix to an owner and track it in your reporting pack.
For founders in people-heavy models, this guide for CFOs on PEO profitability is useful because it shows how staffing structure changes profitability ratios.
Debt ratios that keep capital structure under control
5. Debt-to-Equity Ratio
Formula:
Debt-to-Equity Ratio = Total Liabilities ÷ Owner's Equity
Example:
If your business carries $600,000 in liabilities and $400,000 in owner's equity, the debt-to-equity ratio is 1.5.
Interpretation:
This ratio tells you how heavily the business depends on outside funding versus owner capital. If it climbs too far, repayments start dictating decisions. That limits room to handle slow months, invest in growth, or absorb mistakes. Put a threshold on your dashboard and review it before taking on new finance, not after cash gets tight.
6. Debt-to-Assets
Formula:
Debt-to-Assets = Total Debt ÷ Total Assets
Example:
A wholesaler with financed vehicles and large stock holdings may carry debt safely if those assets turn quickly and produce reliable cash. The same ratio in a slow-moving business is dangerous.
Interpretation:
Use this ratio to test whether your balance sheet is getting stronger or just bigger. If debt is rising faster than productive assets, fix the issue early. Slow capex, improve stock turns, or refinance short-term pressure into a structure the business can carry.
Efficiency ratios that expose cash leaks
7. Inventory Turnover
Formula:
Inventory Turnover = Cost of Goods Sold ÷ Inventory
Example:
A retailer can look asset-rich on paper while shelves are packed with lines that barely move. Inventory turnover shows whether stock is converting into sales or trapping cash.
Interpretation:
Low turnover usually points to poor buying discipline, weak forecasting, stale SKUs, or soft demand. Ratio analysis must then become operational. Set reorder points, minimum turn targets, and automated alerts inside your inventory system. If no one owns those controls, the ratio becomes trivia.
8. Days Sales Outstanding
Formula:
Days Sales Outstanding = Accounts Receivable ÷ (Revenue ÷ 365)
Example:
A B2B services firm can show a profit and still struggle to pay wages because customers take too long to settle invoices. DSO measures that delay clearly.
Interpretation:
If DSO rises, cash is getting trapped after the sale. Tighten invoice timing, clean up disputes faster, enforce collections cadence, and automate reminders in your accounting stack. Good founders review DSO. Smart operators build a collections system that stops it drifting in the first place.
Financial ratio analysis works when you read ratios together and connect them to process. A weak current ratio, rising DSO, and slow inventory turnover usually point to one operational problem. Cash is stuck, and your systems are letting it stay there.
Context is King How to Benchmark Your Ratios
It's Monday morning. Sales looked solid last month, profit looked acceptable, and the bank balance still feels tighter than it should. That's what happens when founders judge a ratio in isolation. A number can look fine and still hide a problem that is chewing through cash, margin, or management time.
A single ratio means nothing on its own
A strong gross margin in software can be mediocre in services. A high current ratio can still mask weak cash flow if too much of it sits in slow-moving stock. A debt ratio that suits one business can put another under pressure fast.
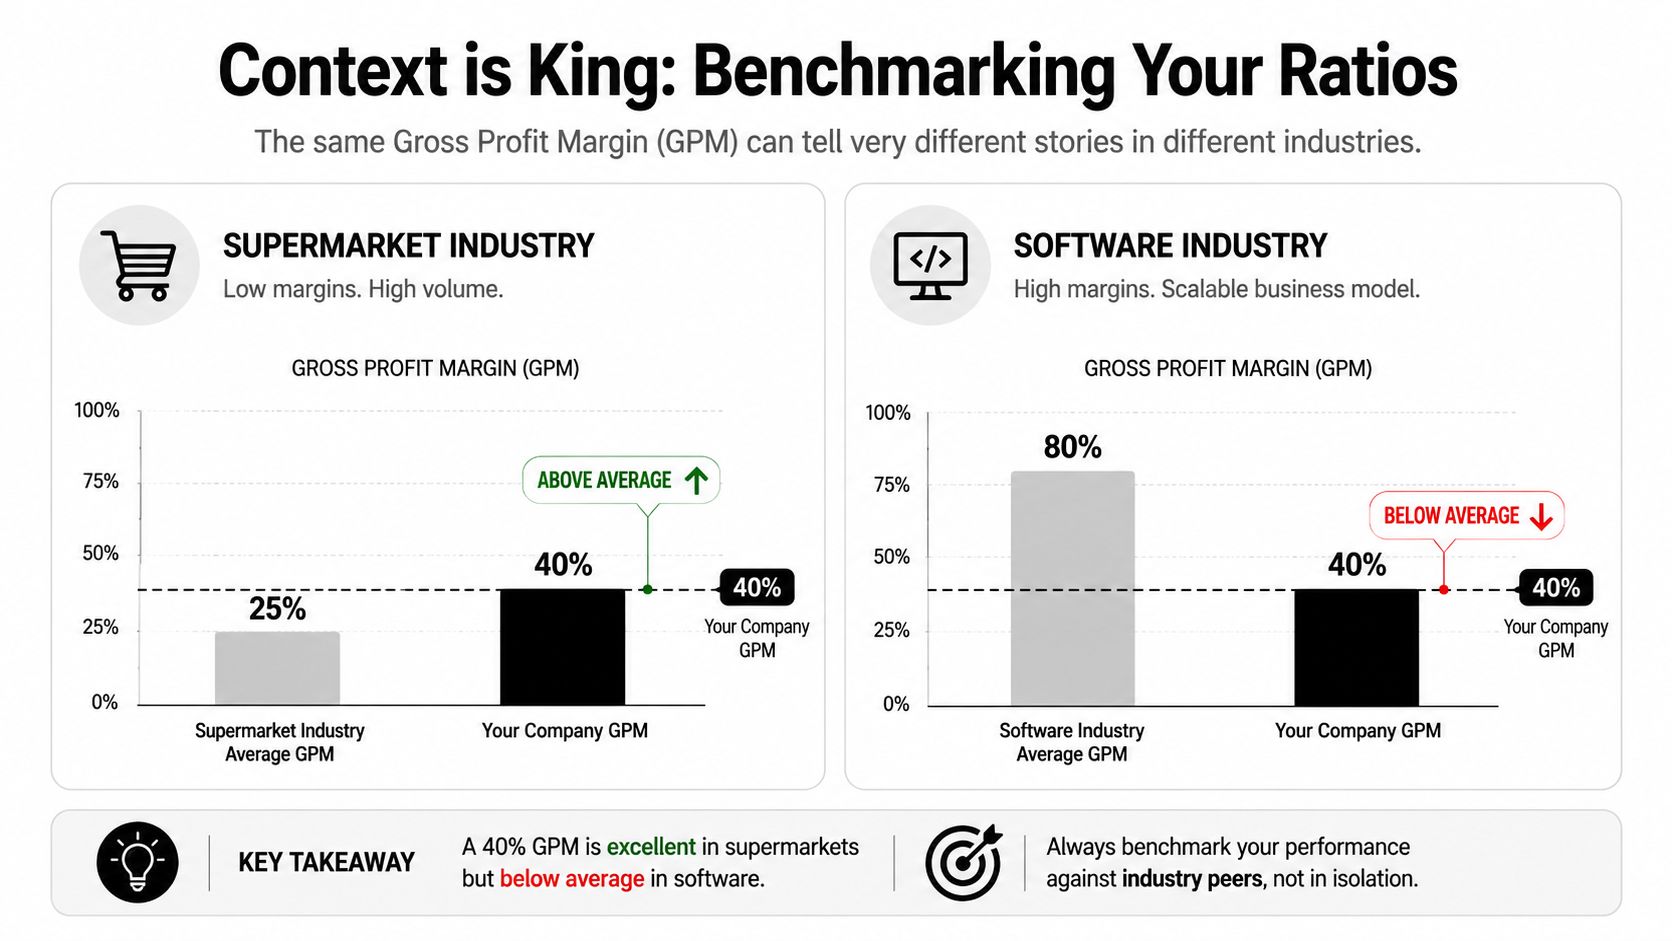
Start with your own trend line.
If gross margin is sliding, receivables are taking longer to collect, or inventory days keep creeping up, the pattern matters more than whether a single month still looks “within range”. Smart founders benchmark against history first because trend exposes operational drift early. Your dashboard should show that drift automatically, and your team should know which ratio triggers a response.
The next comparison is your real peer group. Use businesses with a similar model, sales cycle, pricing structure, and working-capital profile. A wholesale importer should not benchmark itself against a SaaS firm. A project-based agency should not copy the numbers of a subscription business. Lazy benchmarking creates lazy decisions.
Benchmark against history and peers
Use this order:
Compare against your recent reporting periods. This shows whether performance is improving, flat, or slipping.
Compare against businesses that operate like yours. Industry labels are too broad on their own.
Use broad market benchmarks as a sense check. They help with orientation, not target-setting.
For capital structure, broad reference points only give you a rough frame. They do not set your ideal ratio. Your right level of debt depends on cash flow consistency, repayment capacity, asset base, and risk tolerance. If earnings swing month to month, keep the balance sheet tighter. If cash conversion is fast and predictable, you can carry more debt without creating stress.
Working-capital ratios need the same discipline. A current ratio can look healthy while cash is still trapped in stock or unpaid invoices. That is why you should benchmark current ratio alongside debtor days, inventory days, and payables days. Founders who want a sharper operating view should track the cash conversion cycle across receivables, inventory, and payables, not just a headline liquidity number.
Don't benchmark for reassurance. Benchmark to spot where process, pricing, or discipline is failing.
Here's the rule. If a ratio moves, tie it to an operating owner, a workflow, and a control point. Put margin targets into pricing approvals. Put DSO targets into collections SOPs. Put inventory turn targets into purchasing rules and reorder alerts. Benchmarking only matters when it changes behaviour. That is how ratio analysis stops being a finance exercise and becomes a live operating system for growth.
From Red Flags to a Real Action Plan
You log into the bank on Monday. Cash is tighter than expected, margin looked fine last month, and the team is busy, but nobody can tell you which problem matters first or who owns the fix. That is what bad ratio analysis looks like. Plenty of numbers. No operating response.

A ratio only matters when it triggers action. For every red flag, set four things immediately: the likely cause, the owner, the deadline, and the system change that stops the issue repeating. That is how you turn finance from rear-view reporting into an operating tool.
If liquidity is weak
A weak current ratio is rarely just a treasury problem. It usually means cash is getting stuck in receivables, stock, or poor spending discipline. Founders who wait for month-end reports are already late.
Do this next:
Speed up invoicing and collections. Invoice on delivery, not days later. Automate reminders, enforce credit terms, and escalate overdue accounts fast.
Separate real stock from dead stock. Review what sells, what is slowing down, and what should be cleared. Slow inventory is not liquidity.
Prioritise supplier payments. Protect key suppliers first, then match payment timing to expected cash receipts.
Freeze optional spend. Delay non-core hiring, extra software, and low-return projects until cash stabilises.
Then hardwire the fix. Build these steps into automated business process workflows so collections, approvals, and payment timing do not depend on founder memory.
If margins are slipping
Margins do not fall by accident. Something in pricing, purchasing, labour, freight, discounting, or delivery has changed, and your team needs to find it quickly.
Take these steps:
Review margin by product, service, customer, and channel. Some sales create work without creating profit.
Track cost creep line by line. Freight, packaging, materials, subcontractors, and overtime often erode profit.
Cut low-margin complexity. Too many SKUs, custom jobs, exceptions, and handoffs chew up time and margin together.
Fix recurring errors. Rework, credits, write-offs, and scope blowouts are operational failures, not accounting noise.
Do not stop at diagnosis. Change quoting rules, approval limits, purchasing controls, and job scoping SOPs so the same margin leak cannot keep coming back.
If debt is getting uncomfortable
Debt becomes dangerous when repayments depend on a perfect month. If cash flow is uneven and the balance sheet is tight, fix that before the lender starts controlling your options.
Focus on this:
List every facility, repayment date, rate, and security. Many founders carry more debt complexity than they realise.
Split growth debt from survival debt. Debt that funds profitable capacity is different from debt used to cover weak trading.
Simplify your capital structure where possible. Fewer facilities usually means better visibility, cleaner reporting, and easier decisions.
Stop blaming debt for a broken model. Borrowing can support a healthy business. It cannot rescue poor margins or sloppy cash control.
Set a repayment trigger as well. If interest cover drops, or cash forecasting starts missing repeatedly, the response should already be defined.
If efficiency is poor
Poor efficiency traps cash and drags the founder back into daily firefighting. Stock sits too long. Invoices age. Assets stay underused. Admin work gets pushed around the team with no clear owner.
Use direct responses:
If inventory turnover is slow, run an ABC analysis, clear obsolete lines, and reset purchasing rules.
If debtor days are rising, send invoices immediately, tighten terms, and give one person full ownership of collections.
If asset use is weak, identify idle equipment, duplicated tools, unused subscriptions, and wasted capacity.
If manual bottlenecks keep repeating, document the workflow, remove handoffs, and automate routine approvals.
Here is the standard I recommend. Every flagged ratio gets a one-page action plan. One owner. One deadline. One weekly review. One system change. That is the difference between ratio analysis that looks smart in a board pack and ratio analysis that improves cash flow, lifts profit, and gives the owner time back.
Putting Your Ratios to Work Systems and Automation
It's Monday morning. You open the bank account, cash is tighter than expected, and nobody can explain why without digging through three systems and a pile of spreadsheets. That is exactly why ratio analysis needs to move out of the board pack and into the way the business runs every day.

Manual month-end reporting is too slow for an owner who needs to protect cash this week, not explain last month after the damage is done. Founders need live numbers connected to clear responses.
A major gap in current guidance is how AI and real-time data change ratio interpretation. As noted in this Australian financial ratio resource gap summary, most materials still teach manual calculation from static reports and don't explain how automated AR, AP, and inventory systems change the actionability of ratios like Inventory Turnover and Days Sales Outstanding.
Build a live finance engine
Put your core ratios into a dashboard fed by live or near-live systems. For many SMEs, that means data flowing from Xero, inventory software, payroll, POS, ecommerce platforms, and BI tools such as Power BI.
Your dashboard should show four things at a glance:
Liquidity signals such as current ratio movement, overdue receivables, and upcoming payable pressure
Margin signals by product, channel, customer group, or service line
Debt signals such as debt position, repayment load, and interest pressure
Efficiency signals including stock ageing, job recovery, and collection speed
That is only the starting point.
A useful dashboard does more than display ratios. It points to the operational cause. If DSO blows out, you should be able to see which customers are late, which invoices are disputed, and whether the delay started in sales, billing, or collections. If inventory turnover slows, you should see the exact SKUs, locations, and buyers causing the drag on cash.
If your team is still wasting hours on repetitive finance admin, this guide to automating business processes shows where to start.
Turn thresholds into SOPs
A ratio without a trigger is trivia. Set a threshold. Assign an owner. Define the response in advance.
For example:
When receivables hit an ageing threshold, reminder sequences send automatically, disputed invoices are flagged, and overdue accounts move to a named collections owner.
When stock sits beyond target, purchasing rules pause reordering and a clearance workflow starts.
When gross margin drops on a product line, pricing, discounting, and supplier cost review are assigned within the week.
When the current ratio tightens, non-essential spend moves to approval-only until cash stabilises.
This is how founders stop treating ratio analysis as an accounting exercise. The ratio sits in the dashboard, the threshold sits in the SOP, and the action sits with a person who owns the result.
This video gives useful context on modern finance thinking and why connected systems matter more than isolated reports:
The payoff is not faster reporting. It is earlier intervention, fewer surprises, and less founder firefighting.
When AI handles data collection and exception reporting, your finance function stops chasing numbers and starts fixing problems. That is the shift that improves cash flow, protects profit, and gives the owner time back.
From Watchman to Visionary Your Next Step
Founders get stuck in watchman mode when finance only tells them what already went wrong. Financial ratio analysis changes that. It shows what's weakening, what's improving, and what needs action before cash gets tight or profit slips further.
Start small. Pick one liquidity ratio and one profitability ratio. Put them on a live dashboard. Set a threshold. Assign an action when the number moves the wrong way. That's how you stop reacting and start steering.
If you want help turning ratio analysis into a working finance system, Nexist helps Australian founders tighten cash flow, lift margins, build better reporting, and install the SOPs and automation that turn numbers into action.
financial ratio analysis, business finance, kpi dashboard, virtual cfo, cash flow management

" width="24px"/><g d="M 0 24.129 L 0 0.129 L 24 0.129 L 24 24.129 Z M 0 24.129 L 0 0.129 L 24 0.129 L 24 24.129 Z M 24 3 C 24 1.344 22.656 0 21 0 L 3 0 C 1.344 0 0 1.344 0 3 L 0 21 C 0 22.656 1.344 24 3 24 L 21 24 C 22.656 24 24 22.656 24 21 Z M 6.883 8.375 L 2.863 8.375 L 2.863 20.467 L 6.883 20.467 Z M 4.899 2.545 C 3.524 2.545 2.625 3.449 2.625 4.634 C 2.625 5.795 3.496 6.724 4.846 6.724 L 4.872 6.724 C 6.273 6.724 7.146 5.795 7.146 4.634 C 7.12 3.449 6.274 2.545 4.899 2.545 Z M 16.747 8.09 C 14.614 8.09 13.659 9.263 13.124 10.086 L 13.124 8.374 L 9.105 8.374 C 9.159 9.508 9.105 20.466 9.105 20.466 L 13.124 20.466 L 13.124 13.713 C 13.124 13.352 13.15 12.99 13.257 12.732 C 13.547 12.01 14.209 11.262 15.319 11.262 C 16.773 11.262 17.355 12.372 17.355 13.996 L 17.355 20.466 L 21.374 20.466 L 21.374 13.532 C 21.374 9.818 19.391 8.09 16.747 8.09 Z" fill="transparent" height="24.12890599668026px" id="dSFdkJotL" width="24px"><path d="M 0 24 L 0 0 L 24 0 L 24 24 Z" fill="transparent" height="24px" id="wscNJE44G" transform="translate(0 0.129)" width="24px"/><g d="M 0 24.129 L 0 0.129 L 24 0.129 L 24 24.129 Z M 24 3 C 24 1.344 22.656 0 21 0 L 3 0 C 1.344 0 0 1.344 0 3 L 0 21 C 0 22.656 1.344 24 3 24 L 21 24 C 22.656 24 24 22.656 24 21 Z M 6.883 8.375 L 2.863 8.375 L 2.863 20.467 L 6.883 20.467 Z M 4.899 2.545 C 3.524 2.545 2.625 3.449 2.625 4.634 C 2.625 5.795 3.496 6.724 4.846 6.724 L 4.872 6.724 C 6.273 6.724 7.146 5.795 7.146 4.634 C 7.12 3.449 6.274 2.545 4.899 2.545 Z M 16.747 8.09 C 14.614 8.09 13.659 9.263 13.124 10.086 L 13.124 8.374 L 9.105 8.374 C 9.159 9.508 9.105 20.466 9.105 20.466 L 13.124 20.466 L 13.124 13.713 C 13.124 13.352 13.15 12.99 13.257 12.732 C 13.547 12.01 14.209 11.262 15.319 11.262 C 16.773 11.262 17.355 12.372 17.355 13.996 L 17.355 20.466 L 21.374 20.466 L 21.374 13.532 C 21.374 9.818 19.391 8.09 16.747 8.09 Z" fill="transparent" height="24.12890599668026px" id="sTpjGo1tb" width="24px"><path d="M 0 24 L 0 0 L 24 0 L 24 24 Z" fill="transparent" height="24px" id="s7ffpmKOD" transform="translate(0 0.129)" width="24px"/><g d="M 24 3 C 24 1.344 22.656 0 21 0 L 3 0 C 1.344 0 0 1.344 0 3 L 0 21 C 0 22.656 1.344 24 3 24 L 21 24 C 22.656 24 24 22.656 24 21 Z M 6.883 8.375 L 2.863 8.375 L 2.863 20.467 L 6.883 20.467 Z M 4.899 2.545 C 3.524 2.545 2.625 3.449 2.625 4.634 C 2.625 5.795 3.496 6.724 4.846 6.724 L 4.872 6.724 C 6.273 6.724 7.146 5.795 7.146 4.634 C 7.12 3.449 6.274 2.545 4.899 2.545 Z M 16.747 8.09 C 14.614 8.09 13.659 9.263 13.124 10.086 L 13.124 8.374 L 9.105 8.374 C 9.159 9.508 9.105 20.466 9.105 20.466 L 13.124 20.466 L 13.124 13.713 C 13.124 13.352 13.15 12.99 13.257 12.732 C 13.547 12.01 14.209 11.262 15.319 11.262 C 16.773 11.262 17.355 12.372 17.355 13.996 L 17.355 20.466 L 21.374 20.466 L 21.374 13.532 C 21.374 9.818 19.391 8.09 16.747 8.09 Z" fill="transparent" height="24.000006px" id="D0ecaHEcW" transform="translate(0 0)" width="24px"><path d="M 24 3 C 24 1.344 22.656 0 21 0 L 3 0 C 1.344 0 0 1.344 0 3 L 0 21 C 0 22.656 1.344 24 3 24 L 21 24 C 22.656 24 24 22.656 24 21 Z" fill="rgb(55, 184, 218)" height="24.000006px" id="IPLFE6zXx" width="24px"/><path d="M 4.02 0 L 0 0 L 0 12.092 L 4.02 12.092 Z" fill="rgb(255, 255, 255)" height="12.09201px" id="FWhtzAyuY" transform="translate(2.863 8.375)" width="4.02px"/><path d="M 2.274 0 C 0.899 0 0 0.904 0 2.089 C 0 3.25 0.871 4.179 2.221 4.179 L 2.247 4.179 C 3.648 4.179 4.521 3.25 4.521 2.089 C 4.495 0.904 3.649 0 2.274 0 Z" fill="rgb(255, 255, 255)" height="4.17876px" id="VmOsKv4kO" transform="translate(2.625 2.545)" width="4.52095px"/><path d="M 7.641 0 C 5.509 0 4.554 1.173 4.019 1.996 L 4.019 0.284 L 0 0.284 C 0.053 1.419 0 12.376 0 12.376 L 4.019 12.376 L 4.019 5.623 C 4.019 5.262 4.045 4.9 4.151 4.642 C 4.442 3.92 5.103 3.172 6.214 3.172 C 7.667 3.172 8.25 4.282 8.25 5.907 L 8.25 12.376 L 12.269 12.376 L 12.269 5.442 C 12.269 1.728 10.286 0 7.641 0 Z" fill="rgb(255, 255, 255)" height="12.37626px" id="n1XUbhaq0" transform="translate(9.105 8.09)" width="12.268830000000001px"/></g></g></g></g></svg>)