Inventory Management for Manufacturing: A Practical Guide
Master inventory management for manufacturing with proven costing, forecasting and stock control strategies that protect cash flow and lift operational
Ansh Malhotra

The pallets are stacked three high, the finished goods haven't moved in days, and the bank balance still won't cover next Friday's payroll. Your purchasing manager wants to place another order because a supplier's lead time feels unsafe. Sales wants more finished stock to protect service levels. Production wants every component available. Meanwhile, cash is trapped across raw materials, work in progress and products nobody has invoiced yet.
That's the problem with inventory management for manufacturing. It's often treated as a warehouse discipline, when it's a finance decision with operational consequences. Every dollar sitting in stock is a dollar unavailable for suppliers, debt repayments, wages, tax, maintenance or the next production run.
Australian manufacturers are carrying a balance-sheet issue that deserves board-level attention. The Australian Bureau of Statistics manufacturing data valued manufacturing inventories at $1,107 million in December 2025, alongside $1,273 million in sales of goods and services and $373 million in company gross operating profits. The same release recorded a 0.4% quarterly fall in manufacturing inventories, while inventories across the broader business sector fell 0.1%.
The question isn't whether your warehouse looks organised. The question is whether each SKU earns its place by protecting margin or service at an acceptable cash cost.
Table of Contents
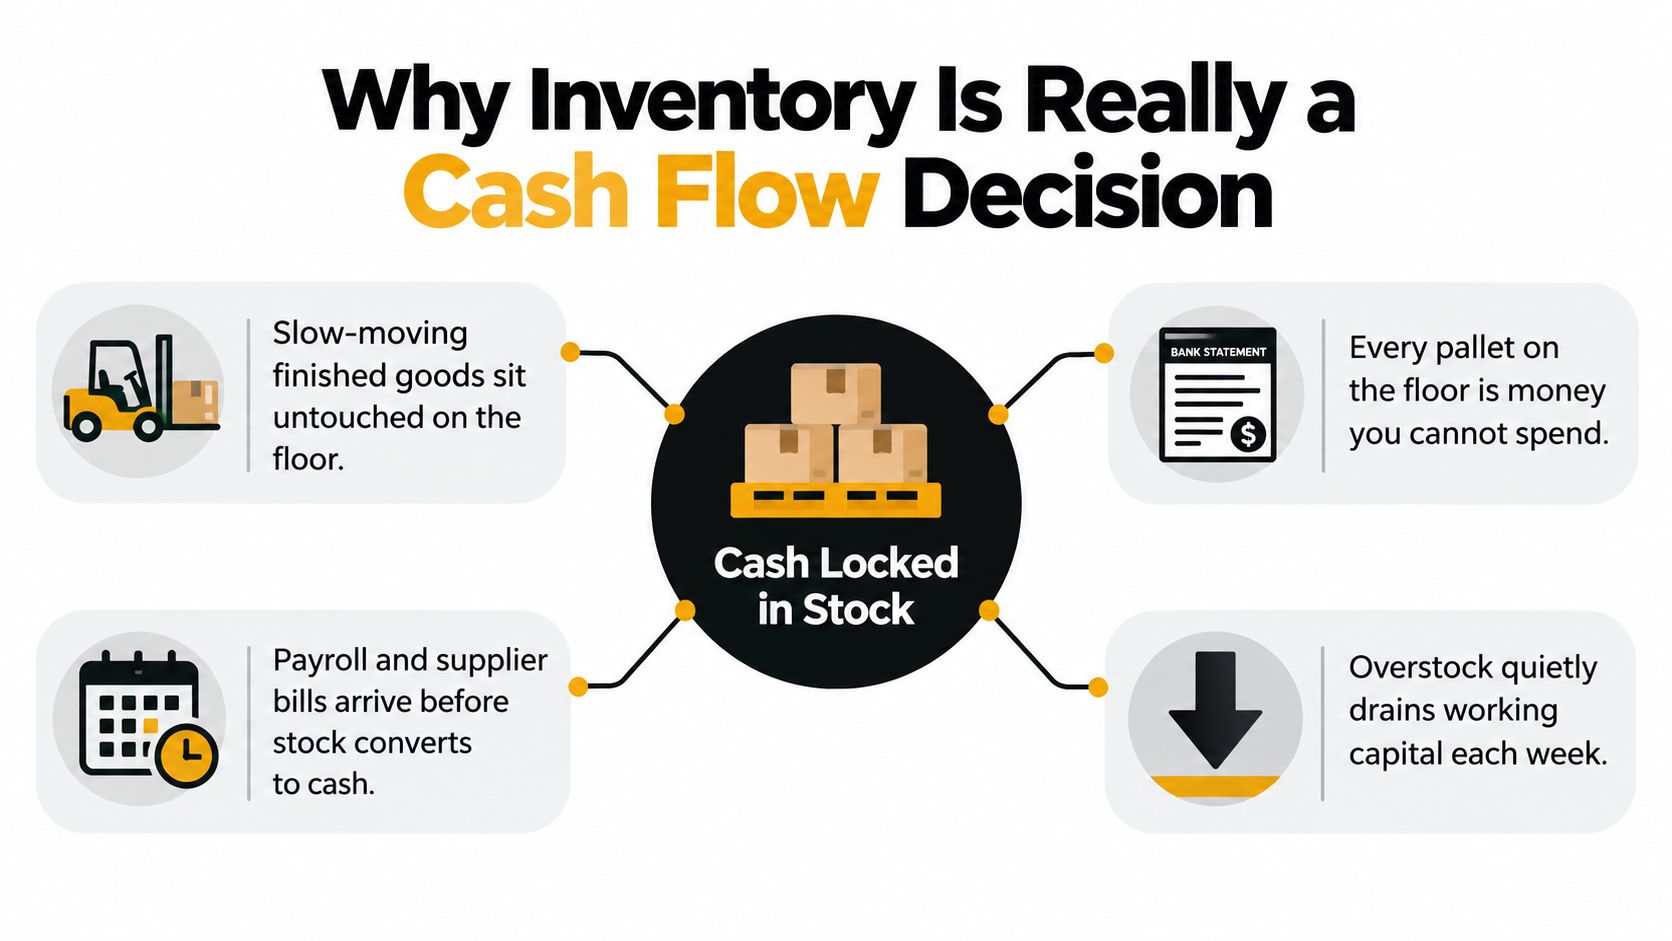
Why Inventory Is Really a Cash Flow Decision
A manufacturing business can report a profit and still run out of cash. That happens when cash leaves the bank for materials, labour and freight long before the customer pays for the finished product. The longer stock stays in the system, the longer your business funds the gap.
The cash conversion cycle connects three moving parts:
Inventory days: How long cash remains tied up in raw materials, WIP and finished goods.
Receivable days: How long customers take to pay after you deliver.
Payable days: How long suppliers effectively finance your purchases.
A pallet in the warehouse isn't an asset in the practical sense if you can't sell it, use it or convert it into cash. It may have an accounting value, but it can't pay a supplier invoice this week.
The factory-floor symptoms
Excess stock usually appears in several forms, not one neat line on the balance sheet:
Raw materials bought for a forecast: The forecast changes, but the material remains.
WIP waiting between work centres: The business has paid for labour and inputs, but the product hasn't reached saleable status.
Finished goods built ahead of demand: Production hit its target, but sales didn't convert the units.
MRO parts with unclear ownership: Maintenance stock prevents downtime, but poorly controlled items become invisible working capital.
The same logic applies to specialist maintenance stock. If your plant relies on critical hydraulic components, a practical resource on MRO inventory hydraulic parts can help your team think about availability, criticality and replenishment together rather than treating every spare as equally urgent.
Finance rule: Don't ask whether you can afford to buy the stock. Ask when that stock will return cash, what risk it protects, and what else the business could fund with the same money.
Judge every technique by three outcomes
A good policy must improve at least one of these without damaging the others:
Working capital: Does it reduce cash locked in stock?
Margin: Does it reduce waste, obsolescence, handling and avoidable purchasing?
Service level: Does it keep production and customer commitments safe?
FIFO, safety stock and reorder points matter because they alter those outcomes. A neat stockroom is useful. A stockroom that releases cash without causing avoidable stoppages is the actual target.
The Costing Methods That Shape Every Number You See
Inventory costing isn't an accounting footnote. It changes reported profit, stock valuation, production variance and the point at which managers believe they need to reorder.
Choose the method for the operating reality
FIFO, or first in, first out, assigns the oldest inventory costs to goods issued first. It suits perishable, dated or traceable materials because the physical flow and accounting flow point in the same direction. When input prices rise, FIFO can also show lower costs on goods issued if older purchases were cheaper, which may increase reported gross margin while newer, more expensive stock remains on hand.
LIFO, or last in, first out, assigns the latest costs to goods issued first. Where it's permitted, it can align current production costs more closely with current purchase prices during inflationary input cycles. Australian SMEs need their accountant to confirm whether this method is available and appropriate for their reporting and tax requirements before relying on it.
Weighted average costing blends purchase costs into a rolling average. It works well for bulk inputs that are materially interchangeable, such as common metals, resins or commodity ingredients. The method smooths price movements, but it can conceal a sharp increase in replacement cost if the average is slow to adjust.
Standard costing assigns an expected cost to a component, labour step or finished product, then tracks the variance between standard and actual cost. It's useful for repeatable bills of materials and stable production routines. It becomes dangerous when standards are stale, because management may celebrate a margin that exists only in the spreadsheet.
For a practical review of how these approaches affect financial reporting, compare your current policy with this guide to inventory valuation methods.
Comparison for a manufacturing SME
Method | Best for | Margin impact | Risk |
|---|---|---|---|
FIFO | Perishable, dated or traceable runs | Can show stronger margin when older costs are lower than current costs | Reported margin may lag replacement cost |
LIFO | Permitted environments with volatile raw-material prices | Can align issued cost more closely with recent purchase prices | May not suit Australian reporting or tax treatment |
Weighted average | Bulk, interchangeable commodities | Smooths cost volatility | Can hide current replacement-cost pressure |
Standard cost | Repeatable bills of materials and routings | Makes variance visible against an agreed baseline | Stale standards distort margin and purchasing decisions |
Don't switch methods halfway through a financial year to make the profit line look better. That creates a management report nobody can trust. Choose the method with your accountant, document it, and connect the inventory ledger to the chart of accounts so stock valuation, cost of goods sold and production variances reconcile to the same story.
Forecasting Demand and Setting Safety Stock
A forecast is not a prophecy. It's a decision input that tells purchasing and production how much risk the business is willing to fund.
Start with three sources of information. Salespeople know about customer conversations that haven't reached the order book. Production supervisors know which jobs are likely to slip or accelerate. Historical sales show what customers bought, not what the team hoped they'd buy.
Use a forecast you can explain
An SME doesn't need a complex model before it needs clean inputs.
Judgement: Record confirmed projects, likely tenders, seasonal changes and customer cancellations separately from historical demand.
Moving average: Average recent monthly demand to soften one-off spikes. Use a consistent period that reflects the product cycle.
Simple exponential smoothing: Give more weight to recent demand when the market is changing, while retaining some history.
Review exceptions: Let a planner override the model only when they record the reason and expected duration.
The moving-average approach is easy to audit in a spreadsheet. The danger isn't simplicity. The danger is allowing an unexplained override to become the new normal.
Safety stock must follow risk
One buffer across every SKU is lazy and expensive. Segment stock by value, demand variability and production criticality.
An A-class item with high usage and a long, unreliable supplier lead time deserves tighter review and a deliberately funded buffer. A B-class item may need a standard replenishment rule. A C-class item may justify a simpler policy, a larger order interval or a controlled substitute.
The standard logic is straightforward:
Safety stock = demand variability during lead time, adjusted for the service level you want.
You can estimate demand variability from the historical spread of daily or weekly usage. You then combine it with lead-time variability and decide how much shortage risk the business accepts. A critical component that stops the plant shouldn't be managed like a low-value packaging item.
Don't forecast around unreliable suppliers
A clean demand forecast won't fix a supplier that routinely misses promised dates. Record actual lead time, order quantity, delivery reliability, quality holds and partial deliveries by supplier. If the supplier data is missing, your safety stock is guesswork dressed as precision.
Practical rule: A higher buffer is not a supplier strategy. First find out whether the supplier is late, inconsistent, poor-quality or simply receiving orders too late for the production plan.
Lead Times, Reorder Points and Production Rhythm
The reorder point is where purchasing should act, not where the warehouse starts to feel uncomfortable. The basic formula is:
Reorder point = average daily demand × lead time + safety stock
That formula only works when lead time reflects reality. If a supplier promises a short average but regularly delivers late, the average hides the risk that matters.
Build the rule around actual production
Production rhythm changes the answer. A component may be available in the warehouse but still unusable because the next run requires a particular grade, lot, certification or tooling setup. Shared machines, changeovers and routing constraints can also make a seemingly small shortage disrupt the schedule.
Tie order releases to the master production schedule. Purchasing should see planned run starts, material requirements and supplier commitments, rather than reacting to the loudest internal request.
Australian inventory conditions make static rules harder to defend. The latest ABS business indicators release reported that manufacturing inventories fell 0.9% in the March 2026 quarter and were down 0.2% year on year. That points to an environment where stock is being reduced while throughput remains exposed to change. Reorder logic needs to respond to current demand and supply conditions, not a fixed annual average.
A simple calculation
Assume a component has average daily demand of 10 units, a supplier lead time of 12 days, and safety stock of 30 units. The reorder point is:
10 × 12 + 30 = 150 units
When available stock plus confirmed inbound supply reaches the policy threshold, the buyer releases the order. If actual lead time changes, the policy changes too.
SKU | Average daily demand | Lead time in days | Safety stock | Reorder point |
|---|---|---|---|---|
Component A | 10 units | 12 | 30 units | 150 units |
The calculation itself is simple. The discipline sits in keeping the inputs current. For a deeper explanation of the mechanics, use this reorder point calculation guide.
Track supplier on-time-in-full performance and review the reorder point when reliability changes. Don't increase every buffer because one supplier missed a delivery. Escalate the supplier, qualify an alternative or change the production plan where possible. Otherwise, the business will pay for the same risk twice, through poor supplier performance and excess stock.
Inventory KPIs Worth Tracking in a Monthly Review
A monthly inventory review must answer three questions: where cash is tied up, what service risk the stock carries, and which items need a decision. Five measures provide a practical control panel, provided the definitions stay consistent and the item master is accurate.
Use the dashboard as a linked system
Inventory turnover measures how often the business uses and replaces average inventory during the period. Higher turnover generally recycles cash faster, but a rise caused by stockouts is a warning, not a success.
Days on hand converts inventory into time. It shows how long current stock can support expected usage or sales. Reduce it only while production continuity and customer service remain protected.
Stock-to-sales ratio compares inventory value with sales value. It exposes a business whose stock is growing faster than its revenue, tying up working capital without improving margin.
Carrying cost as a percentage of inventory value captures the financing, storage, handling, insurance, shrinkage and obsolescence burden assigned by your business. Apply the same definition every month, or the trend becomes unreliable.
Obsolete and slow-moving stock as a percentage of total inventory identifies items requiring clearance, rework, return, write-down or disposal. A report is useful only when someone owns the resulting action.
Grant Thornton's Australian manufacturing benchmark reports average inventory turnover improving from 7.7 to 8.5 between 2023 and 2024. Its 2024 benchmark ranged from 4.1 for businesses up to $40 million in revenue, to 13.0 for the $40 million to $100 million band, and 7.8 for firms above $100 million. These figures are from the Grant Thornton manufacturing benchmarks report.
KPI | Formula in plain English | Healthy direction | SME benchmark range |
|---|---|---|---|
Inventory turnover | Cost of goods used divided by average inventory | Improve without creating shortages | 4.1 to 13.0 in the cited 2024 revenue bands |
Days on hand | Average inventory divided by daily usage or cost of sales | Reduce while service remains protected | Convert your own turnover to days |
Stock-to-sales ratio | Inventory value divided by sales value | Reduce excess stock relative to revenue | Compare with your own trend |
Carrying cost percentage | Annual holding cost divided by inventory value | Reduce the cost of holding each dollar | Establish a consistent internal baseline |
Obsolete and slow-moving percentage | Aged or inactive stock divided by total inventory | Reduce through action, not reclassification | Set an internal tolerance by SKU class |
Review the measures together. Falling turnover usually means days on hand is extending, leaving capital tied up for longer and potentially raising carrying cost. A higher turnover figure deserves no celebration until the slow-mover report confirms that the business has not sold the easy stock while retaining the problem stock. Set an owner and deadline for every exception, then track whether the action releases cash, protects margin or preserves service.
Connecting Inventory to Cash Flow and Margin
Inventory is where a manufacturing profit often goes to hide. The income statement records a sale and a margin, but the balance sheet records the cash that remains trapped in materials, WIP and finished goods.
The cash conversion cycle makes the consequence visible. If inventory takes longer to move, the business funds more production before receiving cash. If customers pay slowly at the same time, the gap widens. If suppliers demand shorter terms, the owner becomes the financier.
Find the leaks by inventory stage
Raw materials: Bulk purchasing may secure a unit price while creating a cash burden. The discount is irrelevant if the input sits unused or becomes unsuitable for the revised product mix.
WIP: WIP accumulates when work centres are unbalanced, jobs wait for inspection or teams release work without a clear next operation.
Finished goods: Forecast-driven production creates stock that looks productive until the customer order fails to arrive.
Consignment stock: Ownership and replenishment rules can become unclear, leaving the manufacturer carrying stock that hasn't converted.
Margin suffers in several ways. Old materials may need a write-down. Finished goods may require discounting. WIP may require rework. Storage, handling and insurance continue while the stock waits.
Connect stock decisions to AR and AP
A profitable order can still consume cash if the customer's payment terms extend beyond the supplier terms plus the time your inventory takes to convert. That isn't automatically bad. Some customer terms support valuable contracts. But the board should see the funding requirement before sales calls it growth.
Board question: Which customers, products and suppliers are forcing the business to finance the longest cash cycle?
Review inventory alongside aged receivables and payable maturity. If the business is collecting late, buying early and producing ahead of demand, the solution isn't another isolated KPI. It's a coordinated working-capital decision.
SOPs, Systems and When to Move Beyond Spreadsheets
“Hold less stock” is not an inventory strategy. It's a blunt instruction that can create stockouts, emergency freight and production downtime.
The safer objective is minimum stock at acceptable risk. Recent Australian manufacturing coverage described average stock on hand falling to A$185,134 in Q2 2026, down 60% year on year, while lead times improved only 3% and purchase-order value fell 67%, according to Australian manufacturing inventory coverage. The warning is clear. Businesses may be reducing stock faster than they're improving visibility, planning and replenishment discipline.
Write the operating rules first
Before buying software, document who owns each decision:
Receiving: Match purchase orders, quantities, quality status and batch information before stock becomes available.
Putaway: Assign locations and status so raw, quarantined, WIP and saleable stock can't be confused.
Replenishment: Define who reviews reorder exceptions and who approves overrides.
Production issue: Record material usage against the correct job, batch and bill of materials.
Cycle counts: Prioritise critical and high-value items, investigate variances and record root causes.
Write-off: Require approval, reason codes and accounting treatment for obsolete or damaged stock.
Real-time visibility across raw materials, WIP and finished goods matters more than scanning alone. A system should connect production schedules, purchasing, cash commitments and supplier risk. That is the practical difference between inventory data and inventory control.
Operational maturity | Minimum SOPs required | Recommended system |
|---|---|---|
Single site, low SKU complexity | Receiving, stock issue, stocktake and write-off rules | Controlled spreadsheet with named owners |
Growing production operation | Add cycle counts, batch traceability, reorder exceptions and supplier reviews | Manufacturing ERP or integrated inventory platform |
Multiple locations or complex WIP | Add location control, production scanning, quality status and inter-site movements | ERP connected to WMS and production planning |
Mixed manufacturing and online sales | Add channel allocation, returns and order synchronisation | ERP with ecommerce integration, such as the principles outlined in this guide to ERP integration for Shopify brands |
A spreadsheet has outgrown its job when two people report different available quantities, production uses unrecorded material, purchase orders aren't linked to demand, or nobody can explain aged stock without a manual investigation. Nexist can support stocktakes, cycle counts, ageing analysis and reorder-point decisions as part of a finance-led inventory review. For teams assessing more advanced automation, review this practical guide to AI inventory management, but don't use AI to automate inaccurate data.
Your 30 90 365 Day Implementation Roadmap
The board does not need another inventory project without an owner. It needs a sequence that turns excess stock into decisions, released cash and protected service levels.
Days 1 to 30
Start with facts. Run a one-week reconciliation across raw materials, work in progress, finished goods and critical maintenance, repair and operating stock. Freeze unexplained adjustments until someone investigates them.
Classify each SKU by value, usage, criticality and movement. Produce an ageing report that assigns an owner and action to every slow-moving item. Return material where suppliers allow it, sell finished goods, consume stock in an alternative product, rework it or write it off. Keeping unusable stock to protect the balance sheet only delays the cash problem.
Calculate carrying cost from your own financing, storage, handling, insurance, shrinkage and obsolescence assumptions. A generic percentage from another manufacturer will distort your margin and working-capital decisions.
Days 31 to 90
Make the planning inputs reliable. Clean supplier lead times, minimum order quantities, batch sizes, bills of materials and production routings. Set safety stock by SKU class, then agree lead-time and delivery-reliability targets with the suppliers that affect production most.
Run a monthly review with five measures:
Inventory turnover.
Days on hand.
Stock-to-sales ratio.
Carrying cost percentage.
Obsolete and slow-moving stock percentage.
Assign an owner to every measure. Require a documented action when performance moves outside the agreed range. A dashboard without ownership is decoration, and it will not release cash.
Days 91 to 365
Embed the SOPs, then select systems against actual operating requirements. Shortlist ERP, WMS and planning tools only after the business can describe its receiving, production, traceability and replenishment workflows. Choose the system that improves stock accuracy and decision speed without creating implementation cost the business cannot fund.
As the Grant Thornton benchmarks cited earlier show, inventory turnover varies across revenue bands. Set targets around your product mix, supplier risk, production design and required service level. Review the target and its cash impact quarterly rather than chasing an industry number that does not fit your operation.
Culture determines whether the system works. Buyers own purchase discipline. Production owns work-in-progress accuracy. Sales owns forecast quality. Finance must challenge the cash impact of every stock decision. Software records behaviour. It does not replace accountability.
Take four items to the next board meeting: stock ageing, cash tied up by inventory stage, supplier lead-time performance and decisions for dead or slow stock. Ask for approval to release cash while protecting the service levels that keep customers and production moving.
Nexist helps Australian manufacturers connect stocktakes, ageing analysis, reorder points, forecasting and working-capital decisions to a practical cash-flow plan. Visit Nexist to start with a finance-led review of inventory tying up cash.
inventory management, manufacturing, SME cash flow, stock control, Australian manufacturing

" width="24px"/><g d="M 0 24.129 L 0 0.129 L 24 0.129 L 24 24.129 Z M 0 24.129 L 0 0.129 L 24 0.129 L 24 24.129 Z M 24 3 C 24 1.344 22.656 0 21 0 L 3 0 C 1.344 0 0 1.344 0 3 L 0 21 C 0 22.656 1.344 24 3 24 L 21 24 C 22.656 24 24 22.656 24 21 Z M 6.883 8.375 L 2.863 8.375 L 2.863 20.467 L 6.883 20.467 Z M 4.899 2.545 C 3.524 2.545 2.625 3.449 2.625 4.634 C 2.625 5.795 3.496 6.724 4.846 6.724 L 4.872 6.724 C 6.273 6.724 7.146 5.795 7.146 4.634 C 7.12 3.449 6.274 2.545 4.899 2.545 Z M 16.747 8.09 C 14.614 8.09 13.659 9.263 13.124 10.086 L 13.124 8.374 L 9.105 8.374 C 9.159 9.508 9.105 20.466 9.105 20.466 L 13.124 20.466 L 13.124 13.713 C 13.124 13.352 13.15 12.99 13.257 12.732 C 13.547 12.01 14.209 11.262 15.319 11.262 C 16.773 11.262 17.355 12.372 17.355 13.996 L 17.355 20.466 L 21.374 20.466 L 21.374 13.532 C 21.374 9.818 19.391 8.09 16.747 8.09 Z" fill="transparent" height="24.12890599668026px" id="dSFdkJotL" width="24px"><path d="M 0 24 L 0 0 L 24 0 L 24 24 Z" fill="transparent" height="24px" id="wscNJE44G" transform="translate(0 0.129)" width="24px"/><g d="M 0 24.129 L 0 0.129 L 24 0.129 L 24 24.129 Z M 24 3 C 24 1.344 22.656 0 21 0 L 3 0 C 1.344 0 0 1.344 0 3 L 0 21 C 0 22.656 1.344 24 3 24 L 21 24 C 22.656 24 24 22.656 24 21 Z M 6.883 8.375 L 2.863 8.375 L 2.863 20.467 L 6.883 20.467 Z M 4.899 2.545 C 3.524 2.545 2.625 3.449 2.625 4.634 C 2.625 5.795 3.496 6.724 4.846 6.724 L 4.872 6.724 C 6.273 6.724 7.146 5.795 7.146 4.634 C 7.12 3.449 6.274 2.545 4.899 2.545 Z M 16.747 8.09 C 14.614 8.09 13.659 9.263 13.124 10.086 L 13.124 8.374 L 9.105 8.374 C 9.159 9.508 9.105 20.466 9.105 20.466 L 13.124 20.466 L 13.124 13.713 C 13.124 13.352 13.15 12.99 13.257 12.732 C 13.547 12.01 14.209 11.262 15.319 11.262 C 16.773 11.262 17.355 12.372 17.355 13.996 L 17.355 20.466 L 21.374 20.466 L 21.374 13.532 C 21.374 9.818 19.391 8.09 16.747 8.09 Z" fill="transparent" height="24.12890599668026px" id="sTpjGo1tb" width="24px"><path d="M 0 24 L 0 0 L 24 0 L 24 24 Z" fill="transparent" height="24px" id="s7ffpmKOD" transform="translate(0 0.129)" width="24px"/><g d="M 24 3 C 24 1.344 22.656 0 21 0 L 3 0 C 1.344 0 0 1.344 0 3 L 0 21 C 0 22.656 1.344 24 3 24 L 21 24 C 22.656 24 24 22.656 24 21 Z M 6.883 8.375 L 2.863 8.375 L 2.863 20.467 L 6.883 20.467 Z M 4.899 2.545 C 3.524 2.545 2.625 3.449 2.625 4.634 C 2.625 5.795 3.496 6.724 4.846 6.724 L 4.872 6.724 C 6.273 6.724 7.146 5.795 7.146 4.634 C 7.12 3.449 6.274 2.545 4.899 2.545 Z M 16.747 8.09 C 14.614 8.09 13.659 9.263 13.124 10.086 L 13.124 8.374 L 9.105 8.374 C 9.159 9.508 9.105 20.466 9.105 20.466 L 13.124 20.466 L 13.124 13.713 C 13.124 13.352 13.15 12.99 13.257 12.732 C 13.547 12.01 14.209 11.262 15.319 11.262 C 16.773 11.262 17.355 12.372 17.355 13.996 L 17.355 20.466 L 21.374 20.466 L 21.374 13.532 C 21.374 9.818 19.391 8.09 16.747 8.09 Z" fill="transparent" height="24.000006px" id="D0ecaHEcW" transform="translate(0 0)" width="24px"><path d="M 24 3 C 24 1.344 22.656 0 21 0 L 3 0 C 1.344 0 0 1.344 0 3 L 0 21 C 0 22.656 1.344 24 3 24 L 21 24 C 22.656 24 24 22.656 24 21 Z" fill="rgb(55, 184, 218)" height="24.000006px" id="IPLFE6zXx" width="24px"/><path d="M 4.02 0 L 0 0 L 0 12.092 L 4.02 12.092 Z" fill="rgb(255, 255, 255)" height="12.09201px" id="FWhtzAyuY" transform="translate(2.863 8.375)" width="4.02px"/><path d="M 2.274 0 C 0.899 0 0 0.904 0 2.089 C 0 3.25 0.871 4.179 2.221 4.179 L 2.247 4.179 C 3.648 4.179 4.521 3.25 4.521 2.089 C 4.495 0.904 3.649 0 2.274 0 Z" fill="rgb(255, 255, 255)" height="4.17876px" id="VmOsKv4kO" transform="translate(2.625 2.545)" width="4.52095px"/><path d="M 7.641 0 C 5.509 0 4.554 1.173 4.019 1.996 L 4.019 0.284 L 0 0.284 C 0.053 1.419 0 12.376 0 12.376 L 4.019 12.376 L 4.019 5.623 C 4.019 5.262 4.045 4.9 4.151 4.642 C 4.442 3.92 5.103 3.172 6.214 3.172 C 7.667 3.172 8.25 4.282 8.25 5.907 L 8.25 12.376 L 12.269 12.376 L 12.269 5.442 C 12.269 1.728 10.286 0 7.641 0 Z" fill="rgb(255, 255, 255)" height="12.37626px" id="n1XUbhaq0" transform="translate(9.105 8.09)" width="12.268830000000001px"/></g></g></g></g></svg>)