How to Calculate Net Working Capital for SMEs
Learn how to calculate net working capital for your Australian SME. Discover formulas, real-world examples, and expert tips to unlock trapped cash.
Ansh Malhotra

A profitable Australian SME can still hit a cash wall. Sales are strong, the profit and loss statement looks healthy, and customers keep placing orders. Yet the bank balance is thin because cash is sitting in unpaid invoices, stock on shelves, and expenses paid before the related revenue arrives. A tax bill or payroll run can expose the gap very quickly.
That's why net working capital needs to be treated as a practical cash-flow measure, not just an accounting line. If you're learning what working capital means, the key idea is simple: your business can report profit while daily trading consumes cash.
Table of Contents
Why Profitable Australian SMEs Still Run Out of Cash
Profit measures revenue and expenses over an accounting period. Cash flow measures when money enters and leaves the bank account. Those timings rarely match in a growing business.
A wholesaler might buy stock well before it sells. An ecommerce business might pay suppliers immediately while a marketplace releases customer funds later. A trade contractor may complete work, issue an invoice, and wait for payment while wages, materials, subcontractors and tax obligations fall due. None of those activities necessarily reduce accounting profit immediately, but each can increase the amount of cash trapped in operations.
The Australian Government's Export Finance agency defines working capital as current assets less current liabilities. Current assets can include cash, accounts receivable and inventory, while current liabilities can include payroll, loans, debts and taxes. Its related working capital ratio is current assets divided by current liabilities, so a ratio above 1.0 means current assets exceed current liabilities, while a ratio below 1.0 indicates short-term funding pressure. See the Australian Government guidance on why working capital matters for the formal definitions.
The cash is usually trapped in three places
For most founders, the headline balance sheet doesn't identify the operational problem clearly enough. The useful question is not only whether current assets exceed current liabilities. It's which trading activities are absorbing cash.
Receivables: You've recorded a sale, but the customer hasn't paid.
Inventory: You've converted cash into products that haven't sold.
Payables: Supplier credit is temporarily funding operations, but invoices will still fall due.
Tax obligations can intensify the pressure because they're often paid in batches rather than smoothly across each trading day. A business can therefore look stable in monthly management reports and still face a sudden cash shortage when several obligations arrive together.
Practical rule: Profit tells you whether the model can work. Working capital tells you whether the business can keep paying its bills while it works.
A positive working capital result isn't automatically comfortable. Cash may be included in the calculation even though it's already committed to payroll, debt repayments, tax or a planned stock purchase. Conversely, a lower result may be normal for a business that collects customer money quickly and pays suppliers later. The number matters, but the composition and timing matter more.
The Core Formulas and Balance Sheet Sourcing
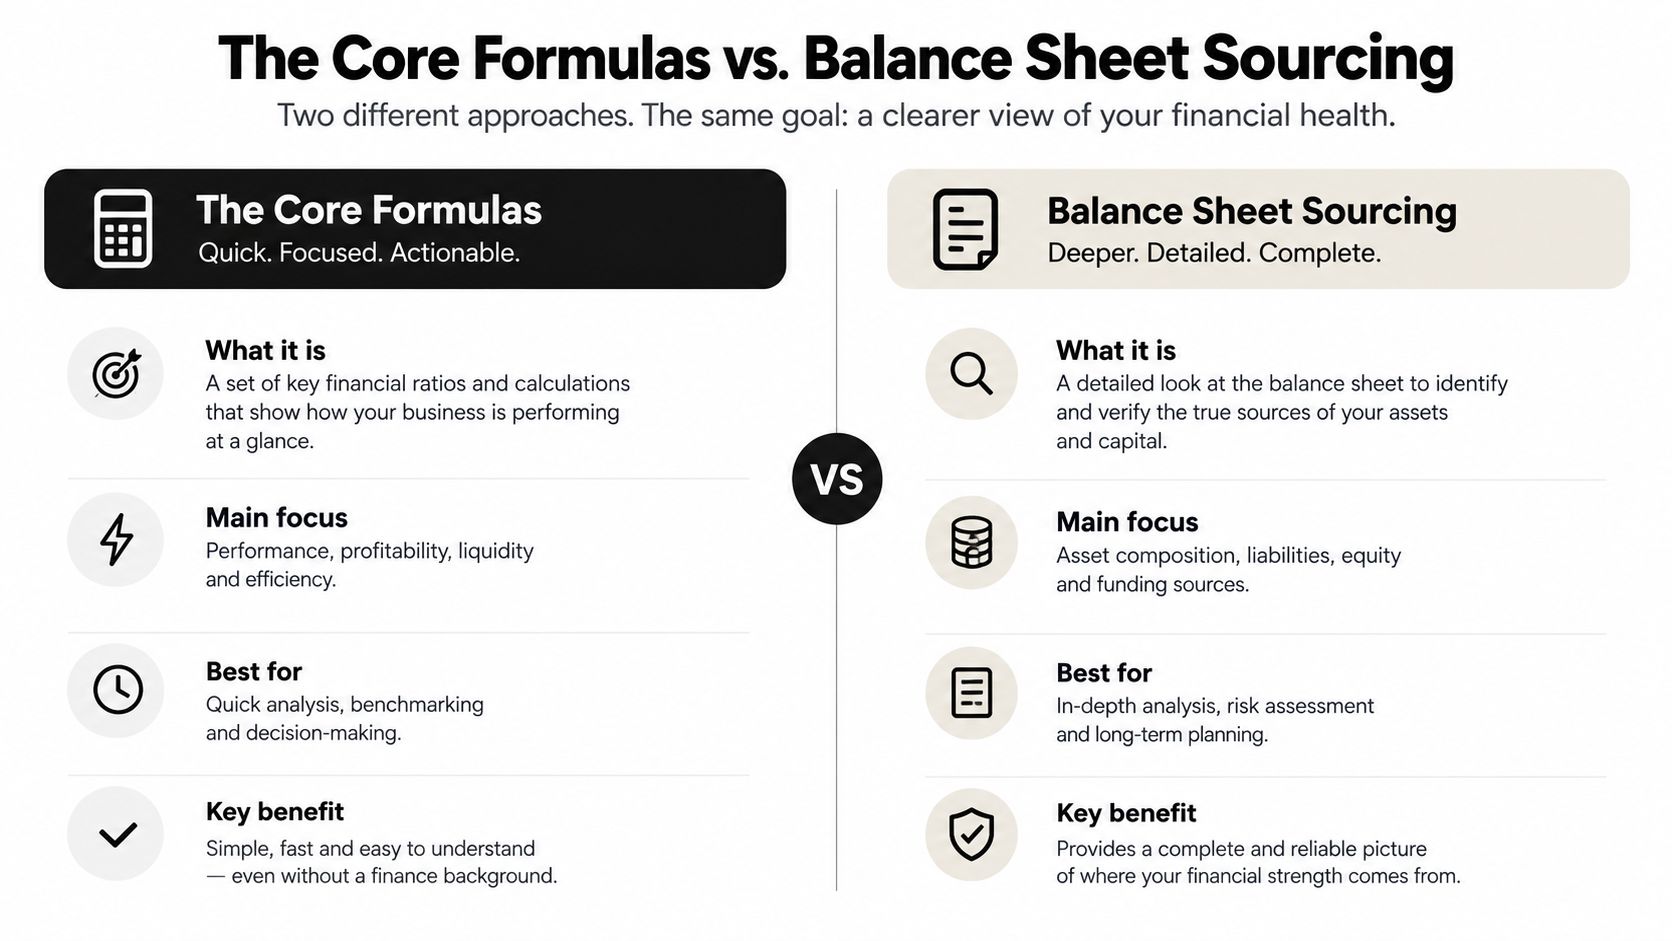
Start with the broad formula because it gives you the standard balance-sheet view:
Net working capital = current assets − current liabilities
This calculation answers a legitimate question: does the business have more short-term assets than short-term obligations? It's useful for a quick liquidity review, lender discussion or board pack. It's less useful when you're trying to find the cash absorbed by normal trading.
The more operational formula separates trading balances:
Operating net working capital = receivables − payables + inventory + prepayments
The NSW Independent Pricing and Regulatory Tribunal policy paper uses this receivables-minus-payables-plus-inventory-plus-prepayments approach in its working-capital analysis. It focuses on operating assets and liabilities rather than mixing them with financing balances.
Build the calculation from a clean balance sheet
Pull the latest balance sheet from Xero, MYOB or QuickBooks, then map each account into an operating or non-operating category.
Balance-sheet item | Operational treatment | Reason |
|---|---|---|
Trade receivables | Include | Cash is owed by customers |
Inventory | Include | Cash is tied up in stock |
Prepayments | Include where operating | Cash has been paid before the related benefit |
Trade payables | Include | Supplier credit funds trading |
Cash and bank accounts | Exclude from operating NWC | Cash is the result you're trying to understand |
Short-term loans and overdrafts | Exclude from operating NWC | These are financing items |
Tax and payroll liabilities | Review separately | They're real obligations, but may not represent supplier trading terms |
The exclusions don't make cash, debt or tax irrelevant. They create a second view. Keep the broad calculation for overall liquidity, then use operating NWC to diagnose trading performance.
Clean the source data before applying the formula. Reconcile receivables to the aged debtor report, check whether inventory includes obsolete or damaged stock, and confirm that payables represent genuine supplier balances rather than unrelated accruals. If invoice follow-up is inconsistent, an accounts receivable automation guide can help you assess process and system improvements without confusing a collection problem with a sales problem.
Finally, record the reporting date beside every input. A balance sheet prepared at month-end should not be combined with revenue or cost data from a different period unless you've deliberately normalised the periods.
Step-by-Step Calculation with Real-World Examples
The practical method is to start with the latest balance sheet and isolate receivables, inventory, payables and prepayments, as outlined in Xero's Australian working capital guide. The examples below use illustrative figures to show the mechanics, not business benchmarks.
Example one, an inventory-heavy ecommerce brand
Assume an online retailer reports these operating balances at month-end:
Trade receivables: $90,000
Inventory: $240,000
Prepayments: $15,000
Trade payables: $170,000
The calculation is:
Operating NWC = $90,000 − $170,000 + $240,000 + $15,000
Operating NWC = $175,000
The result says $175,000 is tied up in the operating cycle at that reporting date. It doesn't mean the business has $175,000 available in the bank. Much of that amount is represented by products waiting to sell and invoices waiting to be collected.
A simple spreadsheet can use the following structure:
Cell | Label | Input or formula |
|---|---|---|
B2 | Trade receivables | Enter balance |
B3 | Inventory | Enter balance |
B4 | Prepayments | Enter balance |
B5 | Trade payables | Enter balance |
B6 | Operating NWC |
|
The management question is what changed. If inventory increased because the owner placed a large seasonal order, the business may need a funding plan before the stock converts to cash. If receivables rose because marketplace settlements or customer collections slowed, the remedy sits in payment processes rather than purchasing.
For inventory-heavy operators, track the stock balance alongside sales forecasts and purchase commitments. A profitable product can still be a poor cash decision if it sells slowly, requires large minimum orders or becomes outdated before the next replenishment cycle.
Use the inventory days calculation guide to make the stock component more useful than a single month-end dollar figure.
Here's a short video reference for founders who want a visual explanation of the underlying calculation:
Example two, a service-based trade business
Now consider an electrical services business with limited physical inventory. Its balances are:
Trade receivables: $125,000
Work-related prepayments: $8,000
Trade payables, including contractor invoices: $95,000
Inventory: $5,000
Operating NWC = $125,000 − $95,000 + $5,000 + $8,000
Operating NWC = $43,000
The result is lower because the business doesn't need to finance a large stock position. However, contractor payables and unbilled or recently completed work can still create a serious timing gap. If the business pays subcontractors quickly but invoices clients only after approvals, cash can remain under pressure even when gross margins look sound.
Add columns for reporting date, source report, balance and notes. For work-in-progress, document whether the amount is included in receivables, inventory or another operating account. Inconsistent coding across Xero or MYOB can make two months look comparable when they aren't.
The spreadsheet should also include a separate check for total current assets minus total current liabilities. Comparing the broad and operating views helps you identify whether the apparent liquidity comes from cash or from trading balances.
Interpreting Your Numbers and Cash Conversion Cycle
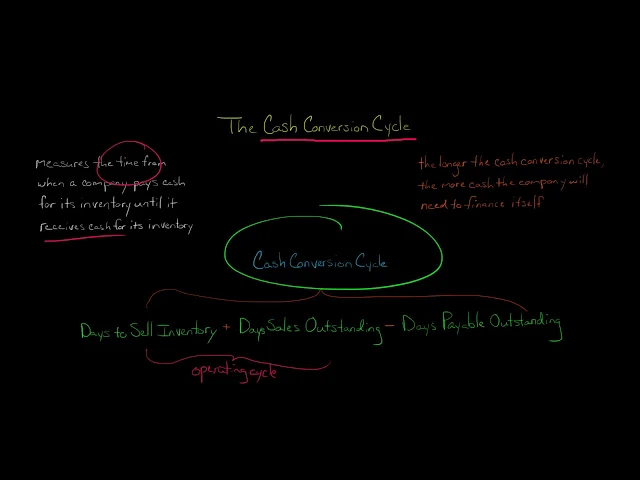
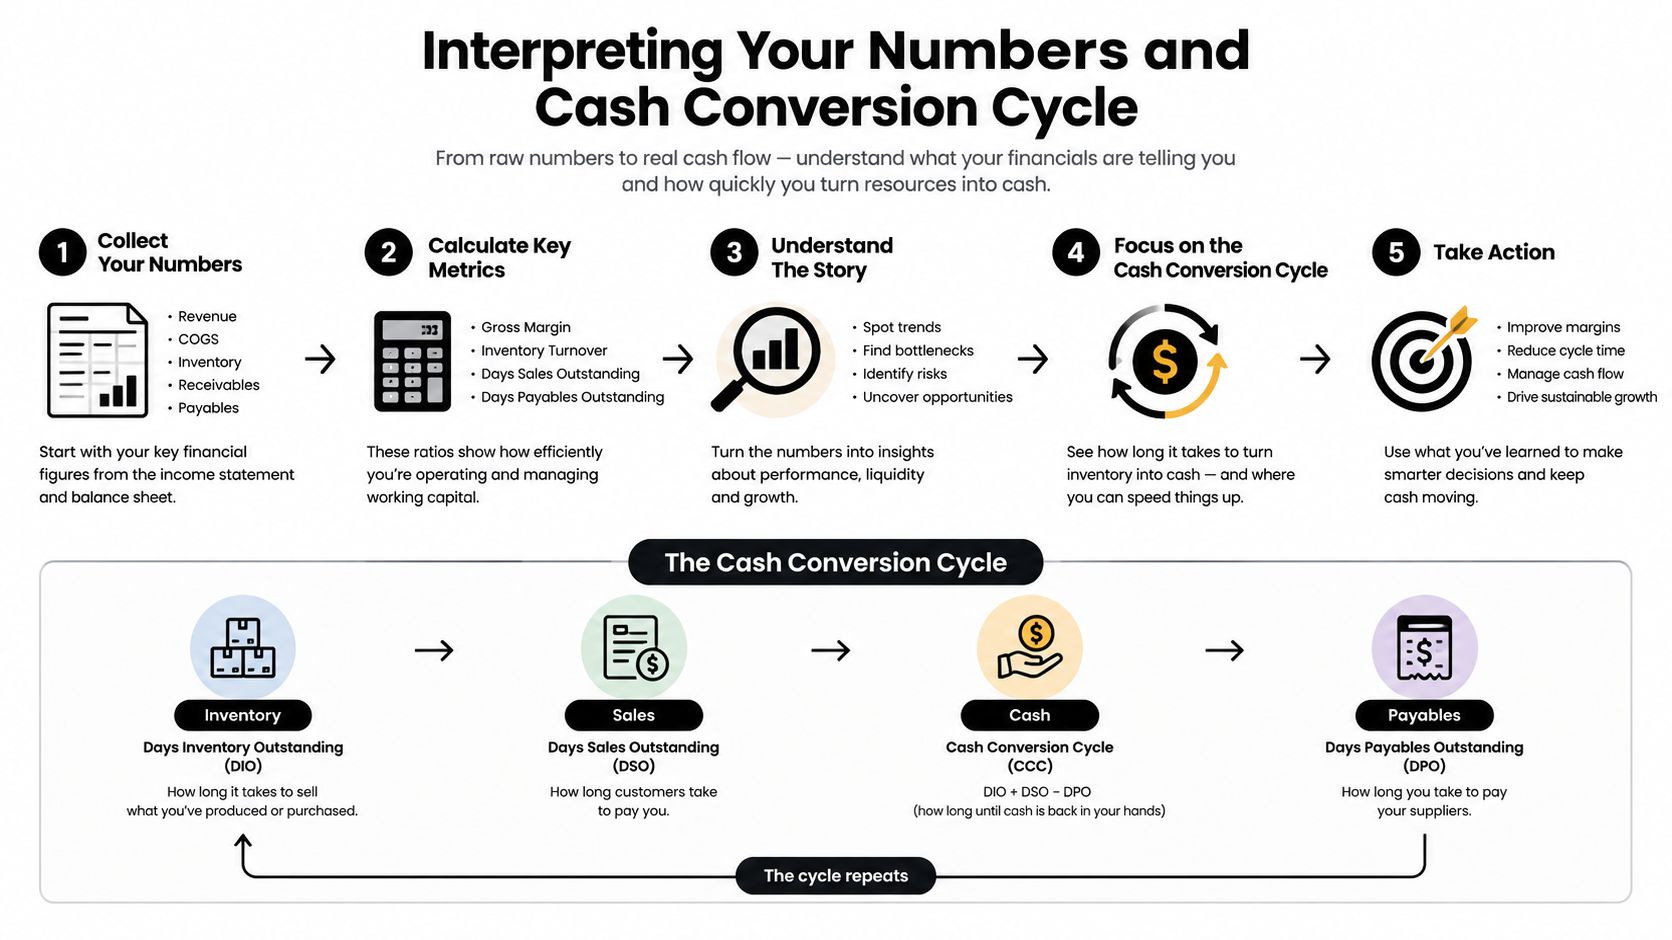
A dollar value shows the amount invested in operations at a point in time. It doesn't show how quickly that investment turns back into cash. For that, track the cash conversion cycle, which connects customer collection, stock movement and supplier payment timing.
KPMG's Australian working-capital methodology defines the core ratios as follows:
DSO = average trade receivables ÷ revenue × 365
DIO = average inventory ÷ COGS × 365
DPO = average trade creditors ÷ COGS × 365
Cash conversion cycle = DSO + DIO − DPO
These formulas are set out in KPMG's Australian working-capital trends report. Use average balances where possible, rather than relying only on a single closing balance.
Find the leg consuming cash
A rising DSO points towards customer terms, invoicing delays, disputes or weak follow-up. A rising DIO suggests purchasing, forecasting, product mix or stock clearance issues. A falling DPO may mean the business is paying suppliers faster, losing negotiated terms or settling invoices before it needs to.
The ratios also reveal trade-offs. Extending DPO can improve cash, but paying late without agreement can damage supply reliability. Reducing DIO can release cash, but excessive stock cuts can create missed sales. Lowering DSO may require tighter credit terms, which can affect conversion or customer relationships.
A useful monthly dashboard contains both the absolute operating NWC balance and the cycle ratios. The balance tells you how much capital is committed. The ratios explain why. For further practical guidance on reducing the cycle, review this CPG cash cycle improvement guide, then apply only the changes your suppliers, customers and operating model can support.
Your working capital cycle analysis should also reconcile to the balance sheet. If the ratios improve but the operating NWC balance rises sharply, growth may be absorbing more cash than process improvements are releasing.
Common Pitfalls and Adjustments for Australian SMEs
A neat formula can still produce a bad decision if the inputs are inconsistent. Australian SMEs often calculate working capital from a month-end balance sheet, then compare it with a revenue or COGS figure covering a different trading period. Seasonal stock purchases, uneven sales and GST timing can make that comparison misleading.
Use matching periods and keep a note of unusual movements. If stock was purchased ahead of a major selling period, separate the planned build from excess inventory. If a large customer invoice remains unpaid because of a dispute, don't treat the gross receivable as cash you can confidently deploy.
Audit the account quality
Gross receivables can overstate liquidity. Review aged debtors and reduce confidence in balances that are disputed, overdue or unlikely to be collected. A receivable only supports liquidity when the customer is likely to pay within the relevant period.
Inventory needs a reality check. Confirm quantities, valuation and saleability. Slow-moving, damaged or obsolete stock may appear as an asset while offering little near-term cash value.
Operating NWC shouldn't include financing noise. Cash and short-term debt belong in the broad liquidity view, but including them in operating NWC hides the cash absorbed by customers, stock and suppliers.
Use averages for volatile businesses. A single reporting date can capture a temporary peak or trough. Monthly average balances provide a more stable basis for DSO, DIO and DPO.
KPMG reported that Australian public companies had a median cash conversion cycle of 62 days in FY25, after reaching 71 days in FY24. The same source reported DSO of 46 days, DIO of 68 days and DPO of 52 days, demonstrating that cash can remain tied up even when headline working capital appears adequate. Those figures are an external benchmark, not a target for every SME, but they reinforce the central point: liquidity depends on timing, not just asset totals. Read the KPMG Australian working-capital trends summary for the reported context.
Practical Next Steps to Improve Working Capital
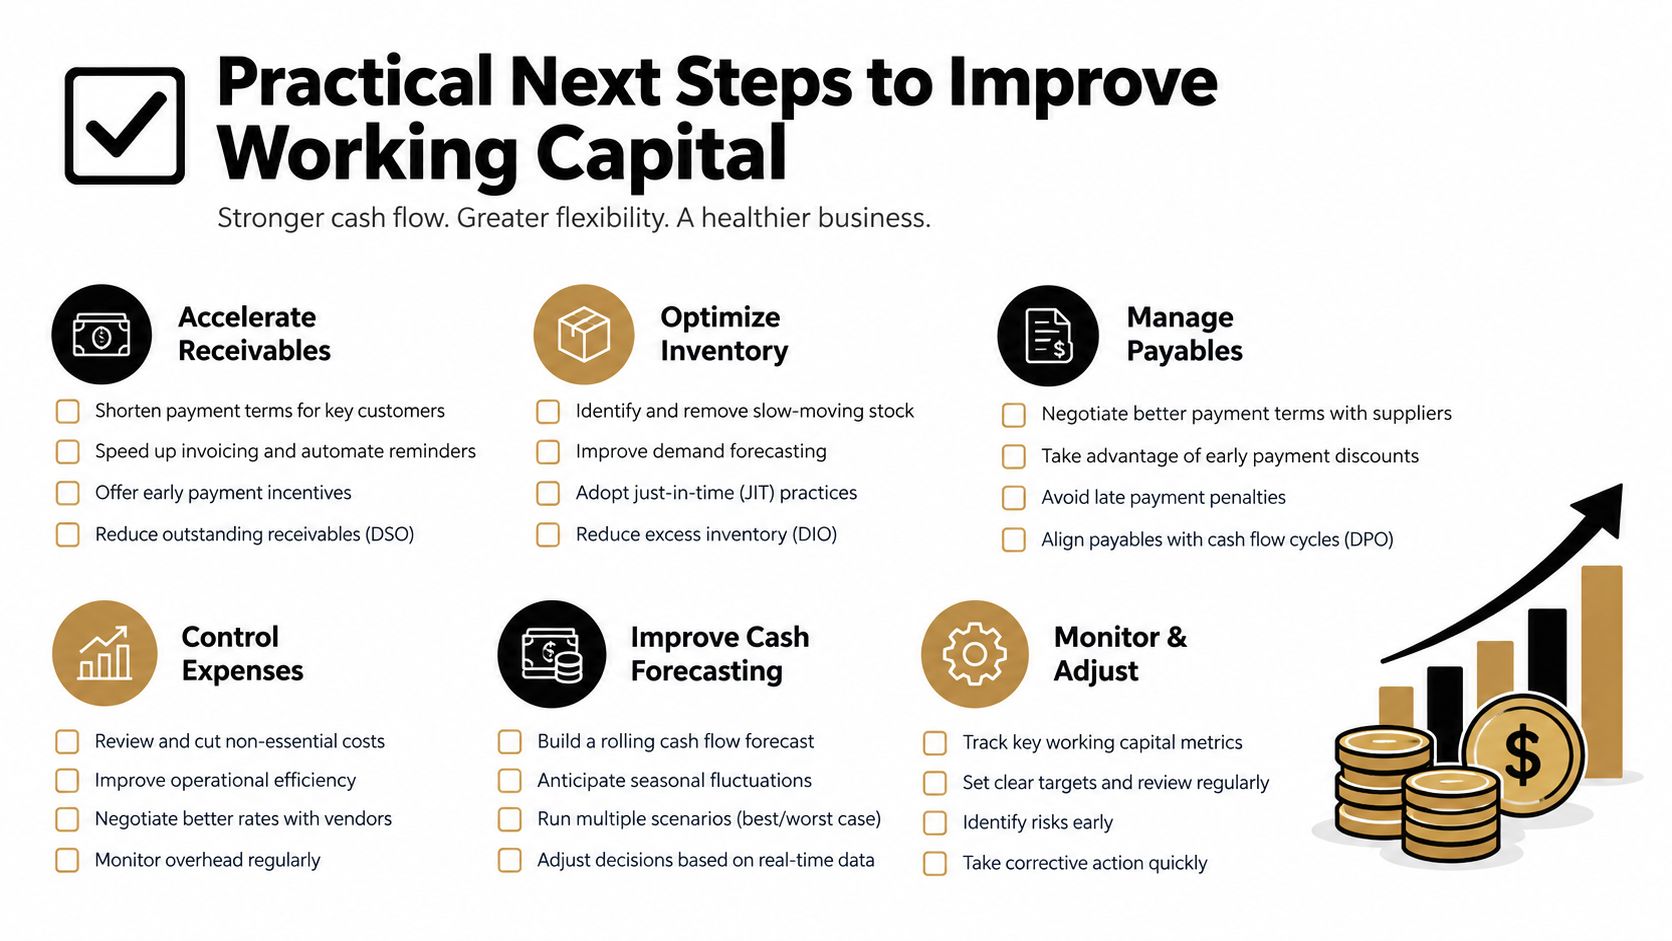
Improvement starts with the largest cash trap, not with a generic cost-cutting exercise. Rank receivables, inventory and payables by their cash impact, then assign one owner to each measure.
For receivables, invoice as soon as the contractual milestone is met. Confirm purchase-order requirements before work begins, automate reminders, and escalate disputed invoices separately from ordinary overdue accounts. Tightening credit terms can reduce DSO, but apply it selectively so you don't create unnecessary friction with reliable customers.
For inventory, separate core stock from slow-moving items and committed purchase orders. Pause replenishment where demand has weakened, sell or return stock where commercially sensible, and require a cash-flow review before placing unusually large orders. Don't measure purchasing success only by unit price. A cheaper unit that sits unsold can consume more cash than a higher-priced product that turns quickly.
For payables, build a supplier calendar showing due dates, agreed terms and critical vendors. Pay according to the agreed terms rather than paying early by habit, but don't stretch suppliers without consent. A predictable payment process can protect supply relationships while preserving cash inside the business for longer.
Turn the calculation into a weekly routine
Maintain a rolling cash forecast that reflects expected collections, stock purchases, supplier payments, payroll and tax obligations. Review the forecast against actual bank movements and investigate variances while there's still time to act.
External funding can support a genuine timing gap, but it shouldn't conceal a permanently inefficient cycle. Before applying for finance, understand the working capital line of credit guide and model repayments against conservative collections and stock assumptions.
Nexist provides Australian founders with cash-flow forecasting, working-capital reporting, receivables and payables support, inventory optimisation and virtual CFO guidance. Visit Nexist to connect the calculation to a practical operating plan, identify where cash is trapped, and put the right weekly controls in place.
net working capital, working capital formula, cash flow management, SME finance, cash conversion cycle

" width="24px"/><g d="M 0 24.129 L 0 0.129 L 24 0.129 L 24 24.129 Z M 0 24.129 L 0 0.129 L 24 0.129 L 24 24.129 Z M 24 3 C 24 1.344 22.656 0 21 0 L 3 0 C 1.344 0 0 1.344 0 3 L 0 21 C 0 22.656 1.344 24 3 24 L 21 24 C 22.656 24 24 22.656 24 21 Z M 6.883 8.375 L 2.863 8.375 L 2.863 20.467 L 6.883 20.467 Z M 4.899 2.545 C 3.524 2.545 2.625 3.449 2.625 4.634 C 2.625 5.795 3.496 6.724 4.846 6.724 L 4.872 6.724 C 6.273 6.724 7.146 5.795 7.146 4.634 C 7.12 3.449 6.274 2.545 4.899 2.545 Z M 16.747 8.09 C 14.614 8.09 13.659 9.263 13.124 10.086 L 13.124 8.374 L 9.105 8.374 C 9.159 9.508 9.105 20.466 9.105 20.466 L 13.124 20.466 L 13.124 13.713 C 13.124 13.352 13.15 12.99 13.257 12.732 C 13.547 12.01 14.209 11.262 15.319 11.262 C 16.773 11.262 17.355 12.372 17.355 13.996 L 17.355 20.466 L 21.374 20.466 L 21.374 13.532 C 21.374 9.818 19.391 8.09 16.747 8.09 Z" fill="transparent" height="24.12890599668026px" id="dSFdkJotL" width="24px"><path d="M 0 24 L 0 0 L 24 0 L 24 24 Z" fill="transparent" height="24px" id="wscNJE44G" transform="translate(0 0.129)" width="24px"/><g d="M 0 24.129 L 0 0.129 L 24 0.129 L 24 24.129 Z M 24 3 C 24 1.344 22.656 0 21 0 L 3 0 C 1.344 0 0 1.344 0 3 L 0 21 C 0 22.656 1.344 24 3 24 L 21 24 C 22.656 24 24 22.656 24 21 Z M 6.883 8.375 L 2.863 8.375 L 2.863 20.467 L 6.883 20.467 Z M 4.899 2.545 C 3.524 2.545 2.625 3.449 2.625 4.634 C 2.625 5.795 3.496 6.724 4.846 6.724 L 4.872 6.724 C 6.273 6.724 7.146 5.795 7.146 4.634 C 7.12 3.449 6.274 2.545 4.899 2.545 Z M 16.747 8.09 C 14.614 8.09 13.659 9.263 13.124 10.086 L 13.124 8.374 L 9.105 8.374 C 9.159 9.508 9.105 20.466 9.105 20.466 L 13.124 20.466 L 13.124 13.713 C 13.124 13.352 13.15 12.99 13.257 12.732 C 13.547 12.01 14.209 11.262 15.319 11.262 C 16.773 11.262 17.355 12.372 17.355 13.996 L 17.355 20.466 L 21.374 20.466 L 21.374 13.532 C 21.374 9.818 19.391 8.09 16.747 8.09 Z" fill="transparent" height="24.12890599668026px" id="sTpjGo1tb" width="24px"><path d="M 0 24 L 0 0 L 24 0 L 24 24 Z" fill="transparent" height="24px" id="s7ffpmKOD" transform="translate(0 0.129)" width="24px"/><g d="M 24 3 C 24 1.344 22.656 0 21 0 L 3 0 C 1.344 0 0 1.344 0 3 L 0 21 C 0 22.656 1.344 24 3 24 L 21 24 C 22.656 24 24 22.656 24 21 Z M 6.883 8.375 L 2.863 8.375 L 2.863 20.467 L 6.883 20.467 Z M 4.899 2.545 C 3.524 2.545 2.625 3.449 2.625 4.634 C 2.625 5.795 3.496 6.724 4.846 6.724 L 4.872 6.724 C 6.273 6.724 7.146 5.795 7.146 4.634 C 7.12 3.449 6.274 2.545 4.899 2.545 Z M 16.747 8.09 C 14.614 8.09 13.659 9.263 13.124 10.086 L 13.124 8.374 L 9.105 8.374 C 9.159 9.508 9.105 20.466 9.105 20.466 L 13.124 20.466 L 13.124 13.713 C 13.124 13.352 13.15 12.99 13.257 12.732 C 13.547 12.01 14.209 11.262 15.319 11.262 C 16.773 11.262 17.355 12.372 17.355 13.996 L 17.355 20.466 L 21.374 20.466 L 21.374 13.532 C 21.374 9.818 19.391 8.09 16.747 8.09 Z" fill="transparent" height="24.000006px" id="D0ecaHEcW" transform="translate(0 0)" width="24px"><path d="M 24 3 C 24 1.344 22.656 0 21 0 L 3 0 C 1.344 0 0 1.344 0 3 L 0 21 C 0 22.656 1.344 24 3 24 L 21 24 C 22.656 24 24 22.656 24 21 Z" fill="rgb(55, 184, 218)" height="24.000006px" id="IPLFE6zXx" width="24px"/><path d="M 4.02 0 L 0 0 L 0 12.092 L 4.02 12.092 Z" fill="rgb(255, 255, 255)" height="12.09201px" id="FWhtzAyuY" transform="translate(2.863 8.375)" width="4.02px"/><path d="M 2.274 0 C 0.899 0 0 0.904 0 2.089 C 0 3.25 0.871 4.179 2.221 4.179 L 2.247 4.179 C 3.648 4.179 4.521 3.25 4.521 2.089 C 4.495 0.904 3.649 0 2.274 0 Z" fill="rgb(255, 255, 255)" height="4.17876px" id="VmOsKv4kO" transform="translate(2.625 2.545)" width="4.52095px"/><path d="M 7.641 0 C 5.509 0 4.554 1.173 4.019 1.996 L 4.019 0.284 L 0 0.284 C 0.053 1.419 0 12.376 0 12.376 L 4.019 12.376 L 4.019 5.623 C 4.019 5.262 4.045 4.9 4.151 4.642 C 4.442 3.92 5.103 3.172 6.214 3.172 C 7.667 3.172 8.25 4.282 8.25 5.907 L 8.25 12.376 L 12.269 12.376 L 12.269 5.442 C 12.269 1.728 10.286 0 7.641 0 Z" fill="rgb(255, 255, 255)" height="12.37626px" id="n1XUbhaq0" transform="translate(9.105 8.09)" width="12.268830000000001px"/></g></g></g></g></svg>)