
How to Improve Inventory Management for Australian SMEs
Learn how to improve inventory management with a practical playbook for Australian SMEs. Reduce trapped cash, optimise stock turns and build better systems.
Ansh Malhotra

Your warehouse is full, your purchasing team is still placing orders, and the bank balance doesn't reflect the sales you've made. Then a stocktake reveals the problem: cash is sitting on shelves as slow-moving products, duplicate items, excess ingredients, or materials bought for demand that never arrived.
That's the inventory problem most Australian SME founders are dealing with. The answer isn't to slash stock blindly. You need to release trapped working capital while protecting the service levels your customers, production team, or venue depends on. The practical question is how to improve inventory management without creating stockouts, supplier instability, or margin damage.
Table of Contents
Why Inventory Management Is a Cash Flow Lever
A wholesale founder can report rising sales and a healthy profit, yet keep drawing on an overdraft. The usual cause is timing. Cash has moved into products purchased against supplier minimums or optimistic forecasts, while customers have not created the expected demand.
Inventory appears as an asset on the balance sheet, but it cannot fund wages, tax obligations, debt repayments, marketing, or growth until it is sold, used in production, or converted into a completed customer order. That makes stock policy a cash decision, not just a warehouse decision.
Australian businesses hold a very large asset base. Business inventories are projected at A$235.4 billion in 2025-26, up 1.6% on the prior year, according to Australian inventory reporting based on business data. Improving turnover, stock accuracy, or purchasing discipline can therefore release meaningful working capital.
Excess stock creates more than a storage problem
The purchase price is only the first cost. Inventory also uses warehouse space, staff time, insurance, handling capacity, and management attention. Products may become damaged, expired, out of season, or commercially irrelevant before a buyer appears.
Slow-moving stock also exposes decisions that need attention. The right response may be a price change, new packaging, a different sales channel, revised supplier terms, or a narrower range. Continuing to buy more units postpones that decision and can make the eventual clearance more painful.
Retail inventories fell by A$644 million in the September 2024 quarter, while inventories across all industries fell by A$712 million in the same quarter, according to coverage of Australian inventory movements. The figures show how quickly stock positions can shift when purchasing and demand move out of alignment.
CFO rule: Don't ask whether you can afford to buy the stock. Ask whether you can afford to keep the cash trapped in it.
Treat inventory as a portfolio of cash decisions
Give each SKU a clear role. Fast-moving, high-margin products may justify dependable availability. Low-margin items with volatile demand need tighter controls. Critical production inputs may require a buffer, while easily replaced products should not receive the same treatment.
Sector demand patterns should drive the policy. A retailer facing seasonal peaks needs different buying rules from a wholesaler with repeat orders or a manufacturer dependent on production inputs. Supplier reliability and lead times matter just as much as sales history.
Connect inventory policy to the cash conversion cycle, rather than managing the warehouse in isolation. The cash conversion cycle guide explains how inventory timing affects the period before purchasing cash returns through customer receipts.
The target is the right inventory for your sector, demand pattern, supplier reliability, and cash cycle. That is how founders release working capital without creating avoidable stockouts or margin damage.
Diagnosing Your Current Inventory Health
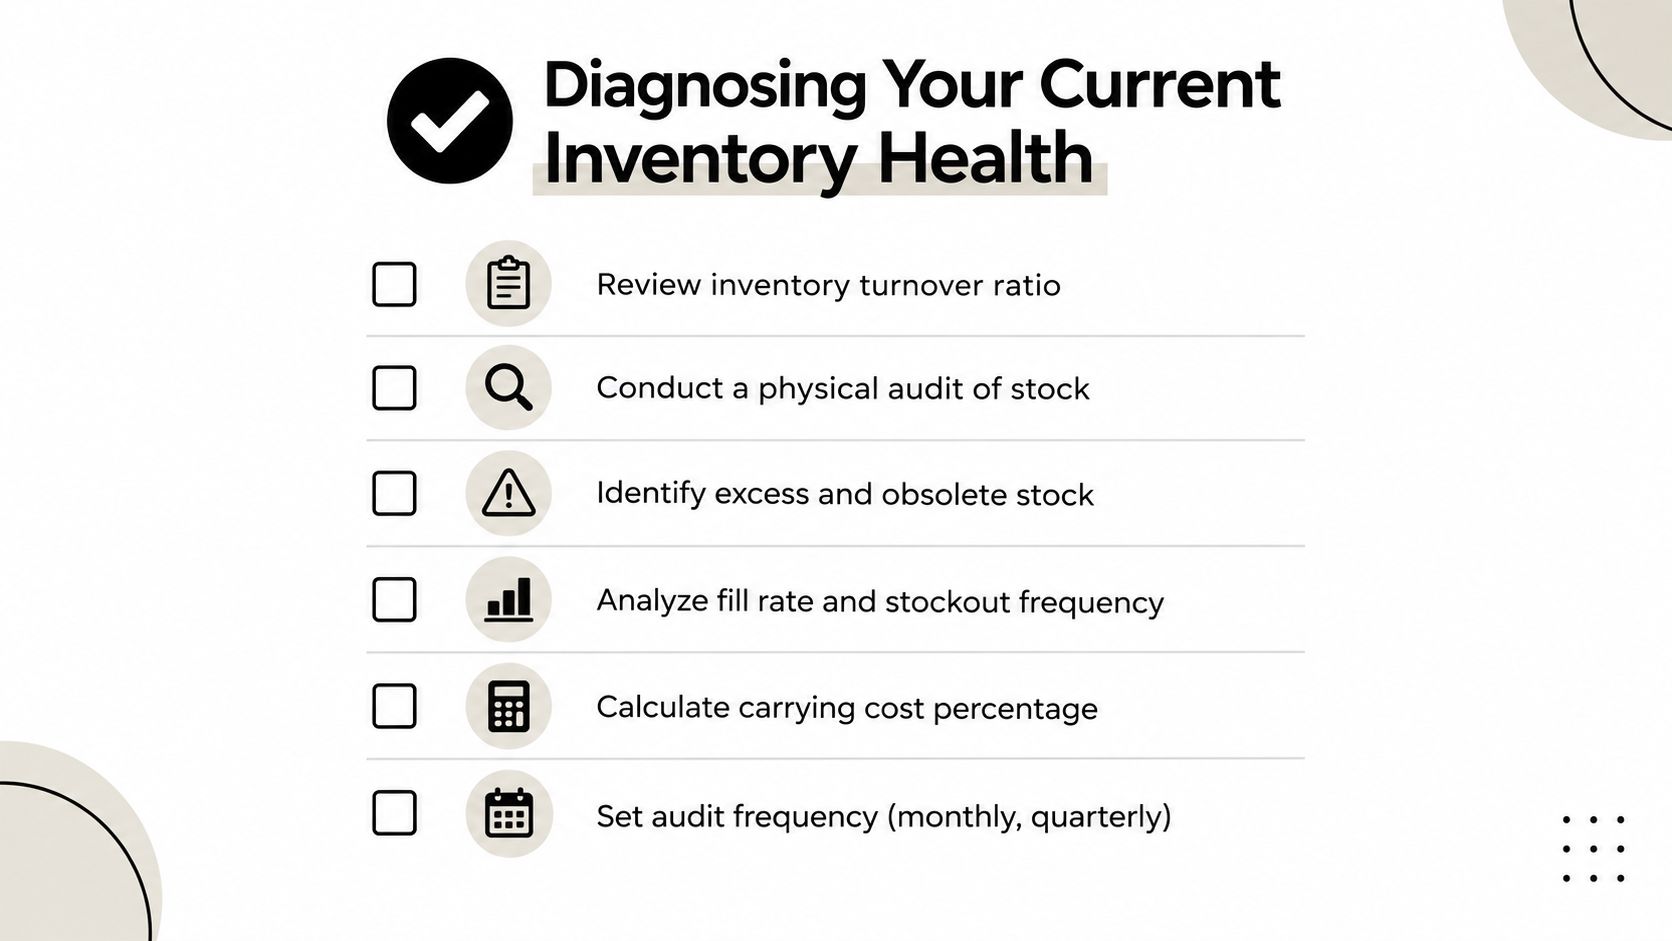
You can't improve inventory management while relying on a system balance that nobody trusts. Start with a physical baseline, then connect that baseline to sales, purchasing, and cash data.
Calculate inventory turnover using cost of goods sold divided by average inventory. The result indicates how often your stock is sold and replaced over a period. Days sales of inventory uses the same underlying relationship to show how long cash typically remains tied up before inventory converts into sales.
Use the figures directionally. A falling turnover rate can signal overbuying, weak demand, obsolete products, or poor range decisions. A very high turnover rate may indicate efficient purchasing, but it can also expose a business to stockouts if replenishment is too slow.
Build a SKU-level view
A company-wide average is useful for direction, but it won't tell you which products are consuming cash. Export every SKU and add:
Units on hand: Compare physical quantities with the system record.
Inventory value: Use the accounting value consistently, so your review ties back to the balance sheet.
Recent movement: Identify items with no recent sales, usage, or production consumption.
Demand pattern: Separate steady sellers from seasonal, promotional, project-based, or unpredictable items.
Supplier information: Record lead time, minimum order quantities, price changes, and delivery reliability.
Classify products by value and movement. An ABC analysis can focus management time on high-value items, while an XYZ view can distinguish predictable demand from volatile demand. Don't apply the same reorder settings to every SKU because your software makes that easy.
Quantify the cash opportunity
Netstock's 2024 benchmark analysis covered 660 Australian businesses and 148,142 stocked items, with average excess product or ingredients of $231,700 versus ideal levels. That figure should prompt a stock review, not a blind comparison. Your opportunity may be concentrated in a small number of ageing or duplicated lines.
For a broader explanation of practical controls, including audits, stock records, and replenishment discipline, use this resource on inventory management for small business.
Create three decisions for each problem SKU: sell through, return or renegotiate with the supplier, or stop replenishing. Don't leave the item in a fourth category called “review later”. That category is where working capital disappears.
Designing Better Inventory Processes
A good inventory process makes the correct action easier than the incorrect one. It tells staff what to do when stock arrives, moves, is damaged, is reserved, or leaves the business.
Start by documenting the full flow from purchase order to receipt, storage, sale, transfer, adjustment, and reconciliation. Your SOP should identify who checks quantities, who records discrepancies, which system gets updated first, and who approves write-offs. If the process depends on one experienced employee remembering every exception, it isn't a process yet.
Match controls to the operating model
Australian businesses don't carry stock for the same reasons. Q3 2025 data showed total business inventories fell 0.9% quarter-on-quarter, with retailers down 1.6% and accommodation and food services down 1.3%, while manufacturers rose 0.4%, according to Australian business inventory reporting.
That split supports different policies:
Retail: Plan around seasonality, promotions, returns, size or colour variants, and sell-through. Review the range frequently and stop buying items that need permanent discounting.
Hospitality: Control perishability, recipe yields, wastage, prep quantities, and supplier delivery windows. Forecast by service pattern and menu demand, not just last month's total usage.
Wholesale: Segment customers and order profiles. Avoid buying large quantities solely to meet supplier minimums unless the margin and cash cycle support it.
Manufacturing: Separate raw materials, work in progress, finished goods, and critical components. Link purchasing to production plans and realistic lead times.
Retail operators wanting a sector-specific comparison can also review these Indiana retail inventory solutions, then adapt the principles to Australian customers, suppliers, and tax requirements.
Use cycle counts instead of waiting for surprises
A cycle count checks part of the inventory regularly rather than relying only on a disruptive full stocktake. Prioritise high-value, fast-moving, frequently adjusted, or operationally critical items. Investigate every variance and record the cause, whether it's receiving errors, picking mistakes, unrecorded transfers, damage, or incorrect units of measure.
Forecasting should combine historical sales with known business events. Include promotions, customer contracts, seasonal changes, menu changes, production schedules, and supplier constraints. A forecast isn't a promise that demand will be correct. It's a documented assumption that purchasing can challenge and update.
Optimising Supplier Relationships and Reorder Points
Reorder points should reflect demand during supplier lead time, plus a deliberate safety buffer. They shouldn't be copied from an old spreadsheet or set as a round number because a supplier once recommended it.
For each important SKU, record average demand, lead time, lead-time variability, order frequency, minimum order quantity, and the consequence of a stockout. Then set a minimum level that reflects the actual operating risk. A critical manufacturing component may justify more protection than a standard item available from several suppliers, while a perishable hospitality input may require a smaller and more frequent order.
This reorder point calculation guide provides a practical framework for connecting demand, lead time, and safety stock.
Stop treating every supplier the same
A supplier offering a lower unit price can still be expensive if deliveries arrive late, quantities are short, or quality problems create rework. Build a supplier scorecard covering:
Delivery reliability: Did orders arrive when promised?
Quantity accuracy: Did the delivered quantity match the purchase order?
Quality: Did the stock meet your specification?
Commercial flexibility: Can the supplier adjust quantities, timing, or terms?
Total cost: Include freight, rush orders, defects, and administrative effort.
Use the scorecard in supplier conversations. Ask for smaller minimum order quantities, staged deliveries, improved payment terms, reserved production capacity, or more reliable lead times. A supplier may prefer a lower price, but your business may value timing and flexibility more.
Rebalance after rapid destocking
Australian manufacturers have been releasing cash from stock at speed. The Unleashed 2026 Manufacturing Health Index reported stock on hand fell 56.8% year-on-year to an average of $207,501, as reported in the ASX-published document containing the manufacturing inventory data.
That creates a risk. If purchasing teams cut stock without recalibrating forecasts, reorder points, and supplier communication, the business can move from excess inventory to avoidable shortages. Review changes in service levels, emergency purchasing, production delays, and customer backorders alongside the cash released. The target is not the lowest stock balance. It's a controlled balance between cash, availability, and margin.
Implementing Systems and Automation
Technology won't fix poor item masters, unrecorded stock movements, or inconsistent receiving. It will make a disciplined process faster and more visible, which is why implementation should begin with data and workflow design rather than software shopping.
The Australian Government's guidance says businesses should know what stock they have on hand, its value, and how to prepare for stocktake. That requirement matters for smaller firms because ABS methodology doesn't directly collect inventory data from businesses with fewer than 20 employees, making reliable internal records particularly important. Follow the Australian Government inventory management guidance as a practical foundation.

Choose the smallest system that closes the biggest gap
An ecommerce business may need a reliable connection between Shopify, its accounting platform, purchasing, and fulfilment. A manufacturer may need batch tracking, bills of materials, production consumption, and supplier lead-time data. A hospitality group may prioritise recipe-level usage, wastage records, and location transfers.
Before buying, map the required data flow:
Sales or production consumption reduces available stock.
Purchase orders record expected receipts.
Receiving confirms actual quantities and discrepancies.
Transfers update the correct location.
Accounting receives consistent inventory values.
Dashboards show exceptions requiring action.
Barcode scanning can reduce manual entry during receiving, picking, and stocktakes. Automated alerts can flag low stock, unusual adjustments, negative balances, ageing items, or purchase orders that haven't arrived. For background on the cost savings of automated inventory control, focus on the workflow savings and control improvements rather than automation as a substitute for accountability.
A staged approach is safer than a large implementation. Clean the SKU master, test one location or product family, reconcile the opening balances, train the people who handle stock, and only then expand. If you're assessing AI inventory management, use it to support forecasting and exception review, not to approve purchases without human oversight.
A short demonstration of inventory workflows can help your team visualise the process:
Your Implementation Roadmap and KPIs
Inventory improvement fails when the founder asks for a system, delegates the project, and never changes the decisions that created excess stock. Give one owner responsibility for the data, purchasing rules, stock adjustments, and weekly exceptions. Finance should own the cash impact, while operations owns the physical process.

The first phase focuses on quick cash wins
In the first phase, freeze automatic replenishment for items with no clear demand case. Clean duplicate SKUs, identify damaged or obsolete stock, and review open purchase orders before they arrive. Separate stock that can be sold, returned, repurposed, discounted, or written off.
Set simple minimum and maximum levels for priority items. Don't try to perfect every product at once. Concentrate on the SKUs that represent the greatest value, create the most frequent stockouts, or generate the most manual intervention.
Create a baseline dashboard with:
Inventory value: Reconcile the system balance to the general ledger.
Inventory turnover: Track how efficiently stock converts through sales or production.
Days sales of inventory: Monitor how long cash remains committed.
Stock accuracy: Compare system quantities with physical counts.
Fill rate: Track the proportion of demand fulfilled from available stock.
Stockout frequency: Record where shortages interrupt sales or operations.
Ageing exposure: Identify products approaching expiry, obsolescence, or commercial irrelevance.
The second phase makes control repeatable
Introduce cycle counts and investigate variances instead of merely correcting them. Train receiving staff to check purchase orders against deliveries before stock becomes available for sale or production. Formalise transfers between locations and require a reason for manual adjustments.
Run a weekly exception review. The meeting should focus on action, not reporting. Discuss items with unusual demand, overdue supplier orders, repeated count variances, excess stock, and upcoming promotions or production requirements.
The finance review should convert operational changes into cash decisions. Compare purchases with sales, inventory movements, supplier payments, and gross margin. A lower stock balance is not automatically a win if the business has created missed sales, emergency freight, or expensive substitutions.
The third phase embeds review and accountability
After the process is stable, integrate inventory with accounting, sales, and purchasing systems where the data quality supports it. Build role-based dashboards so a warehouse lead sees count variances, a purchasing manager sees supplier and reorder exceptions, and the founder sees cash tied up by category.
Review KPI direction rather than isolated results. If inventory falls while fill rate also deteriorates, the business has cut too far or forecast incorrectly. If turnover improves but gross margin weakens, clearance activity may be releasing cash at the expense of profit. If stock accuracy improves but inventory value keeps rising, purchasing policy still needs attention.
Australian manufacturing data illustrates why this review matters. Average stock on hand reportedly fell to A$185,134 in Q2 2026, down 60% from A$462,735 in Q2 2025, according to Australian manufacturer inventory benchmarking coverage. The cash release can be valuable, but the management question is whether the new level supports reliable customer service and production.
Use a monthly owner-level review to answer five questions:
Which inventory released cash this month?
Which items increased without a demand signal?
Where did stockouts or emergency purchases occur?
Which supplier or process caused the variance?
What decision will change before the next review?
Inventory management becomes a competitive advantage when those questions receive clear answers and someone acts on them.
Nexist helps Australian SMEs uncover cash trapped in inventory through stocktakes, cycle counts, ageing reviews, reconciliations, reorder-point guidance, forecasting, and finance-led KPI reporting. Visit Nexist to discuss a practical inventory and cash-flow plan for your business.
inventory management, how to improve inventory management, SME cash flow, stock optimisation, inventory forecasting

" width="24px"/><g d="M 0 24.129 L 0 0.129 L 24 0.129 L 24 24.129 Z M 0 24.129 L 0 0.129 L 24 0.129 L 24 24.129 Z M 24 3 C 24 1.344 22.656 0 21 0 L 3 0 C 1.344 0 0 1.344 0 3 L 0 21 C 0 22.656 1.344 24 3 24 L 21 24 C 22.656 24 24 22.656 24 21 Z M 6.883 8.375 L 2.863 8.375 L 2.863 20.467 L 6.883 20.467 Z M 4.899 2.545 C 3.524 2.545 2.625 3.449 2.625 4.634 C 2.625 5.795 3.496 6.724 4.846 6.724 L 4.872 6.724 C 6.273 6.724 7.146 5.795 7.146 4.634 C 7.12 3.449 6.274 2.545 4.899 2.545 Z M 16.747 8.09 C 14.614 8.09 13.659 9.263 13.124 10.086 L 13.124 8.374 L 9.105 8.374 C 9.159 9.508 9.105 20.466 9.105 20.466 L 13.124 20.466 L 13.124 13.713 C 13.124 13.352 13.15 12.99 13.257 12.732 C 13.547 12.01 14.209 11.262 15.319 11.262 C 16.773 11.262 17.355 12.372 17.355 13.996 L 17.355 20.466 L 21.374 20.466 L 21.374 13.532 C 21.374 9.818 19.391 8.09 16.747 8.09 Z" fill="transparent" height="24.12890599668026px" id="dSFdkJotL" width="24px"><path d="M 0 24 L 0 0 L 24 0 L 24 24 Z" fill="transparent" height="24px" id="wscNJE44G" transform="translate(0 0.129)" width="24px"/><g d="M 0 24.129 L 0 0.129 L 24 0.129 L 24 24.129 Z M 24 3 C 24 1.344 22.656 0 21 0 L 3 0 C 1.344 0 0 1.344 0 3 L 0 21 C 0 22.656 1.344 24 3 24 L 21 24 C 22.656 24 24 22.656 24 21 Z M 6.883 8.375 L 2.863 8.375 L 2.863 20.467 L 6.883 20.467 Z M 4.899 2.545 C 3.524 2.545 2.625 3.449 2.625 4.634 C 2.625 5.795 3.496 6.724 4.846 6.724 L 4.872 6.724 C 6.273 6.724 7.146 5.795 7.146 4.634 C 7.12 3.449 6.274 2.545 4.899 2.545 Z M 16.747 8.09 C 14.614 8.09 13.659 9.263 13.124 10.086 L 13.124 8.374 L 9.105 8.374 C 9.159 9.508 9.105 20.466 9.105 20.466 L 13.124 20.466 L 13.124 13.713 C 13.124 13.352 13.15 12.99 13.257 12.732 C 13.547 12.01 14.209 11.262 15.319 11.262 C 16.773 11.262 17.355 12.372 17.355 13.996 L 17.355 20.466 L 21.374 20.466 L 21.374 13.532 C 21.374 9.818 19.391 8.09 16.747 8.09 Z" fill="transparent" height="24.12890599668026px" id="sTpjGo1tb" width="24px"><path d="M 0 24 L 0 0 L 24 0 L 24 24 Z" fill="transparent" height="24px" id="s7ffpmKOD" transform="translate(0 0.129)" width="24px"/><g d="M 24 3 C 24 1.344 22.656 0 21 0 L 3 0 C 1.344 0 0 1.344 0 3 L 0 21 C 0 22.656 1.344 24 3 24 L 21 24 C 22.656 24 24 22.656 24 21 Z M 6.883 8.375 L 2.863 8.375 L 2.863 20.467 L 6.883 20.467 Z M 4.899 2.545 C 3.524 2.545 2.625 3.449 2.625 4.634 C 2.625 5.795 3.496 6.724 4.846 6.724 L 4.872 6.724 C 6.273 6.724 7.146 5.795 7.146 4.634 C 7.12 3.449 6.274 2.545 4.899 2.545 Z M 16.747 8.09 C 14.614 8.09 13.659 9.263 13.124 10.086 L 13.124 8.374 L 9.105 8.374 C 9.159 9.508 9.105 20.466 9.105 20.466 L 13.124 20.466 L 13.124 13.713 C 13.124 13.352 13.15 12.99 13.257 12.732 C 13.547 12.01 14.209 11.262 15.319 11.262 C 16.773 11.262 17.355 12.372 17.355 13.996 L 17.355 20.466 L 21.374 20.466 L 21.374 13.532 C 21.374 9.818 19.391 8.09 16.747 8.09 Z" fill="transparent" height="24.000006px" id="D0ecaHEcW" transform="translate(0 0)" width="24px"><path d="M 24 3 C 24 1.344 22.656 0 21 0 L 3 0 C 1.344 0 0 1.344 0 3 L 0 21 C 0 22.656 1.344 24 3 24 L 21 24 C 22.656 24 24 22.656 24 21 Z" fill="rgb(55, 184, 218)" height="24.000006px" id="IPLFE6zXx" width="24px"/><path d="M 4.02 0 L 0 0 L 0 12.092 L 4.02 12.092 Z" fill="rgb(255, 255, 255)" height="12.09201px" id="FWhtzAyuY" transform="translate(2.863 8.375)" width="4.02px"/><path d="M 2.274 0 C 0.899 0 0 0.904 0 2.089 C 0 3.25 0.871 4.179 2.221 4.179 L 2.247 4.179 C 3.648 4.179 4.521 3.25 4.521 2.089 C 4.495 0.904 3.649 0 2.274 0 Z" fill="rgb(255, 255, 255)" height="4.17876px" id="VmOsKv4kO" transform="translate(2.625 2.545)" width="4.52095px"/><path d="M 7.641 0 C 5.509 0 4.554 1.173 4.019 1.996 L 4.019 0.284 L 0 0.284 C 0.053 1.419 0 12.376 0 12.376 L 4.019 12.376 L 4.019 5.623 C 4.019 5.262 4.045 4.9 4.151 4.642 C 4.442 3.92 5.103 3.172 6.214 3.172 C 7.667 3.172 8.25 4.282 8.25 5.907 L 8.25 12.376 L 12.269 12.376 L 12.269 5.442 C 12.269 1.728 10.286 0 7.641 0 Z" fill="rgb(255, 255, 255)" height="12.37626px" id="n1XUbhaq0" transform="translate(9.105 8.09)" width="12.268830000000001px"/></g></g></g></g></svg>)