Master Your Debt to Equity Ratio for SME Growth
Unlock SME growth! Learn to calculate, interpret, and improve your debt to equity ratio for Australian businesses in 2026. Boost cash flow and financial health.
Ansh Malhotra

You're probably looking at a familiar fork in the road. Sales are there. Demand looks real. You could buy more stock, hire earlier, add a vehicle, fit out a second site, or finally stop juggling supplier terms and put a proper facility in place. On paper, each option can look sensible. In practice, one question sits underneath all of them.
How much of this business is being carried by debt, and how much is being carried by owner equity?
That's why the debt to equity ratio matters. Not because it's a finance textbook metric, but because it tells you how fragile or flexible your business really is when cash gets tight, rates stay high, customers pay late, or stock doesn't move when you expected. In Australia, that question has an extra layer. The Reserve Bank has warned that household indebtedness is structurally high, with household debt to disposable income rising from about 40% in the early 1990s to around 200% by the early 2020s, which matters because lenders often assess the owner and the business together, not as separate worlds (RBA household leverage context via Trading Economics).
For many SME owners, especially in trades, ecommerce, wholesale, hospitality, and transport, the business balance sheet never tells the full story on its own. Director guarantees, home equity, ATO debt, and lease commitments all sit in the background. A business can look profitable and still be too burdened by debt to grow comfortably.
Table of Contents
What the Debt to Equity Ratio Reveals About Your Business
The quickest way to understand the debt to equity ratio is this. It shows whether your business is being funded mainly by money it owes or by value it has built.
If a founder runs a wholesale business with strong revenue but thin retained earnings, rising creditor balances, and a stock line that keeps expanding before peak season, the business may look busy and successful while becoming more exposed each month. Another owner in professional services might have lower revenue but little debt, strong cash conversion, and solid retained profits. The second business often has more room to move, even if the top line is smaller.
More than a bank metric
Most owners first hear about D/E when a lender asks for it. That's too late.
Used properly, the ratio answers practical questions:
Can you fund growth safely: Borrowing for inventory, equipment, or fitout can help. It can also lock cash into repayments before the return shows up.
Are profits strengthening the business: Revenue growth doesn't help much if equity isn't growing with it.
How dependent are you on outside money: A business that relies heavily on suppliers, loans, and payment plans has less room when conditions tighten.
Practical rule: A strong debt to equity ratio doesn't mean “no debt”. It means debt is being used deliberately, with enough equity underneath it to absorb pressure.
Why Australian founders need a wider lens
In Australia, many SME lending decisions don't stop at the company file. Directors back facilities personally. Property security supports business borrowing. Director loans blur the line between household and business funding.
That means the debt to equity ratio often reveals two things at once. It reflects the business capital structure, and it hints at how much strain the owner is carrying behind the scenes. When owners are already stretched personally, the business can run out of resilience faster than the balance sheet suggests.
A ratio that looks acceptable in isolation can still be uncomfortable if the business has slow stock, ageing debtors, or obligations to the ATO that aren't clearing cleanly. The number matters. The story behind the number matters more.
Calculating Your Debt to Equity Ratio Step-by-Step
The formula itself is simple. Total liabilities ÷ total shareholder equity. For Australian businesses, the cleanest method is to pull both figures directly from the balance sheet, consistent with AASB-based financial reporting (Acumatica on the debt-to-equity formula and balance-sheet calculation)).
Where people go wrong isn't the maths. It's the inputs.
Start with the balance sheet
Open your latest balance sheet and identify two numbers.
Total liabilities usually includes amounts such as:
Bank debt: Term loans, overdrafts, equipment finance
Trade creditors: Supplier balances and unpaid bills
Tax obligations: GST, PAYG, super, and ATO payment arrangements where recognised as liabilities
Lease liabilities: Especially where lease accounting brings them onto the balance sheet
Director-related obligations: If the business owes the owner or related entities
Shareholder equity usually includes:
Paid-in capital: Money originally introduced by owners
Retained earnings: Profits left in the business after losses, drawings, and distributions are accounted for
Reserves or other equity balances: Depending on the business structure and reporting presentation
A practical caution matters here. Some liabilities are operational and some are financing in nature. If you want a sharper management view, many finance teams also assess the total ratio and then a narrower borrowing-focused version internally. That helps separate normal trading balances from actual debt pressure.
Work through a simple example
Take a straightforward ecommerce or wholesale business.
If total liabilities are $300,000 and shareholder equity is $200,000, the debt to equity ratio is:
300,000 ÷ 200,000 = 1.5
That means the business carries $1.50 in debt for every $1 of equity.
Here's how to interpret that in plain terms:
At 1.0, debt and equity are balanced.
At 1.5, leverage is moderate and worth monitoring.
At 2.5, the business is carrying significantly more debt than equity and risk is materially higher for SMEs with volatile cash flow.
If your ratio moved up while sales also grew, don't assume that's good news. Check whether the extra debt funded assets that convert to cash quickly, or whether it simply covered weak margins and timing gaps.
A few common errors distort the result:
Counting old intercompany balances casually: Clean up related-party accounts before relying on the ratio.
Ignoring lease liabilities: If they sit on the balance sheet, they affect the capital structure.
Using outdated equity figures: Retained earnings can change quickly after year-end adjustments or owner drawings.
Forgetting inventory quality: The formula uses liabilities and equity, but stock quality still affects how safe the ratio really is.
For inventory-heavy businesses, that last point matters most. Two businesses can post the same ratio, but the one sitting on slow-moving stock is carrying a different level of risk.
What Is a Good Debt to Equity Ratio in Australia
A “good” debt to equity ratio depends on what kind of business you run, how your cash cycle works, and what sits inside your liabilities. Generic advice misses that.
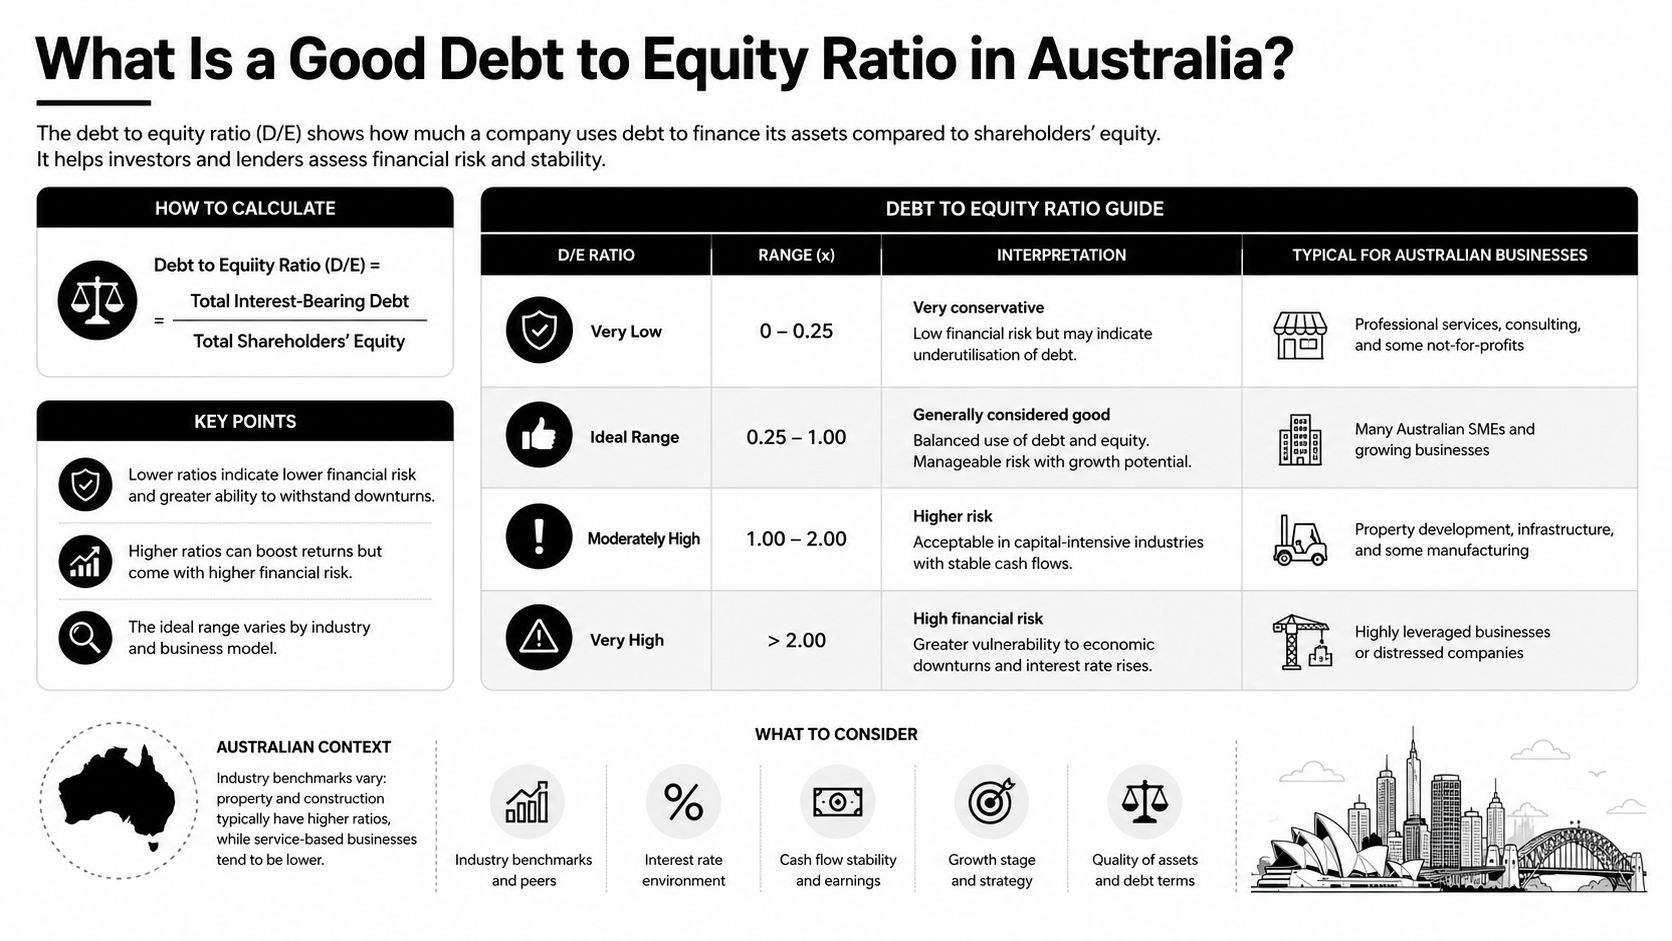
For Australian SMEs, a useful practical reading is this: below 1.0 usually points to stronger balance-sheet stability, 1.5 signals moderate debt financing, and once the ratio moves beyond the 1.5 to 2.0 range, many growth-stage businesses start running into tighter lending conditions. When ratios approach 1.8, virtual CFOs often start pushing for debt rebalancing before receivables delays, inventory build-up, or margin issues become bigger problems. A ratio above 2.0 is often treated as a warning sign, especially for businesses with uneven cash flow. At the conservative end, SMEs below 0.5 tend to show stronger resilience because they rely more heavily on equity than debt.
A visual summary helps:
Why one benchmark doesn't work
A service firm can often operate with low fixed assets, low stock, and cleaner cash conversion. In that model, a high D/E ratio usually deserves scrutiny because the business shouldn't need much borrowed capital to function.
Construction, manufacturing, freight, and some wholesale businesses are different. They often carry equipment, vehicles, inventory, project timing gaps, retentions, or larger working-capital swings. Those businesses can run with a higher proportion of borrowed funds and still be viable.
That's why sector norms matter. Asset-heavy sectors such as construction and manufacturing typically have higher debt levels than service firms. Retail and ecommerce can be especially misleading because seasonal stock builds, supplier terms, and lease treatment can make the ratio look better or worse than underlying reality.
A practical benchmark table
Industry Sector | Low Risk D/E | Moderate Risk D/E | High Risk D/E |
|---|---|---|---|
Service-based businesses | Below 1.0 | Around 1.0 to 1.5 | Above 1.5 |
Ecommerce and retail | Below 1.0 | Around 1.0 to 1.5 | Above 1.5 to 2.0 |
Wholesale and manufacturing | Below 1.0 | Around 1.5 | Above 2.0 |
Construction and transport | Around 1.0 | Around 1.5 to 2.0 | Above 2.0 |
These bands are practical management ranges, not universal rules. The same number can mean different things depending on stock turns, debtor days, margin quality, and whether liabilities include ATO arrangements or lease balances.
A short explainer video can also help if you want a broader primer before applying the ratio to your own numbers.
What usually distorts the picture
Australian founders often need to adjust how they interpret the ratio because several balance-sheet items blur the signal:
ATO payment plans: These may reflect temporary management of tax cash flow, or they may indicate the business is borrowing from the tax office to fund operations.
Lease liabilities: A business with multiple sites or vehicles may appear more indebted after lease recognition, even if trading is stable.
Inventory finance: Borrowing against stock can be sensible when stock turns fast. It becomes dangerous when demand slows.
Director loans: These can prop up the business, but they can also mask weak retained earnings.
High D/E isn't automatically bad. It's often acceptable when debt funds fast-turning assets and operating cash is strong. It becomes much harder to defend when cash is slow, margins are thin, or liabilities are plugging operating losses.
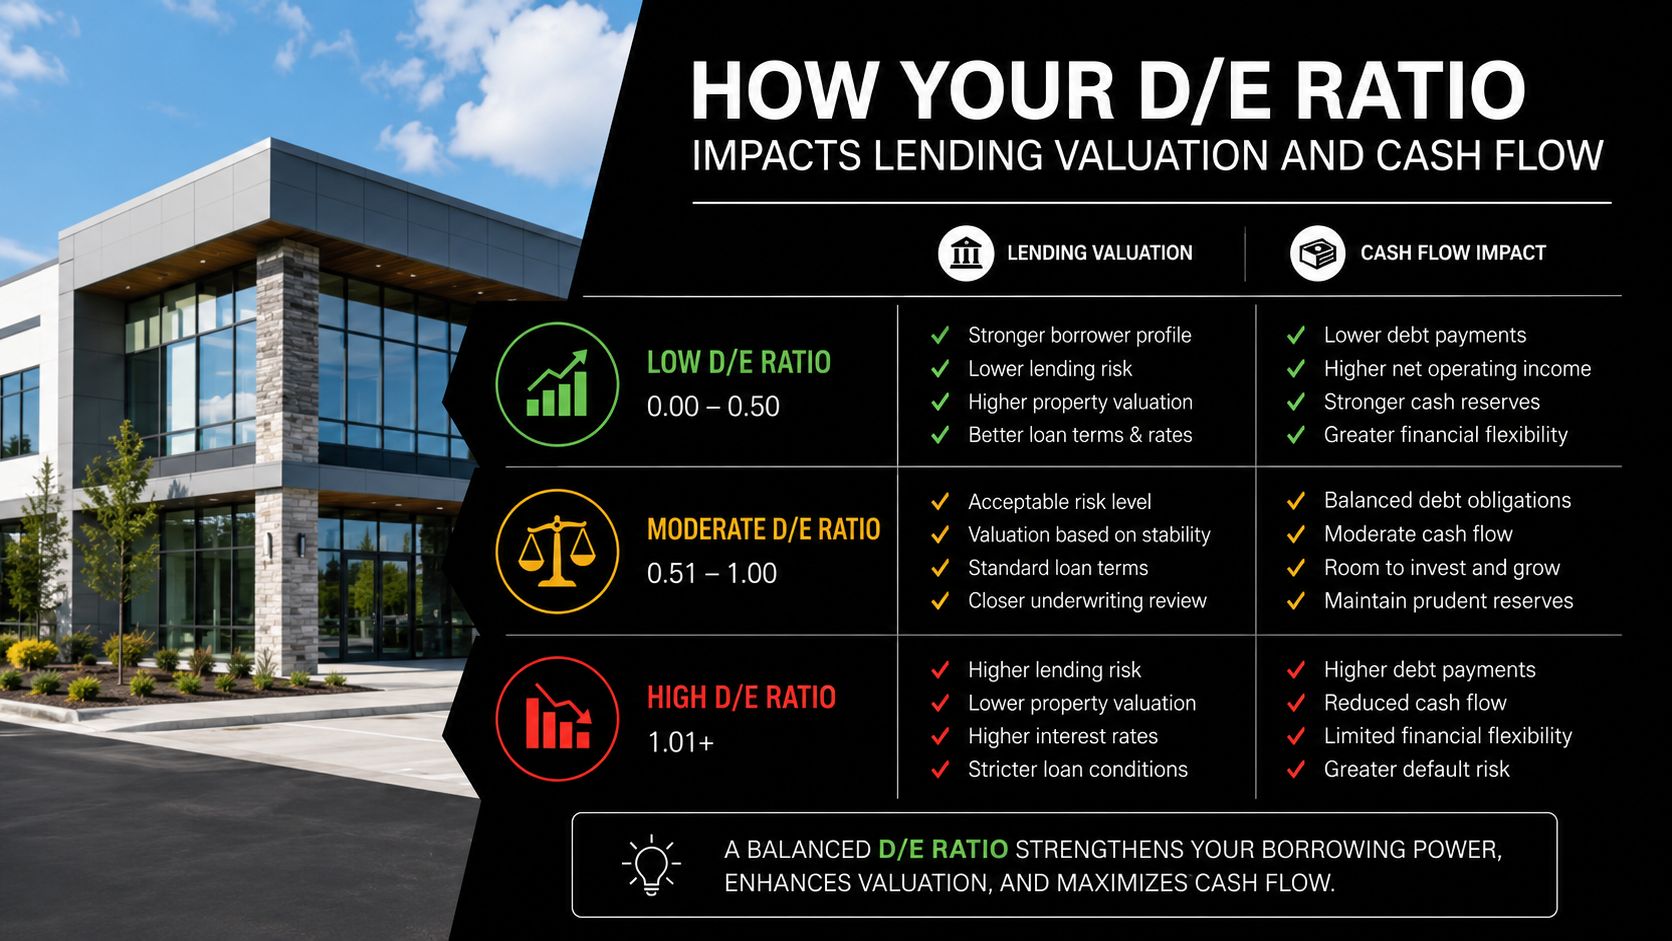
How Your D/E Ratio Impacts Lending Valuation and Cash Flow
The debt to equity ratio turns into consequences fast. It affects what lenders think, how buyers or investors view the business, and how much breathing room you have each month.
Lenders look past the headline number
Banks don't treat borrowed capital in isolation. A higher D/E ratio can still be workable when debt supports fast-turning assets and operating cash is strong. The trouble starts when interest costs remain high, repayments tighten, or the owner is also carrying personal guarantees and other obligations. ASIC guidance also points lenders toward repayment ability and guarantee structures, not just the balance sheet ratio itself (Allianz Trade on D/E interpretation, repayment ability and guarantee context)).
In practice, lenders ask questions such as:
What created the debt: Growth investment or operating shortfall
How quickly assets convert to cash: Especially for stock and receivables
What support sits behind the business: Personal guarantees, property security, or shareholder loans
How stable earnings are: Recurring work is easier to lend against than lumpy projects
Valuation follows balance-sheet quality
A buyer or investor rarely pays top value for a business that needs immediate financial repair. They don't just see debt. They see reduced flexibility, refinancing risk, and more conditions attached to the next growth phase.
That matters in transaction settings too. If you're trying to understand how debt financing changes deal dynamics, this seller's guide to leveraged buyouts is useful because it shows how debt can shape negotiation power, risk allocation, and sale outcomes.
A stronger capital structure usually gives owners more options. They can negotiate from a position of control instead of urgency.
Cash flow feels the pressure first
Most owners typically notice the problem before they notice the ratio.
A high D/E position pushes cash out through repayments, interest, lease obligations, and creditor pressure. If receivables slip or stock lingers, the same business can suddenly look profitable in the P&L and stressed in the bank account.
Common symptoms show up operationally:
You delay stock decisions: Because cash is committed to debt service.
You avoid hiring: Even when workload says you should.
You rely on tax timing: BAS or other obligations start acting like working-capital finance.
You lose negotiating power: Suppliers tighten terms when they sense strain.
A healthy ratio doesn't remove those pressures entirely. It gives you room to manage them without making every month a financing exercise.
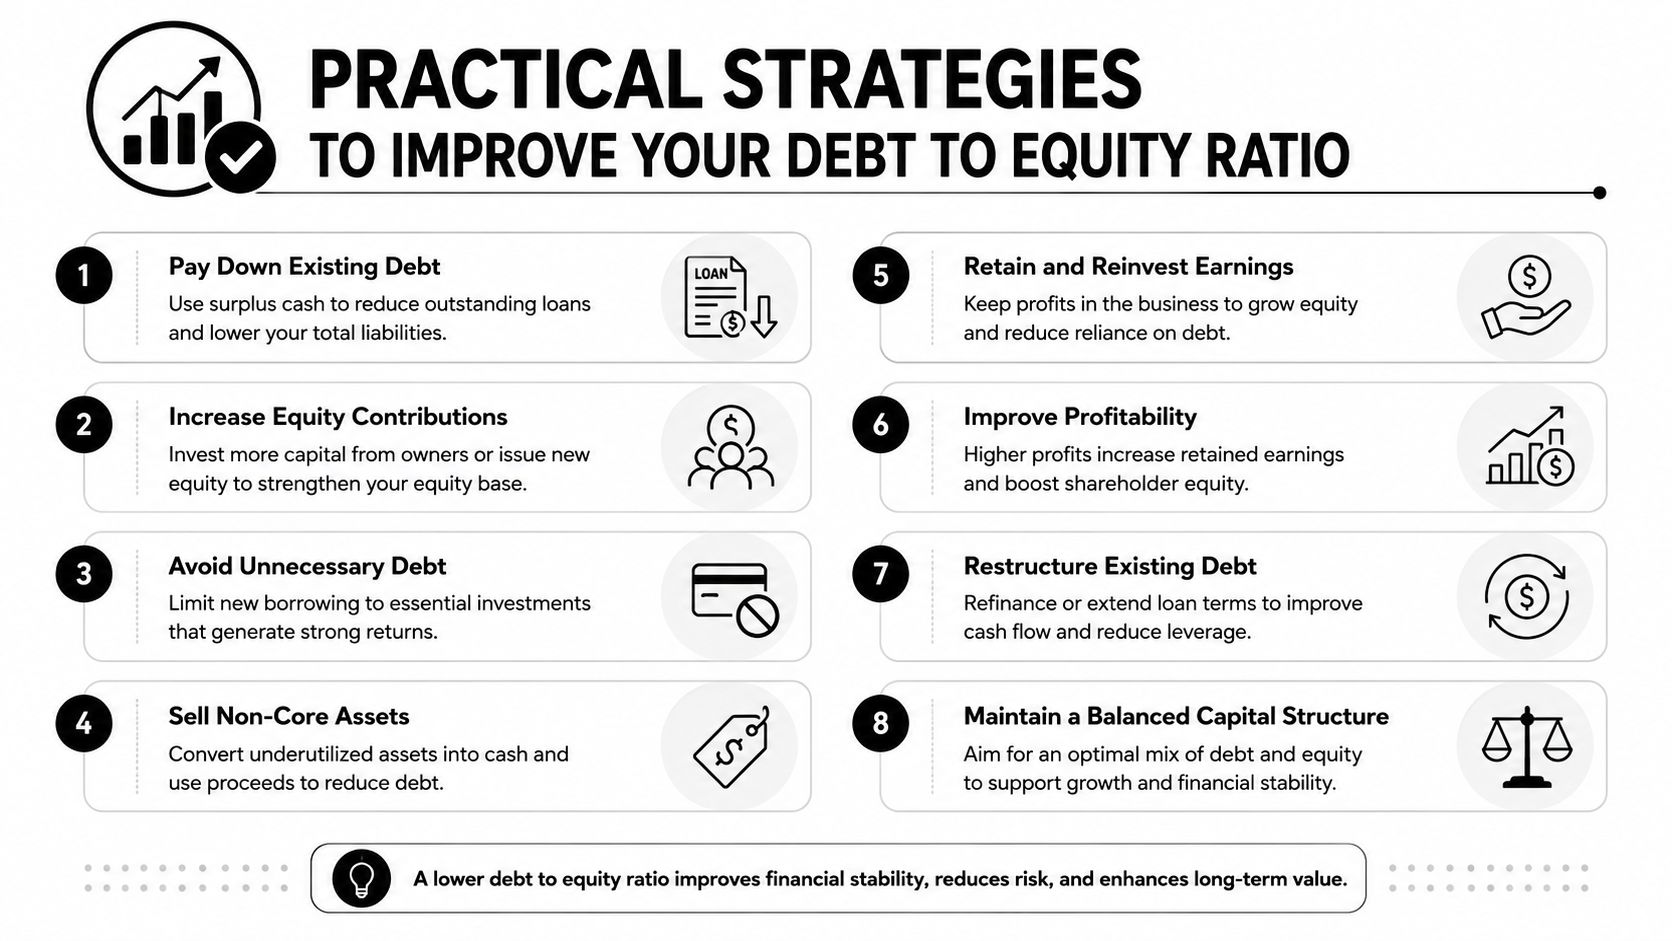
Practical Strategies to Improve Your Debt to Equity Ratio
If your debt to equity ratio is moving into uncomfortable territory, don't treat it as a reporting problem. Treat it as an operating problem with a finance consequence.
In the Australian SME market, once the ratio exceeds 1.5 to 2.0, businesses often face tighter lending conditions. Many virtual CFOs start rebalancing debt structures as the ratio approaches 1.8, especially where receivables and inventory are leaking cash. The fix usually sits on both sides of the equation. Reduce the wrong liabilities and increase real equity through stronger profits retained in the business.
Reduce the right debt first
Not all debt deserves the same attention. Owners often focus on the loudest creditor, not the debt creating the most damage.
Start with a review like this:
High-cost and short-term pressure first: Overdrafts, expensive facilities, or debt attached to weak-performing assets usually deserve attention before cheaper, productive debt.
ATO arrears need a plan: Tax debt can subtly distort the balance sheet and crowd out operational cash. It shouldn't become your default funding source.
Refinance messy structures: Multiple facilities with mismatched repayment profiles create friction. Consolidation can improve clarity and control, even if it doesn't solve the whole issue on day one.
Clear dead stock and stagnant assets: If borrowed money funded stock that isn't turning, the stock problem is now a debt burden.
A useful companion read is this guide on funding the business, because the best debt structure depends on what you're financing and how fast it pays you back.
Build equity through operating discipline
Most SMEs don't improve equity through a dramatic capital event. They improve it by keeping more of what they earn.
That usually means fixing the areas where profit gets trapped or lost:
Tighten pricing discipline. Small pricing errors across many invoices erode retained earnings faster than owners realise.
Lift gross margin quality. Stop treating revenue growth as the goal if margin keeps leaking through discounting, rework, freight overruns, or poor purchasing.
Shorten debtor collection. Slow receivables increase borrowing need, even when sales are healthy.
Control inventory buys. More stock doesn't always mean better service. Often it just means more equity tied up waiting.
Limit owner drawings when the debt-to-equity ratio is high. If the business needs equity, distributions may need to wait.
The fastest way to improve a strained debt to equity ratio is rarely “find more debt”. It's usually “stop funding avoidable inefficiency with borrowed money”.
Some businesses also consider fresh capital from owners or investors. That can strengthen the balance sheet quickly, but it only works if underlying trading is sound. Equity should support a viable model, not subsidise one that hasn't been fixed.
Beyond the D/E Ratio Other Key Financial Metrics
The debt to equity ratio is useful. It's not enough on its own.
A business can post a reasonable D/E number and still struggle to pay creditors on time. Another can carry higher debt and remain stable because cash conversion is fast and earnings cover repayments comfortably. If you manage the company by one ratio alone, you'll miss what matters.
Use a small dashboard not one ratio
Three other measures usually belong next to D/E:
Debt-to-asset ratio: This shows how much of the asset base is funded by liabilities. It offers a different insight into the company's financial structure, especially when equity is thin.
Interest coverage ratio: This tests whether operating profit can support interest costs. Two businesses with the same D/E can look very different once debt service enters the picture.
Current ratio or liquidity view: This checks whether short-term assets can support short-term obligations. It matters when stock or receivables dominate the balance sheet.
For finance leaders who want a broader solvency lens, this Guide for finance leaders on solvency adds useful context around operating cash and financial stability.
Why this matters in working-capital businesses
In inventory-heavy and project-based businesses, stress often sits in timing. You can be profitable and still short on cash because stock is sitting too long, debtors are slow, or supplier terms have tightened.
That's why I'd always pair financial risk analysis with the cash conversion cycle. It gives you the operating view that D/E can't. If the cycle is blowing out, financial risk usually gets worse next.
A ratio is a result. Process failures in stock, collections, purchasing, and margin control are often the cause.
Use D/E to spot risk. Use the wider dashboard to find where that risk is coming from.
When to Call a Virtual CFO for Your Finances
Some owners can monitor the debt to equity ratio internally and act early. Others only get a clear view once the pressure is already obvious in the bank account, the ATO position, or the next funding conversation.
A virtual CFO becomes useful when the issue is no longer just bookkeeping. It's when the business needs judgement, sequencing, and a plan.
Common trigger points include:
Your ratio is over 2.0: Especially if cash flow is uneven or stock-heavy.
You're preparing for a bank facility or refinance: The story behind the numbers needs to be clear before the lender starts asking questions.
Repayments are choking decisions: You're delaying hires, purchases, or tax payments because debt service dominates the month.
You can't tell whether your borrowing is strategic or reactive: This is common in businesses with inventory, lease obligations, director loans, and ATO balances all mixed together.
You're growing but equity isn't: Revenue is up, but retained earnings and cash aren't following.
A good finance partner won't just calculate the ratio and send you a report. They'll rebuild the logic behind the balance sheet, show what's causing pressure, model the trade-offs, and give you a sequence for fixing it. If you want a clearer picture of what that role looks like, this overview of a virtual chief financial officer is a sensible starting point.
Most owners don't need more finance jargon. They need someone to connect debt, stock, tax, margins, and cash into one operating plan.
If your debt to equity ratio is creating uncertainty around lending, cash flow, or growth decisions, Nexist helps Australian SMEs turn that confusion into a practical plan. The team works across forecasting, cash management, debt structure, inventory, reporting, BAS, tax, payroll, and operational systems so owners can strengthen equity, fix cash leaks, and scale with less financial strain.
debt to equity ratio, business finance, sme accounting, australian business, financial ratios

" width="24px"/><g d="M 0 24.129 L 0 0.129 L 24 0.129 L 24 24.129 Z M 0 24.129 L 0 0.129 L 24 0.129 L 24 24.129 Z M 24 3 C 24 1.344 22.656 0 21 0 L 3 0 C 1.344 0 0 1.344 0 3 L 0 21 C 0 22.656 1.344 24 3 24 L 21 24 C 22.656 24 24 22.656 24 21 Z M 6.883 8.375 L 2.863 8.375 L 2.863 20.467 L 6.883 20.467 Z M 4.899 2.545 C 3.524 2.545 2.625 3.449 2.625 4.634 C 2.625 5.795 3.496 6.724 4.846 6.724 L 4.872 6.724 C 6.273 6.724 7.146 5.795 7.146 4.634 C 7.12 3.449 6.274 2.545 4.899 2.545 Z M 16.747 8.09 C 14.614 8.09 13.659 9.263 13.124 10.086 L 13.124 8.374 L 9.105 8.374 C 9.159 9.508 9.105 20.466 9.105 20.466 L 13.124 20.466 L 13.124 13.713 C 13.124 13.352 13.15 12.99 13.257 12.732 C 13.547 12.01 14.209 11.262 15.319 11.262 C 16.773 11.262 17.355 12.372 17.355 13.996 L 17.355 20.466 L 21.374 20.466 L 21.374 13.532 C 21.374 9.818 19.391 8.09 16.747 8.09 Z" fill="transparent" height="24.12890599668026px" id="dSFdkJotL" width="24px"><path d="M 0 24 L 0 0 L 24 0 L 24 24 Z" fill="transparent" height="24px" id="wscNJE44G" transform="translate(0 0.129)" width="24px"/><g d="M 0 24.129 L 0 0.129 L 24 0.129 L 24 24.129 Z M 24 3 C 24 1.344 22.656 0 21 0 L 3 0 C 1.344 0 0 1.344 0 3 L 0 21 C 0 22.656 1.344 24 3 24 L 21 24 C 22.656 24 24 22.656 24 21 Z M 6.883 8.375 L 2.863 8.375 L 2.863 20.467 L 6.883 20.467 Z M 4.899 2.545 C 3.524 2.545 2.625 3.449 2.625 4.634 C 2.625 5.795 3.496 6.724 4.846 6.724 L 4.872 6.724 C 6.273 6.724 7.146 5.795 7.146 4.634 C 7.12 3.449 6.274 2.545 4.899 2.545 Z M 16.747 8.09 C 14.614 8.09 13.659 9.263 13.124 10.086 L 13.124 8.374 L 9.105 8.374 C 9.159 9.508 9.105 20.466 9.105 20.466 L 13.124 20.466 L 13.124 13.713 C 13.124 13.352 13.15 12.99 13.257 12.732 C 13.547 12.01 14.209 11.262 15.319 11.262 C 16.773 11.262 17.355 12.372 17.355 13.996 L 17.355 20.466 L 21.374 20.466 L 21.374 13.532 C 21.374 9.818 19.391 8.09 16.747 8.09 Z" fill="transparent" height="24.12890599668026px" id="sTpjGo1tb" width="24px"><path d="M 0 24 L 0 0 L 24 0 L 24 24 Z" fill="transparent" height="24px" id="s7ffpmKOD" transform="translate(0 0.129)" width="24px"/><g d="M 24 3 C 24 1.344 22.656 0 21 0 L 3 0 C 1.344 0 0 1.344 0 3 L 0 21 C 0 22.656 1.344 24 3 24 L 21 24 C 22.656 24 24 22.656 24 21 Z M 6.883 8.375 L 2.863 8.375 L 2.863 20.467 L 6.883 20.467 Z M 4.899 2.545 C 3.524 2.545 2.625 3.449 2.625 4.634 C 2.625 5.795 3.496 6.724 4.846 6.724 L 4.872 6.724 C 6.273 6.724 7.146 5.795 7.146 4.634 C 7.12 3.449 6.274 2.545 4.899 2.545 Z M 16.747 8.09 C 14.614 8.09 13.659 9.263 13.124 10.086 L 13.124 8.374 L 9.105 8.374 C 9.159 9.508 9.105 20.466 9.105 20.466 L 13.124 20.466 L 13.124 13.713 C 13.124 13.352 13.15 12.99 13.257 12.732 C 13.547 12.01 14.209 11.262 15.319 11.262 C 16.773 11.262 17.355 12.372 17.355 13.996 L 17.355 20.466 L 21.374 20.466 L 21.374 13.532 C 21.374 9.818 19.391 8.09 16.747 8.09 Z" fill="transparent" height="24.000006px" id="D0ecaHEcW" transform="translate(0 0)" width="24px"><path d="M 24 3 C 24 1.344 22.656 0 21 0 L 3 0 C 1.344 0 0 1.344 0 3 L 0 21 C 0 22.656 1.344 24 3 24 L 21 24 C 22.656 24 24 22.656 24 21 Z" fill="rgb(55, 184, 218)" height="24.000006px" id="IPLFE6zXx" width="24px"/><path d="M 4.02 0 L 0 0 L 0 12.092 L 4.02 12.092 Z" fill="rgb(255, 255, 255)" height="12.09201px" id="FWhtzAyuY" transform="translate(2.863 8.375)" width="4.02px"/><path d="M 2.274 0 C 0.899 0 0 0.904 0 2.089 C 0 3.25 0.871 4.179 2.221 4.179 L 2.247 4.179 C 3.648 4.179 4.521 3.25 4.521 2.089 C 4.495 0.904 3.649 0 2.274 0 Z" fill="rgb(255, 255, 255)" height="4.17876px" id="VmOsKv4kO" transform="translate(2.625 2.545)" width="4.52095px"/><path d="M 7.641 0 C 5.509 0 4.554 1.173 4.019 1.996 L 4.019 0.284 L 0 0.284 C 0.053 1.419 0 12.376 0 12.376 L 4.019 12.376 L 4.019 5.623 C 4.019 5.262 4.045 4.9 4.151 4.642 C 4.442 3.92 5.103 3.172 6.214 3.172 C 7.667 3.172 8.25 4.282 8.25 5.907 L 8.25 12.376 L 12.269 12.376 L 12.269 5.442 C 12.269 1.728 10.286 0 7.641 0 Z" fill="rgb(255, 255, 255)" height="12.37626px" id="n1XUbhaq0" transform="translate(9.105 8.09)" width="12.268830000000001px"/></g></g></g></g></svg>)