
A Practical Guide to Budgeting and Forecasting for SMEs
Discover a practical guide to budgeting and forecasting for Australian SMEs. Learn key strategies to manage finances and plan for growth in 2026.
Ansh Malhotra

A container deposit is due before Boxing Day cash arrives. Your December sales look excellent in the profit and loss statement, but a January BAS payment is about to drain the offset account, and your largest customer has pushed payment well beyond agreed terms. The business appears profitable. The bank balance tells a different story.
That gap is where Australian founders get hurt. Budgeting and forecasting aren't primarily P&L exercises. They're cash-timing systems that connect sales, stock, receivables, supplier terms, payroll, GST, super and tax obligations into one forward view. Business.gov.au distinguishes a budget, a plan for what the business wants to earn and spend during the financial year, from a forecast, an estimate of what is likely to happen next using current financial data and recent trends. The federal small-business fact sheet also puts the scale of the issue in context, with 2.5 million small businesses in Australia, contributing more than $500 billion to the economy and employing around 5.2 million people.
A working forecast gives you the answer your accounting software can't provide on its own: will the business have enough cash when the obligation falls due?
Table of Contents
Why Budgeting and Forecasting Matters for Australian Founders
Consider an importer selling homewares. December revenue lands strongly, gross margin looks healthy, and the owner approves another purchase order. Then the cash schedule catches up with reality. A January BAS payment reduces the offset account, a container deposit is due before the holiday sales convert into banked cash, and a major debtor stretches payment to 71 days.
The P&L doesn't show that sequence clearly. It records revenue when earned and expenses when incurred, while the bank account responds to settlement dates. GST collected from customers isn't operating profit, and payroll costs don't end with the net wage payment. Super obligations, PAYG instalments, supplier deposits and freight bills can all create cash demands that arrive after the sale but before the cash collection.
Practical rule: Profit tells you whether the model works. The cash forecast tells you whether the business survives long enough to benefit from it.
The Australian Taxation Office recommends that businesses build a cash flow budget or projection using fixed and expected variable costs, then update it monthly, quarterly or yearly as appropriate. The ATO specifically says to include PAYG instalments and GST, and to separate fixed costs such as rent, insurance and wages from variable costs such as advertising, utilities and equipment in the projection. The ATO's cash-flow guidance is practical because it focuses on the timing of cash, not just accounting profit.
Australia's policy environment makes static assumptions dangerous. The federal small-business update notes that the Government has committed more than $2 billion in targeted supports during the current parliamentary term. Changes to wages, tax offsets, energy relief or asset write-off rules can affect margins and cash timing, so founders should record policy assumptions in the forecast and update them when confirmed.
A forecast also needs humility. Treasury's review of Commonwealth revenue forecasts reported a mean absolute percentage error of 2.7 percentage points and examined error, bias and serial correlation as forecasting diagnostics. Treasury's forecasting review supports a clear conclusion for founders: don't treat one annual number as truth. Reconcile actuals, identify the drivers, stress-test downside cases and revise the model as conditions change.
Choosing the Right Forecasting Method for Your Stage
The right method depends on how quickly assumptions change and how much cash is tied up in working capital. A small professional-services firm needs a different model from an importer carrying months of stock. Choose the simplest system that gives you enough warning to act.
Method | Best for | Monthly time cost | Data needed | Main risk |
|---|---|---|---|---|
Static annual budget | Loan covenants, board reporting and a fixed operating plan | Qualitative estimate, usually a short review | Prior results, planned revenue and expenses | It becomes irrelevant when actual trading changes |
Rolling 13-week or 12-month forecast | Founders who need an active cash view | Qualitative estimate, refreshed as actuals arrive | Bank balance, invoices, payroll, tax and supplier commitments | The model becomes stale if nobody owns updates |
Driver-based model | Businesses with repeatable sales and operating drivers | Qualitative estimate, dependent on driver complexity | Leads, conversion, average sale, units, pricing, stock turn and capacity | False precision from weak assumptions |
Scenario planning | Businesses exposed to payment, demand, stock or policy shocks | Qualitative estimate, focused on agreed scenarios | Base assumptions plus upside and downside cases | Scenarios exist on paper without response actions |
The default path for smaller service firms
For a service firm below $2 million in turnover, start with a rolling 13-week cash forecast and a 12-month monthly outlook. Keep every line understandable to the founder. Revenue should connect to active projects, invoices due and realistic collection dates. Costs should include payroll, super, tax, software, rent, contractors and planned investment.
The annual budget still earns its place. Banks and advisers may require a fixed plan, while a board or leadership team needs a target for performance review. Use it as a reference point, then let the rolling forecast govern cash decisions.
This approach suits firms where delivery capacity and debtor timing matter more than inventory movements. Review the next 13 weeks weekly, especially before BAS, super and payroll obligations fall due.
A stronger default for stock-heavy businesses
Retailers, wholesalers, ecommerce brands and manufacturers should add inventory drivers and supplier timing from the start. A sales forecast that ignores purchase orders, landed cost, reorder points and debtor collection describes revenue activity, not available cash. Tie expected sales to purchasing dates, supplier terms, stock turn and the dates customers pay.
For teams refining the sales side, sales forecasting with Cyndra provides useful context on structuring sales assumptions before they enter the wider financial model.
Add driver-based modelling when an operating input can change a cash or capacity decision. Average order value, conversion, stock turn, utilisation and debtor days belong in the model if changing one affects hiring, purchasing or borrowing. Build base, upside and downside cases around those drivers, and assign a specific action to each case. A scenario without an owner or trigger is only paperwork.
Building the Core Budget Template and Inputs
Build the template from operational reality, not from a blank P&L. The founder should be able to trace every forecast line back to something observable, such as an order, employee, contract, invoice, purchase order or tax obligation.
Start with sales and direct costs
Create separate rows for each meaningful product, service line or customer category. For every month, capture revenue, units, average sale price and the assumption behind conversion or utilisation. Don't hide a weak sales assumption inside one annual growth figure.
For inventory businesses, COGS must include the costs that consume cash:
Landed cost: Product cost, freight in, customs duty and other import-related charges.
Stock movement: Opening stock, purchases, closing stock and expected sell-through.
Channel mix: Wholesale, retail, ecommerce and marketplace sales can carry different margins and payment timing.
Marketing spend: Link campaigns to a sales assumption, then maximise ROI with these tactics without allowing marketing to become an unchallenged percentage of revenue.
A service business should separate direct contractor costs, delivery labour and project-specific software from overhead. That distinction protects gross margin when the business adds work that requires external capacity.
Add payroll, overhead and capital expenditure
Payroll needs more than base wages. Include super at 12 per cent, payroll tax where applicable under each state's thresholds, workers compensation and contract labour. Treat super as a cash obligation with its own timing, not as an afterthought below the operating result.
Then add rent, insurance, software, marketing, utilities, professional fees and other recurring costs. Capital expenditure gets its own section, including the deposit date, delivery date, payment terms and expected funding source. Never bury a large equipment purchase inside ordinary operating expenses. That hides the cash decision from the person making it.
A practical template can follow this structure:
Horizon | Columns |
|---|---|
13-week cash view | Week ending, opening bank balance, customer receipts, other inflows, wages, super, GST and PAYG, suppliers, rent, overheads, capex, debt repayments, financing, net movement and closing cash |
12-month outlook | Month, revenue by driver, COGS, gross profit, payroll, operating expenses, EBITDA, capex, debtor movement, inventory movement, creditor movement, GST and tax cash, financing and closing cash |
Use the financial forecasting template as a starting point, then tailor the rows to your chart of accounts and operating cycle.
Link the accounting view to the bank account
Record debtor days, creditor days, GST collected and paid, super due dates, PAYG instalments and income tax instalments. The ATO recommends including GST and PAYG instalments in cash projections, so your template should show those obligations by expected payment date, not merely as an accrued expense.
Linking Cashflow, Inventory, and Late-Payment Risk
A three-statement bridge stops the P&L from hiding the cash consequences of growth. Start with profit, adjust for working-capital movements such as inventory and receivables, then show financing and the resulting cash position.
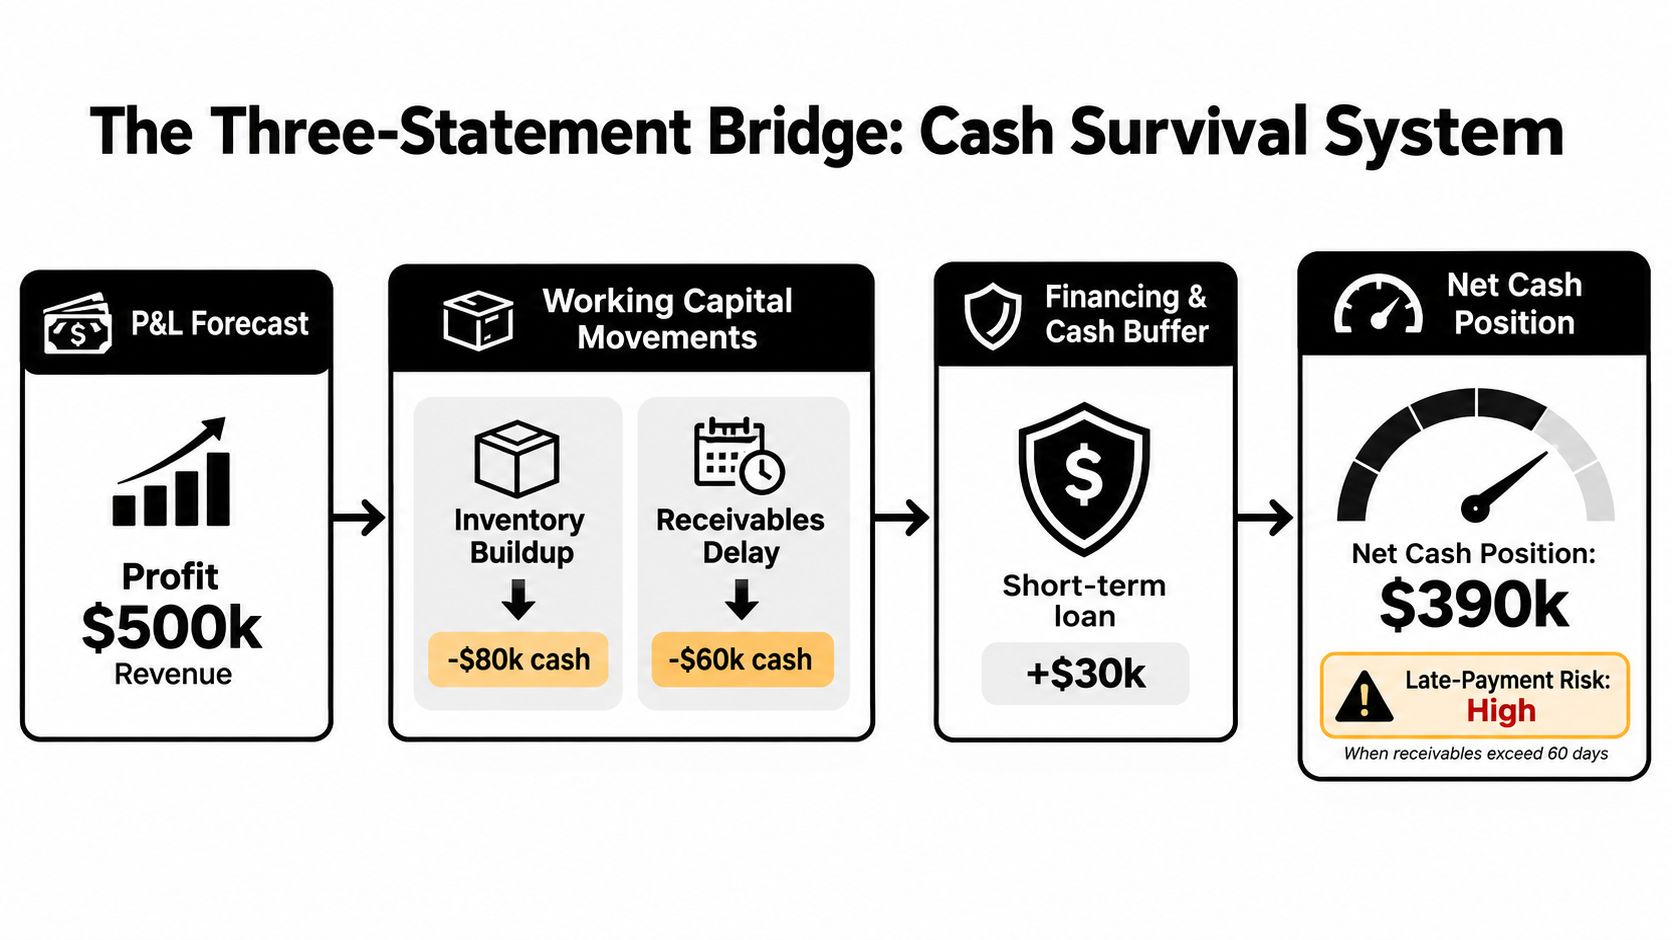
A business can report $500,000 in monthly revenue and still require an overdraft if stock is purchased early and customers pay late. The supplied stress example uses 70 per cent of stock purchased in week one, with debtor timing moving from 45 to 61 days, and produces a $90,000 overdraft. Those figures illustrate the mechanism, not a universal outcome. Your model must calculate the cash absorption from your own gross margin, purchase schedule and credit sales.
Track the core working-capital levers:
Debtor days: Trade debtors × 365 ÷ credit sales.
Inventory days: Average inventory ÷ COGS × 365.
Creditor days: Trade creditors ÷ purchases or COGS × 365, using a consistent basis.
The cash conversion cycle framework helps connect those measures. A longer debtor period consumes cash, excess stock traps cash, and shorter supplier terms can force the business to fund the gap.
Stress-test Australian timing shocks
Run three separate cases in the 13-week view:
BAS pressure: GST collected exceeds GST paid during the quarter. Move the expected BAS payment into the week it leaves the bank and test whether the closing balance falls below your operating floor.
Supplier compression: A supplier changes terms from 90 days to 30 days. Pull the affected invoices forward and calculate the resulting cash draw.
Customer slippage: A major customer moves from 30 to 75 days. Shift the receipt dates, then identify which payments or purchases become impossible without financing.
Don't rely only on averages. The 2025 payment report says 41 per cent of Australian SMBs receiving late payments wait more than 14 days past due, while 17 per cent wait over a month. The January 2026 regulator update cited in that report puts the average time for a large business to pay 95 per cent of its small-business invoices at 64 days.
Inventory businesses need the same discipline. Zeller's invoicing report says 63 per cent of Australian businesses reported losing money to late payments, with 17 per cent losing more than $2,500 per month, and estimates that Australian SMEs are paid 6.4 days later than their terms, costing about $1.1 billion in lost working capital each year.
Set a cash buffer based on fixed-cost exposure, tax timing and payment volatility. A commonly used planning range is 8 to 13 weeks of fixed costs, but the correct floor depends on your business. If the forecast breaches it, trigger a defined response, such as chasing priority debtors, reducing stock purchases, deferring capex, running down slow stock or arranging invoice finance.
Variance Analysis and the KPIs Worth Tracking
Variance analysis is the monthly comparison of actual results with the latest forecast, followed by an explanation of the operating driver. Don't stop at “revenue was down”. Separate price, volume and mix so the leadership team knows what action to take.
Suppose forecast revenue is $480,000 at a 62 per cent gross margin, producing $297,600 gross profit. Actual revenue is $445,000 at a 58 per cent gross margin, producing $258,100 gross profit. The gross-profit gap is $39,500. The volume shortfall explains part of it, while the 3.5 percentage-point margin compression explains the rest. The response could include repricing, supplier negotiation, product-mix correction or tighter discount approval.
Track a small dashboard every month:
KPI | Formula | Target | Amber band | Red band |
|---|---|---|---|---|
Gross margin | Gross profit ÷ revenue | Approved budget margin | Within 5% of target | Beyond 10% from target |
Debtor days | Trade debtors × 365 ÷ credit sales | Agreed collection standard | 5% to 10% adverse variance | Beyond 10% adverse variance |
Inventory turn | COGS ÷ average inventory | Business-approved stock policy | 5% to 10% adverse variance | Beyond 10% adverse variance |
Cash conversion cycle | Debtor days + inventory days − creditor days | Approved cash-cycle goal | 5% to 10% adverse variance | Beyond 10% adverse variance |
Fixed-cost cover | Available cash ÷ weekly fixed costs | Agreed cash floor | 5% to 10% below floor | Beyond 10% below floor |
Revenue per FTE | Revenue ÷ FTE | Capacity and budget target | 5% to 10% below target | Beyond 10% below target |
The tolerance bands are decision rules, not industry benchmarks. This budget-versus-actual guide can help structure the monthly review so every red variance has an owner and a corrective action.
A red gross-margin result should prompt a pricing or cost review. A red debtor result should prompt an invoice chase and customer escalation. A red cash-cover result should pause discretionary spending before the bank forces the decision.
Cadence, Governance, and Common Pitfalls
The annual budget ritual usually fails because nobody uses it when the facts change. Keep the annual budget for direction, but run the business through a 13-week rolling cash forecast with a named owner and a weekly update.

Use a fixed meeting rhythm
The founder should run a short Monday cash check. Confirm the opening bank balance, receipts expected that week, overdue invoices, payroll, tax, supplier payments and any commitment that has changed.
Mid-month, the sales and operations leads should review the assumptions behind revenue, stock, capacity and purchasing. At month end, provide the advisory team with a concise pack that includes:
One-page cash dashboard: Opening cash, expected inflows, committed outflows and closing cash.
Rolling forecast: Thirteen weeks updated with actual bank and accounting data.
Variance list: The largest misses, named owners and due dates.
Decisions log: What was approved, deferred or escalated, and why.
The meeting is not a reading exercise. It exists to decide whether to slow purchasing, reprice work, defer capex, chase a customer or arrange funding.
The recurring failures are predictable:
Single-version spreadsheet: Multiple copies create conflicting numbers. Use a controlled filename with the update date and archive prior versions.
Optimistic sales assumptions: Require evidence from orders, proposals, pipeline stages or capacity.
Ignored super and PAYG accruals: Show these as separate cash obligations.
Capex buried in opex: Record deposits and delivery timing in the cash view.
No escalation path: Decide in advance who acts when debtor days or cash cover breach the agreed threshold.
Write a forecast policy. State who updates it, when actuals replace estimates, what triggers an out-of-cycle revision and how the team approves major assumption changes. Reconcile the rolling model against actual results quarterly so the forecast remains credible rather than becoming another spreadsheet nobody trusts.
Quick Wins, Automation, and Your Next 30 Days
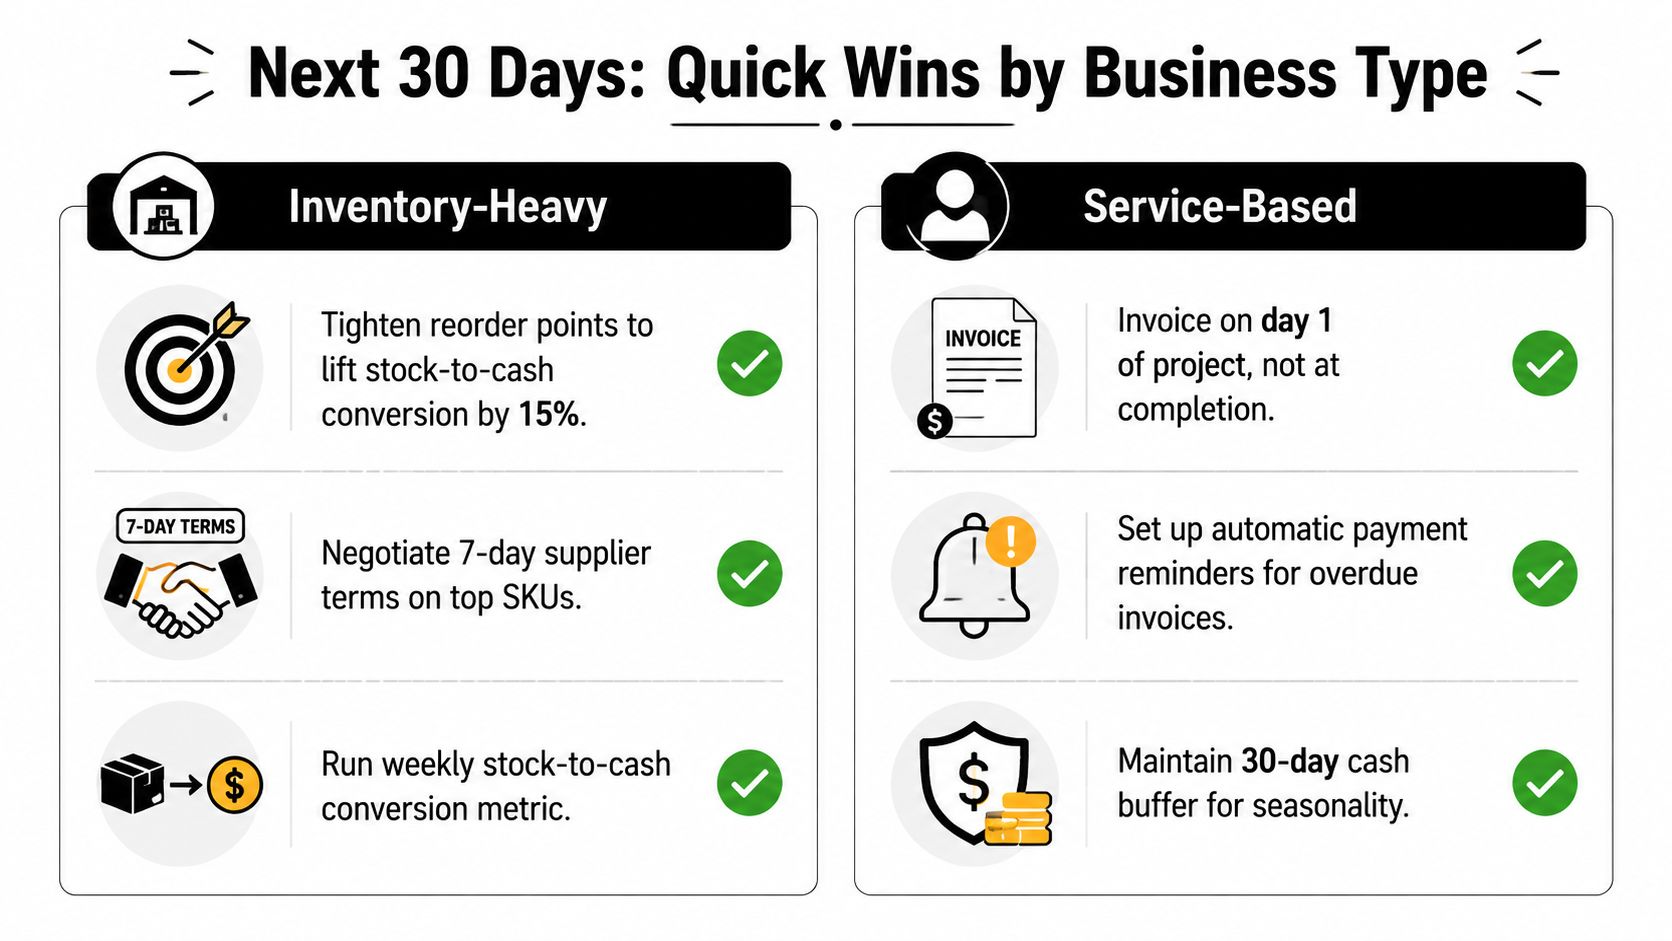
Start with the cash leaks you can see this week. Inventory-heavy founders should review reorder points, identify slow-moving stock and compare purchase timing with expected receipts. Service founders should focus first on billing terms, work in progress and overdue invoices.
For inventory-heavy businesses:
Tighten reorder points: Base replenishment on sell-through, supplier lead time and available cash, not sales enthusiasm.
Negotiate supplier timing: Ask for terms that align with the point at which your customers pay, starting with your highest-value stock keeping units.
Measure stock to cash weekly: Track purchases, stock sold, gross margin and cash released from reductions.
Protect the buffer: Treat the fixed-cost cash floor as unavailable for speculative purchasing.
For service businesses:
Invoice earlier: Bill weekly or in advance where the contract allows, rather than funding a long project before receiving cash.
Automate reminders: Send payment reminders before and after due dates, then assign a person to escalate overdue accounts.
Control work in progress: Set a limit for unfinished work and review projects that have consumed labour without producing an invoice.
Review brand obligations: If product traceability or digital product passport requirements affect your offer, find DPP solutions for small brands before committing budget to a disconnected process.
Automate the repeatable work
Use Xero, MYOB or QuickBooks as the accounting source, then automate the collection of bank, invoice, payroll, BAS-preparation and KPI data into the forecast where practical. A virtual CFO can use structured prompts to turn exports into management commentary, but the founder still needs to approve assumptions and decisions.
Try prompts such as:
“Review this P&L export against the attached forecast. Identify the largest price, volume, mix and cost variances, then write a concise commentary with an owner and action for each material variance.”
“Create base, downside and severe payment-slippage scenarios from this revenue, debtor and supplier data. Show which weeks fall below the cash buffer and list the response required.”
“Turn this month's P&L, balance sheet and cash-flow results into a board-ready memo covering performance, liquidity, risks, decisions and next month's priorities.”
Follow a 30-day implementation plan
Days 1 to 5: Reconcile the bank, confirm outstanding invoices, list committed supplier payments and record payroll, super, GST and PAYG obligations.
Days 6 to 10: Build the 13-week weekly cash view and 12-month monthly outlook. Assign an owner for every input.
Days 11 to 20: Add inventory, debtor and supplier scenarios. Review the cash buffer and create escalation triggers.
Days 21 to 30: Run the first forecast review, compare actuals with the model, correct weak assumptions and publish the decisions log.
A useful forecast isn't the most elaborate model. It's the one you update before approving the next hire, purchase order, discount or equipment deposit.
Nexist helps Australian founders connect forecasting, cash-flow management, performance reporting and operational finance in one practical system, including integrated P&L, balance sheet and cash-flow planning. Visit Nexist to discuss a cash-timing review and build a forecast your team can use every week.
budgeting and forecasting, SME cashflow, virtual CFO, rolling forecast, scenario planning

" width="24px"/><g d="M 0 24.129 L 0 0.129 L 24 0.129 L 24 24.129 Z M 0 24.129 L 0 0.129 L 24 0.129 L 24 24.129 Z M 24 3 C 24 1.344 22.656 0 21 0 L 3 0 C 1.344 0 0 1.344 0 3 L 0 21 C 0 22.656 1.344 24 3 24 L 21 24 C 22.656 24 24 22.656 24 21 Z M 6.883 8.375 L 2.863 8.375 L 2.863 20.467 L 6.883 20.467 Z M 4.899 2.545 C 3.524 2.545 2.625 3.449 2.625 4.634 C 2.625 5.795 3.496 6.724 4.846 6.724 L 4.872 6.724 C 6.273 6.724 7.146 5.795 7.146 4.634 C 7.12 3.449 6.274 2.545 4.899 2.545 Z M 16.747 8.09 C 14.614 8.09 13.659 9.263 13.124 10.086 L 13.124 8.374 L 9.105 8.374 C 9.159 9.508 9.105 20.466 9.105 20.466 L 13.124 20.466 L 13.124 13.713 C 13.124 13.352 13.15 12.99 13.257 12.732 C 13.547 12.01 14.209 11.262 15.319 11.262 C 16.773 11.262 17.355 12.372 17.355 13.996 L 17.355 20.466 L 21.374 20.466 L 21.374 13.532 C 21.374 9.818 19.391 8.09 16.747 8.09 Z" fill="transparent" height="24.12890599668026px" id="dSFdkJotL" width="24px"><path d="M 0 24 L 0 0 L 24 0 L 24 24 Z" fill="transparent" height="24px" id="wscNJE44G" transform="translate(0 0.129)" width="24px"/><g d="M 0 24.129 L 0 0.129 L 24 0.129 L 24 24.129 Z M 24 3 C 24 1.344 22.656 0 21 0 L 3 0 C 1.344 0 0 1.344 0 3 L 0 21 C 0 22.656 1.344 24 3 24 L 21 24 C 22.656 24 24 22.656 24 21 Z M 6.883 8.375 L 2.863 8.375 L 2.863 20.467 L 6.883 20.467 Z M 4.899 2.545 C 3.524 2.545 2.625 3.449 2.625 4.634 C 2.625 5.795 3.496 6.724 4.846 6.724 L 4.872 6.724 C 6.273 6.724 7.146 5.795 7.146 4.634 C 7.12 3.449 6.274 2.545 4.899 2.545 Z M 16.747 8.09 C 14.614 8.09 13.659 9.263 13.124 10.086 L 13.124 8.374 L 9.105 8.374 C 9.159 9.508 9.105 20.466 9.105 20.466 L 13.124 20.466 L 13.124 13.713 C 13.124 13.352 13.15 12.99 13.257 12.732 C 13.547 12.01 14.209 11.262 15.319 11.262 C 16.773 11.262 17.355 12.372 17.355 13.996 L 17.355 20.466 L 21.374 20.466 L 21.374 13.532 C 21.374 9.818 19.391 8.09 16.747 8.09 Z" fill="transparent" height="24.12890599668026px" id="sTpjGo1tb" width="24px"><path d="M 0 24 L 0 0 L 24 0 L 24 24 Z" fill="transparent" height="24px" id="s7ffpmKOD" transform="translate(0 0.129)" width="24px"/><g d="M 24 3 C 24 1.344 22.656 0 21 0 L 3 0 C 1.344 0 0 1.344 0 3 L 0 21 C 0 22.656 1.344 24 3 24 L 21 24 C 22.656 24 24 22.656 24 21 Z M 6.883 8.375 L 2.863 8.375 L 2.863 20.467 L 6.883 20.467 Z M 4.899 2.545 C 3.524 2.545 2.625 3.449 2.625 4.634 C 2.625 5.795 3.496 6.724 4.846 6.724 L 4.872 6.724 C 6.273 6.724 7.146 5.795 7.146 4.634 C 7.12 3.449 6.274 2.545 4.899 2.545 Z M 16.747 8.09 C 14.614 8.09 13.659 9.263 13.124 10.086 L 13.124 8.374 L 9.105 8.374 C 9.159 9.508 9.105 20.466 9.105 20.466 L 13.124 20.466 L 13.124 13.713 C 13.124 13.352 13.15 12.99 13.257 12.732 C 13.547 12.01 14.209 11.262 15.319 11.262 C 16.773 11.262 17.355 12.372 17.355 13.996 L 17.355 20.466 L 21.374 20.466 L 21.374 13.532 C 21.374 9.818 19.391 8.09 16.747 8.09 Z" fill="transparent" height="24.000006px" id="D0ecaHEcW" transform="translate(0 0)" width="24px"><path d="M 24 3 C 24 1.344 22.656 0 21 0 L 3 0 C 1.344 0 0 1.344 0 3 L 0 21 C 0 22.656 1.344 24 3 24 L 21 24 C 22.656 24 24 22.656 24 21 Z" fill="rgb(55, 184, 218)" height="24.000006px" id="IPLFE6zXx" width="24px"/><path d="M 4.02 0 L 0 0 L 0 12.092 L 4.02 12.092 Z" fill="rgb(255, 255, 255)" height="12.09201px" id="FWhtzAyuY" transform="translate(2.863 8.375)" width="4.02px"/><path d="M 2.274 0 C 0.899 0 0 0.904 0 2.089 C 0 3.25 0.871 4.179 2.221 4.179 L 2.247 4.179 C 3.648 4.179 4.521 3.25 4.521 2.089 C 4.495 0.904 3.649 0 2.274 0 Z" fill="rgb(255, 255, 255)" height="4.17876px" id="VmOsKv4kO" transform="translate(2.625 2.545)" width="4.52095px"/><path d="M 7.641 0 C 5.509 0 4.554 1.173 4.019 1.996 L 4.019 0.284 L 0 0.284 C 0.053 1.419 0 12.376 0 12.376 L 4.019 12.376 L 4.019 5.623 C 4.019 5.262 4.045 4.9 4.151 4.642 C 4.442 3.92 5.103 3.172 6.214 3.172 C 7.667 3.172 8.25 4.282 8.25 5.907 L 8.25 12.376 L 12.269 12.376 L 12.269 5.442 C 12.269 1.728 10.286 0 7.641 0 Z" fill="rgb(255, 255, 255)" height="12.37626px" id="n1XUbhaq0" transform="translate(9.105 8.09)" width="12.268830000000001px"/></g></g></g></g></svg>)