
Accounts Receivable Turnover: Guide for AU Founders
Learn how to calculate and improve accounts receivable turnover to boost cash flow. This guide covers formulas and analysis for Australian founders.
Ansh Malhotra

Tuesday morning is when many Australian founders discover that profit and cash are different things. Payroll is due, the BAS payment is approaching, a supplier wants settlement, and the bank balance looks acceptable until you compare it with the invoice schedule. Revenue has been booked, work has been delivered, but several large customers haven't paid.
That gap is where accounts receivable turnover matters. The metric shows how often your business collects its average credit sales during a period, translating invoice behaviour into an operating signal for liquidity and working capital (MYOB's Australian guide explains the formula and interpretation). A stronger result usually means cash is arriving faster. A weaker result usually means customers are taking longer, credit control is loose, or disputes are blocking payment.
But the headline ratio isn't the whole story. A tidy average can hide a handful of customers, sectors or invoice cohorts that are consuming your cash. I'd rather see a founder understand which customers are slowing collections than celebrate a ratio that looks acceptable on paper.
Table of Contents
The Bank Balance Looks Healthy Until the Invoices Don't Land
At 9 am, the founder opens the business bank account and sees enough cash to feel comfortable. By 10 am, they open the debtor ledger and notice that a major customer is beyond terms, two project invoices are waiting on purchase-order corrections, and a group of smaller accounts has stopped responding. By lunchtime, the payroll run, supplier payments and tax obligations have turned a seemingly healthy balance into a funding problem.
The business may be profitable. It may even have a strong order book. Neither fact guarantees that cash will arrive when the business needs it.
Receivables are the throttle between booked revenue and spendable cash. When customers pay promptly, sales support wages, stock purchases and debt service. When invoices sit unpaid, the founder effectively funds the customer while carrying the costs of delivery.
Practical rule: Never judge cash health from the bank balance alone. Read the balance beside the debtor ageing report and the payment behaviour of your largest customers.
Accounts receivable turnover gives you the first warning signal. It measures how frequently average receivables are collected and replaced across a period. A higher turnover generally indicates faster collection and stronger liquidity, while a lower result points to slower-paying customers or weak collection discipline (MYOB outlines why the metric matters for Australian businesses).
The mistake is treating that number as a verdict. An Australian SME selling to local trades, a national retailer and a large corporate won't have one consistent payment culture. The average can look reasonable while one corporate account absorbs most of the working capital.
Your useful question isn't “Is my turnover good?” Ask instead: Which customers, sectors and invoice groups are distorting the number, and does the result make sense against the terms I agreed to? That shift turns accounts receivable turnover from a reporting ratio into a cash-management tool.
How Accounts Receivable Turnover Actually Works
Accounts receivable turnover measures how many times, on average, your business collects its credit sales during a selected period. The standard formula is:
AR turnover = net credit sales ÷ average accounts receivable
Net credit sales means credit sales after returns and allowances. Average accounts receivable is calculated by adding the opening and closing receivables balances, then dividing the result by two.
Calculate the ratio step by step
Suppose an Australian service business records $300,000 in net credit sales during a quarter. Its opening accounts receivable balance is $40,000, and its closing balance is $60,000.
Average accounts receivable equals:
($40,000 + $60,000) ÷ 2 = $50,000
The quarterly turnover is:
$300,000 ÷ $50,000 = 6 times
That result is a quarterly frequency. To translate it into collection days, use the period's day count consistently. For an annualised interpretation, the standard conversion is 365 ÷ turnover, which is also the DSO relationship described in this guide to calculating DSO. If you annualise the quarterly sales and retain the same average receivables balance, annual credit sales would be $1.2 million, producing an annual turnover of 24 times and approximately 15 days DSO.
Formula | Calculation | Worked Example AUD |
|---|---|---|
Average accounts receivable | (Opening AR + Closing AR) ÷ 2 | ($40,000 + $60,000) ÷ 2 = $50,000 |
Period turnover | Net credit sales ÷ Average AR | $300,000 ÷ $50,000 = 6x per quarter |
Annualised turnover | Quarterly sales × 4 ÷ Average AR | $1.2m ÷ $50,000 = 24x |
DSO or turnover-in-days | 365 ÷ Annual turnover | 365 ÷ 24 = approximately 15 days |
Use net credit sales, not total revenue, where your accounting system separates cash and credit transactions. Exclude GST from the sales figure if your receivables balance also excludes GST. Otherwise, you compare mismatched numbers and create a ratio that looks precise but isn't reliable.
Monthly or quarterly tracking often reveals a change earlier than an annual calculation. Pull the same fields from Xero or MYOB each period, keep the method consistent, and investigate movement rather than chasing a universally “good” result.
Industry Benchmarks That Matter and the Ones That Mislead
A benchmark without context is a trap. Australian guidance commonly refers to 7 to 10 as a generally healthy turnover range for many small businesses, but Xero stresses that the right benchmark varies by industry and customer terms (Xero's Australian explanation links turnover with DSO). QuickBooks Australia notes that a turnover ratio of 12 corresponds to collection roughly every 30 days (its Australian ratio guide provides that translation).
Those figures are useful orientation points, not targets to impose on every business. A wholesaler selling on negotiated terms won't resemble a consumer-facing operator collecting at point of sale. A professional services firm with milestone billing will also produce a different pattern from a business issuing small recurring invoices.
What Australian examples show
Listed-company examples demonstrate how widely the ratio can vary. MarketWatch's Australian financial pages show Aurizon Holdings with recent annual accounts receivable turnover values of 4.04, 6.33, 6.21, 3.70 and 6.18, while Viva Energy Group's page shows 12.27, 13.20, 13.18, 14.28 and 14.87 (the QuickBooks Australia guide links to these AU examples). Shriro Holdings' quarterly figures show 2.60, 2.34, 2.78, 3.63 and 2.78, also through the same cited Australian reference.
The difference between these examples is more than 5 times, which is precisely why founders should compare like with like. The useful peer group matches industry, customer size, contract terms, billing milestones and dispute patterns.
Industry or example | Typical AR turnover | Typical DSO in days |
|---|---|---|
Many Australian small businesses | 7 to 10 | Approximately 52 to 37 |
QuickBooks reference point | 12 | Approximately 30 |
Aurizon Holdings examples | 3.70 to 6.33 | Approximately 99 to 58 |
Viva Energy Group examples | 12.27 to 14.87 | Approximately 30 to 25 |
Shriro Holdings quarterly examples | 2.34 to 3.63 | Approximately 156 to 101 |
These are historical examples, not a universal industry table. For a more relevant comparison, use IBISWorld, comparable ASIC filings and industry association surveys, then adjust for your own payment terms. A ratio that looks weak against a generic small-business range may be entirely normal for your sector. A ratio that looks strong may still be unacceptable if your contracts require payment sooner.
Why Averages Hide the Customers Who Are Drowning You
A portfolio average compresses different behaviours into one number. That makes it easy to report and dangerous to manage.
The Payment Times Regulator reported that reporting entities paid small-business invoices in an average of 26.2 days, but only 68.1% were paid on time and 95% took up to 56 days (the July 2025 regulator update shows the dispersion). The average sounds orderly. The spread tells you that many suppliers still face delayed cash.
A simple portfolio can create the same illusion. Imagine eight customers paying in 14 days and two paying in 180 days. Using an unweighted average of those payment times produces 47.2 days, not a neat picture of uniform customer behaviour. Most customers pay quickly, yet two accounts consume disproportionate management attention and working capital.
The average isn't the operating problem
A founder who sees a long DSO average may send another blanket reminder to every customer. That wastes goodwill with reliable payers while the actual problem sits with the two slow accounts.
Portfolio composition | DSO in days | AR turnover | Cash tied up |
|---|---|---|---|
Eight customers at 14 days, two at 180 days | 47.2 unweighted average | Approximately 7.7x | Concentrated in the slow cohort |
Reliable cohort only | 14 | Approximately 26.1x | Lower relative exposure |
Slow cohort only | 180 | Approximately 2.0x | High exposure per account |
The table is an illustration of dispersion, not a claim about a particular business. It shows why turnover should be paired with customer-level payment history, outstanding balances and invoice age.
The right question is not whether your average is acceptable. It's which invoices are making the average acceptable while quietly damaging cash.
Construction and other stressed sectors deserve particular attention. The regulator's 2025 update says more than half of B2B invoices were overdue in Australia in 2025, with late-payment pressure worsening rather than stabilising (the same regulator update provides the sector context). If your debtor book contains customers exposed to those conditions, segment them before setting credit limits or accepting another project.
Reading Turnover by Customer, Sector and Invoice Cohort
Start with the last 12 months of invoice data from Xero or MYOB. Export invoice date, due date, payment date, amount, customer, industry and status. Then build three cuts that answer different management questions.
Cut one by customer
Rank customers by total outstanding balance and payment days. A customer with a large balance and modest delay deserves more attention than a small account that sends frequent reminder requests.
Cut two by sector
Group customers by industry and compare collection days against your agreed terms. If construction accounts consistently pay later than professional services accounts, your credit policy should reflect that difference. Don't give both groups the same exposure just because the headline ratio blends them together.
Cut three by invoice cohort
Bucket invoices by age, such as current, 31 to 60 days, 61 to 90 days and 90-plus days. The aim is to identify where collection slows, not to produce an attractive chart.
For a practical structure, use an accounts receivable ageing report that separates open invoices by how long they've remained unpaid.
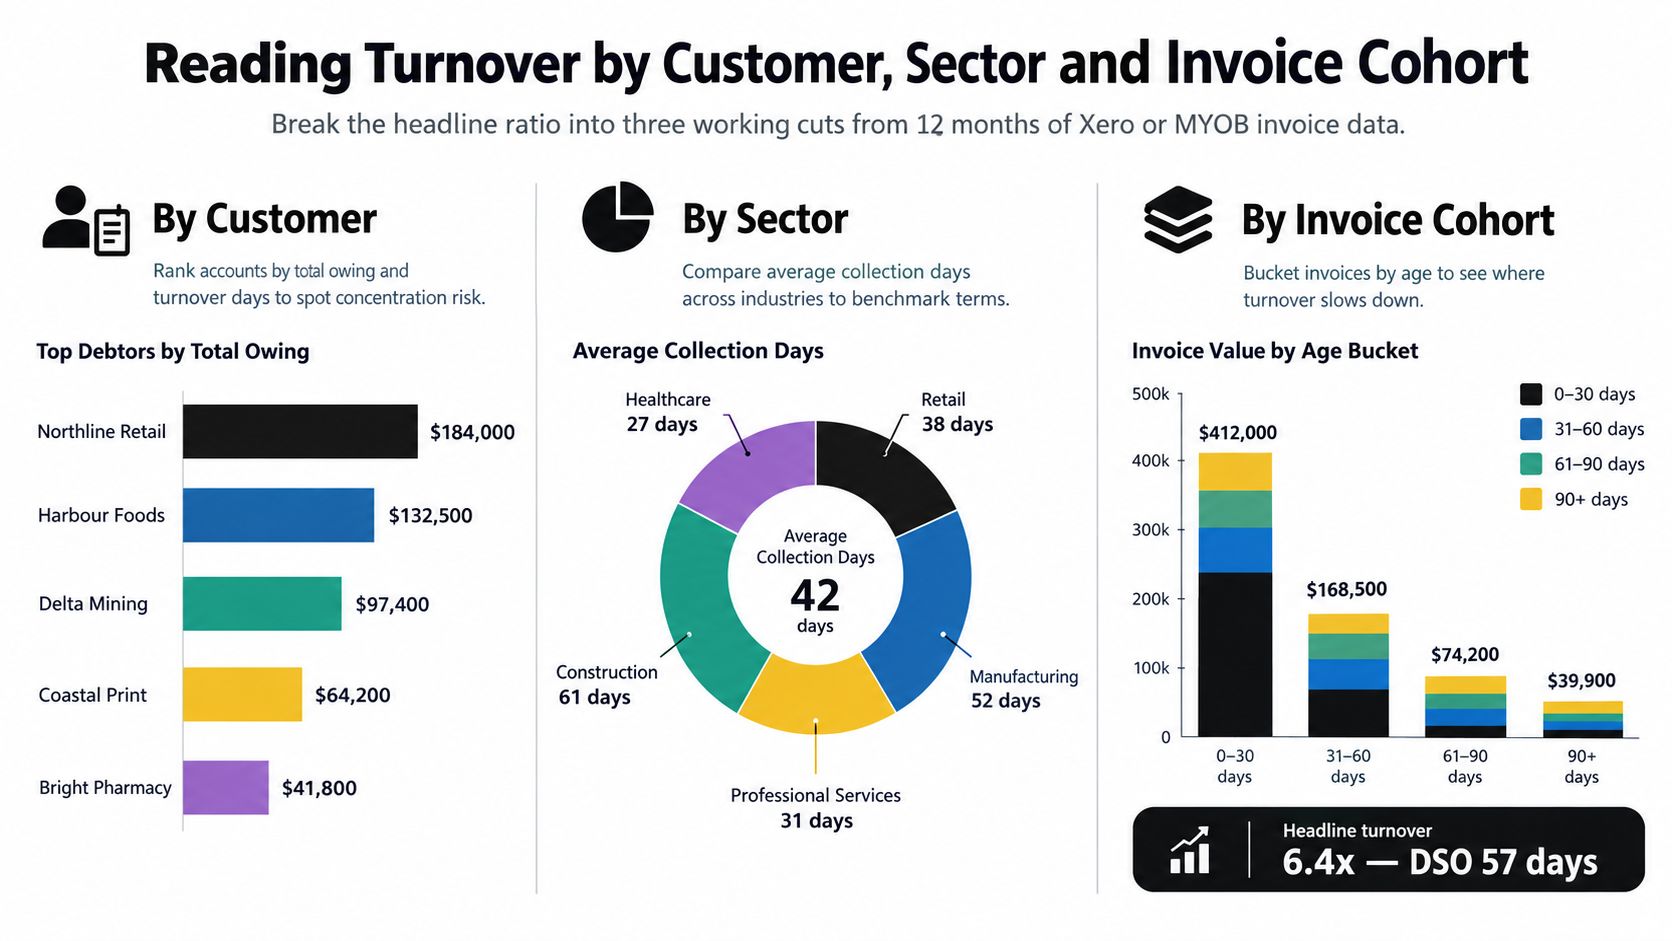
The resulting matrix should guide action by dollar impact, not by whichever customer sends the most emails. For each segment, record total owed, average days to pay, contracted terms, overdue amount and recent direction of travel.
A useful matrix might show that one sector pays predictably but slowly, another pays quickly except on large invoices, and a third creates disputes before every payment. Those are different problems. The first calls for pricing or funding decisions, the second for milestone and approval controls, and the third for better documentation.
Use the same analysis before onboarding a new account. Check the prospective customer's sector, expected invoice size, approval process and likely concentration in your debtor book. Stop chasing a portfolio number. Manage cohorts.
When a Healthy Ratio Still Means Cash Stress
A rising ratio can be good news, but it isn't proof that the bank account is safe. Xero reported that Australian small businesses were paid 6.0 days late in the June 2026 quarter, compared with 6.9 days in March and roughly eight days over the long term. In the same period, the 95th-percentile payment time for large businesses rose to 64 days from 58 days (Xero's Australian late-payment guidance explains the payment pattern).
That creates a common trap. Sales grow, the turnover ratio improves, and receivables still expand faster than the bank balance can absorb. A business can collect more efficiently while also granting more credit, taking on larger projects or carrying a growing concentration of unpaid invoices.
Pair turnover with a stress gauge
Track receivables as a percentage of monthly revenue alongside turnover. The ratio tells you collection frequency. The percentage tells you how much of your operating scale is sitting outside the bank.
Scenario | AR turnover | DSO in days | Receivables / monthly revenue | Cash stress level |
|---|---|---|---|---|
Fast collections with modest credit exposure | Higher | Lower | Low | Lower |
Acceptable average with uneven payment behaviour | Mid-range | Moderate | Rising | Medium |
Strong sales growth with receivables expanding | Improving | Improving | High | High |
The table is a management framework, not a statistical benchmark. You need to establish your own baseline and watch whether receivables are rising faster than the revenue that supports them.
Seasonality can distort a single period. Project businesses can issue several milestone invoices close together, creating a temporary spike. A monthly snapshot may therefore reflect billing timing rather than a genuine change in customer behaviour.
Read the trend across four quarters, then examine the customer and invoice cuts behind it. If turnover improves because a reliable cohort paid early while a large account keeps stretching terms, don't declare victory. Decide whether the commercial value of that account justifies the funding burden.
A Practical Playbook to Tighten Receivables Faster
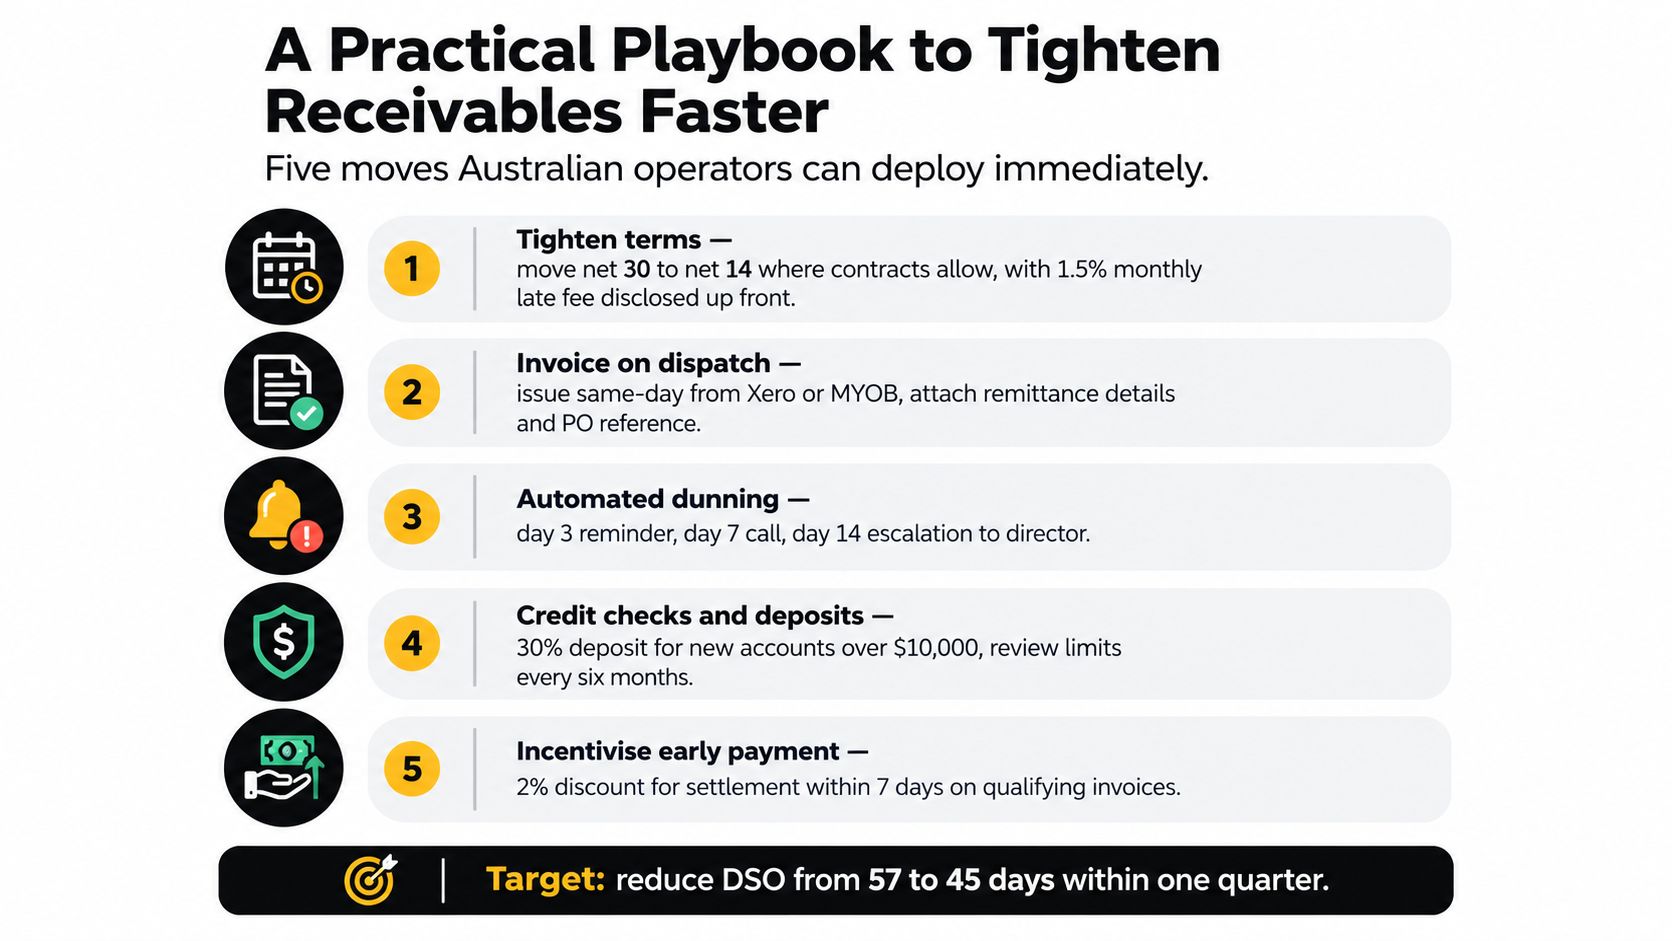
Improving accounts receivable turnover starts before the invoice becomes overdue. I'd use a five-part process, with a named owner and a visible escalation point for every account.
1. Set terms that match your funding capacity. Move from net 30 to net 14 where the contract allows it. Ask for a deposit on first orders or larger projects, and disclose any overdue interest in the agreement and invoice. Don't offer long terms to customers who haven't earned them through reliable payment behaviour.
2. Invoice as soon as the work is billable. Send the invoice from Xero, MYOB or Sage on dispatch, delivery or milestone approval. Include the purchase-order reference, remittance details and the contact responsible for approval. An invoice that waits in someone's inbox has already delayed your cash.
3. Automate the routine follow-up. Schedule statements and reminders so the process doesn't depend on the founder remembering every account. A practical sequence can include a reminder shortly after the due date, a personal call when the customer remains silent, and director-level escalation when the balance continues to age.
4. Apply credit holds consistently. Define what happens at each stage. Start with a friendly nudge, move to a call, pause new credit when the account becomes materially overdue, and refer persistent debts for specialist recovery. Your team needs authority to stop new work when exposure exceeds policy.
5. Review exposure every week. Run the debtor ageing report, score customers by payment history and cap the amount of credit available to any single client. The cap should reflect your monthly revenue, margin, contract terms and ability to absorb a delayed payment, not the customer's sales potential.
Businesses that want a practical example of automated follow-up can review Fitness GM automates payment recovery, which provides useful context on reducing manual payment chasing.
This short video offers another way to think about payment recovery workflows:
For a broader operating process, review accounts receivable management guidance and adapt the escalation stages to your contracts. The target isn't an impressive dashboard. It's fewer surprises before payroll and less cash trapped in customers who have already received the value you delivered.
Putting It Together in Your Weekly Numbers
Accounts receivable turnover belongs in a small weekly cash dashboard, not in a report opened only at month end. I'd track three numbers every Monday:
AR turnover ratio, calculated consistently so you can see the direction of travel.
Debtor ageing beyond 30 days, split by customer and value.
The spread between your best and worst customer DSO, which exposes concentration and payment-discipline risk.
These measures connect directly to the cash conversion cycle. Receivables contribute DSO, while inventory days and payable days complete the broader DSO + DIO − DPO relationship. A founder can improve supplier terms or reduce stock days and still lose the cash benefit if a major customer keeps delaying settlement (APAC working-capital benchmarking places Australia at 86 receivable days in 2023).
Reserve 15 minutes on Monday morning. Export the ageing report, rank the top 10 customers by payment speed and balance, then flag anyone drifting beyond 1.3 times their contracted terms. That threshold is an internal control, not an industry statistic. Use it to start a conversation before the invoice becomes a collection problem.
Next Monday, choose the three worst performers and draft revised payment terms, a deposit request or a credit limit. That single action moves you from hoping cash lands to running receivables as a system.
Nexist helps Australian founders connect accounts receivable performance with cash-flow forecasting, debtor controls and practical finance operations. Visit Nexist to discuss your receivables data and turn the next ageing report into a clear cash action plan.
accounts receivable turnover, AR turnover ratio, DSO, cash flow management, Australian SMEs

" width="24px"/><g d="M 0 24.129 L 0 0.129 L 24 0.129 L 24 24.129 Z M 0 24.129 L 0 0.129 L 24 0.129 L 24 24.129 Z M 24 3 C 24 1.344 22.656 0 21 0 L 3 0 C 1.344 0 0 1.344 0 3 L 0 21 C 0 22.656 1.344 24 3 24 L 21 24 C 22.656 24 24 22.656 24 21 Z M 6.883 8.375 L 2.863 8.375 L 2.863 20.467 L 6.883 20.467 Z M 4.899 2.545 C 3.524 2.545 2.625 3.449 2.625 4.634 C 2.625 5.795 3.496 6.724 4.846 6.724 L 4.872 6.724 C 6.273 6.724 7.146 5.795 7.146 4.634 C 7.12 3.449 6.274 2.545 4.899 2.545 Z M 16.747 8.09 C 14.614 8.09 13.659 9.263 13.124 10.086 L 13.124 8.374 L 9.105 8.374 C 9.159 9.508 9.105 20.466 9.105 20.466 L 13.124 20.466 L 13.124 13.713 C 13.124 13.352 13.15 12.99 13.257 12.732 C 13.547 12.01 14.209 11.262 15.319 11.262 C 16.773 11.262 17.355 12.372 17.355 13.996 L 17.355 20.466 L 21.374 20.466 L 21.374 13.532 C 21.374 9.818 19.391 8.09 16.747 8.09 Z" fill="transparent" height="24.12890599668026px" id="dSFdkJotL" width="24px"><path d="M 0 24 L 0 0 L 24 0 L 24 24 Z" fill="transparent" height="24px" id="wscNJE44G" transform="translate(0 0.129)" width="24px"/><g d="M 0 24.129 L 0 0.129 L 24 0.129 L 24 24.129 Z M 24 3 C 24 1.344 22.656 0 21 0 L 3 0 C 1.344 0 0 1.344 0 3 L 0 21 C 0 22.656 1.344 24 3 24 L 21 24 C 22.656 24 24 22.656 24 21 Z M 6.883 8.375 L 2.863 8.375 L 2.863 20.467 L 6.883 20.467 Z M 4.899 2.545 C 3.524 2.545 2.625 3.449 2.625 4.634 C 2.625 5.795 3.496 6.724 4.846 6.724 L 4.872 6.724 C 6.273 6.724 7.146 5.795 7.146 4.634 C 7.12 3.449 6.274 2.545 4.899 2.545 Z M 16.747 8.09 C 14.614 8.09 13.659 9.263 13.124 10.086 L 13.124 8.374 L 9.105 8.374 C 9.159 9.508 9.105 20.466 9.105 20.466 L 13.124 20.466 L 13.124 13.713 C 13.124 13.352 13.15 12.99 13.257 12.732 C 13.547 12.01 14.209 11.262 15.319 11.262 C 16.773 11.262 17.355 12.372 17.355 13.996 L 17.355 20.466 L 21.374 20.466 L 21.374 13.532 C 21.374 9.818 19.391 8.09 16.747 8.09 Z" fill="transparent" height="24.12890599668026px" id="sTpjGo1tb" width="24px"><path d="M 0 24 L 0 0 L 24 0 L 24 24 Z" fill="transparent" height="24px" id="s7ffpmKOD" transform="translate(0 0.129)" width="24px"/><g d="M 24 3 C 24 1.344 22.656 0 21 0 L 3 0 C 1.344 0 0 1.344 0 3 L 0 21 C 0 22.656 1.344 24 3 24 L 21 24 C 22.656 24 24 22.656 24 21 Z M 6.883 8.375 L 2.863 8.375 L 2.863 20.467 L 6.883 20.467 Z M 4.899 2.545 C 3.524 2.545 2.625 3.449 2.625 4.634 C 2.625 5.795 3.496 6.724 4.846 6.724 L 4.872 6.724 C 6.273 6.724 7.146 5.795 7.146 4.634 C 7.12 3.449 6.274 2.545 4.899 2.545 Z M 16.747 8.09 C 14.614 8.09 13.659 9.263 13.124 10.086 L 13.124 8.374 L 9.105 8.374 C 9.159 9.508 9.105 20.466 9.105 20.466 L 13.124 20.466 L 13.124 13.713 C 13.124 13.352 13.15 12.99 13.257 12.732 C 13.547 12.01 14.209 11.262 15.319 11.262 C 16.773 11.262 17.355 12.372 17.355 13.996 L 17.355 20.466 L 21.374 20.466 L 21.374 13.532 C 21.374 9.818 19.391 8.09 16.747 8.09 Z" fill="transparent" height="24.000006px" id="D0ecaHEcW" transform="translate(0 0)" width="24px"><path d="M 24 3 C 24 1.344 22.656 0 21 0 L 3 0 C 1.344 0 0 1.344 0 3 L 0 21 C 0 22.656 1.344 24 3 24 L 21 24 C 22.656 24 24 22.656 24 21 Z" fill="rgb(55, 184, 218)" height="24.000006px" id="IPLFE6zXx" width="24px"/><path d="M 4.02 0 L 0 0 L 0 12.092 L 4.02 12.092 Z" fill="rgb(255, 255, 255)" height="12.09201px" id="FWhtzAyuY" transform="translate(2.863 8.375)" width="4.02px"/><path d="M 2.274 0 C 0.899 0 0 0.904 0 2.089 C 0 3.25 0.871 4.179 2.221 4.179 L 2.247 4.179 C 3.648 4.179 4.521 3.25 4.521 2.089 C 4.495 0.904 3.649 0 2.274 0 Z" fill="rgb(255, 255, 255)" height="4.17876px" id="VmOsKv4kO" transform="translate(2.625 2.545)" width="4.52095px"/><path d="M 7.641 0 C 5.509 0 4.554 1.173 4.019 1.996 L 4.019 0.284 L 0 0.284 C 0.053 1.419 0 12.376 0 12.376 L 4.019 12.376 L 4.019 5.623 C 4.019 5.262 4.045 4.9 4.151 4.642 C 4.442 3.92 5.103 3.172 6.214 3.172 C 7.667 3.172 8.25 4.282 8.25 5.907 L 8.25 12.376 L 12.269 12.376 L 12.269 5.442 C 12.269 1.728 10.286 0 7.641 0 Z" fill="rgb(255, 255, 255)" height="12.37626px" id="n1XUbhaq0" transform="translate(9.105 8.09)" width="12.268830000000001px"/></g></g></g></g></svg>)