
Mastering Business Performance Indicators in 2026
Learn to track and act on business performance indicators. A practical guide for Australian SMEs to improve cash flow, profit, and efficiency this year.
published
business performance indicators, KPIs for SMEs, virtual CFO Australia, cash flow management, business metrics
Revenue is up. You're busier than ever. The team feels flat out. Yet the bank balance never seems to match the effort.
At that stage, many founders begin scrutinizing the profit and loss statement with the hope that a solution will emerge. Usually it does not. The P&L reports what has already occurred. It seldom explains why cash continues to vanish, why an active month still feels financially strained, or which segment of the company is dragging the rest down.
Business performance indicators fix that problem when they're chosen properly. They're not corporate jargon and they're not a dashboard full of pretty charts. They're the handful of numbers that tell you whether your pricing, delivery, stock, team capacity and customer economics are helping the business create cash, profit and time, or destroying them.
For an Australian SME, that difference matters. A founder doesn't need more reports. A founder needs a way to spot margin leakage early, tighten working capital, and make decisions without second-guessing every move.
Table of Contents
Moving Beyond Guesswork in Your Business
The Four Pillars of Business Performance
Why profit alone gives you a false sense of control
How the four pillars work together
Your Core Financial Health Indicators
Cash flow indicators that deserve weekly attention
Profitability indicators that show whether work is worth doing
Balance sheet indicators that expose pressure before it hits cash
Operational KPIs for Service and Inventory Businesses
What inventory-heavy businesses should watch closely
What service and trade businesses need to measure daily
How to Choose and Set Meaningful KPIs
Start with the decision, not the data
Use leading and lagging indicators together
Creating Your Business Scorecard and Avoiding Pitfalls
What a useful scorecard looks like
The mistakes that make KPI tracking useless
Your Actionable Roadmap to Financial Clarity
Quick wins this week
What to build next
Moving Beyond Guesswork in Your Business
A common pattern shows up in growing SMEs. Sales improve, new jobs come in, and the owner assumes the business is moving forward. Then payroll lands, suppliers need paying, BAS is around the corner, and suddenly growth feels more like pressure than progress.
That usually isn't a revenue problem. It's a visibility problem.
A founder might be looking at total sales while missing that rework is rising, stock is sitting too long, projects are being underquoted, or invoices are being paid later each month. None of those issues jump off the page in a basic monthly report. They show up through the right business performance indicators.
Think of BPIs as the business equivalent of vital signs. A doctor doesn't judge your health from one number. A pilot doesn't fly from a single gauge. In the same way, a founder can't run a business using revenue alone.
Practical rule: If a number doesn't help you decide what to fix, protect, or change this month, it probably doesn't belong on your main dashboard.
The strongest KPI systems are simple. They tie daily activity to financial outcomes. They show whether operational friction is turning into cash leakage. They give you an early warning before the bank account forces the conversation.
That's what matters in practice. Not reporting for reporting's sake. Not vanity metrics. Just a clear view of where profit is being created, where cash is getting trapped, and where your time is being wasted.
The Four Pillars of Business Performance
A business can look healthy on paper and still feel chaotic to run. That happens when the owner tracks only one dimension of performance and ignores the rest.
Why profit alone gives you a false sense of control
Profit matters, but it's a lagging signal. By the time the monthly accounts show a problem, the cause has usually been building for weeks.
That's especially dangerous in stock-heavy businesses. The Australian Bureau of Statistics data cited in this discussion notes that inventory mismanagement contributes to 28% of SME cash flow insolvencies in 2025, and retail and wholesale businesses carry average stock holding costs equal to 22% of revenue according to the ABS-related reference on non-financial performance measures. The same data set also notes that 41% of growth-stage Australian SMEs with strong EBITDA still fail due to untracked operational bottlenecks.
Those numbers matter because they expose a mistake I see often. Founders look at a decent gross profit result and assume operations are fine. Meanwhile, stock sits too long, order errors trigger credits, or team productivity drops. The financial result looks acceptable until cash tightens.
How the four pillars work together
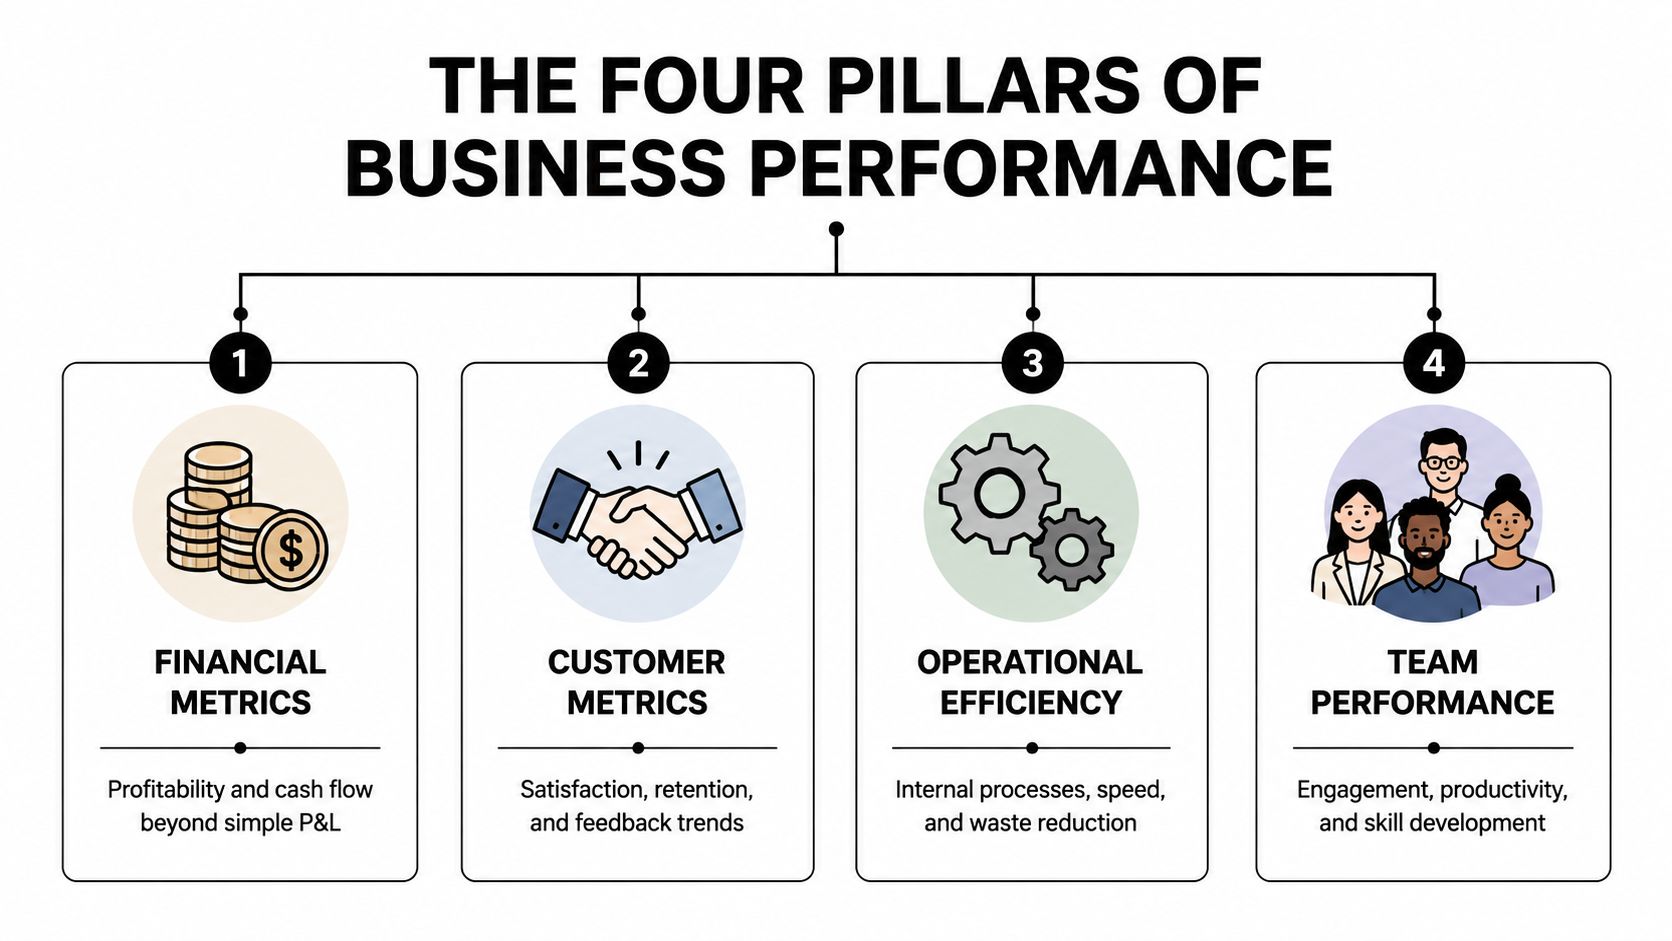
A useful KPI framework needs four pillars working together:
Financial health covers cash movement, margin quality, receivables, payables and overall profitability.
Operational efficiency tracks how work gets done. Think utilisation, defect rates, rework, turnaround times and project delivery discipline.
Inventory and supply chain health matters when cash is tied up in stock, purchasing and fulfilment.
Customer value keeps attention on retention, repeat buying, service quality and whether the work you win is the work you want.
Each pillar answers a different question.
Pillar | Key question | What it reveals |
|---|---|---|
Financial health | Is the business generating usable cash and profit? | Margin pressure, working capital stress, payment timing |
Operational efficiency | Are teams producing work efficiently? | Rework, wasted labour, poor scheduling, scope leakage |
Inventory and supply chain health | Is stock helping cash or trapping it? | Overstocking, slow-moving lines, fulfilment friction |
Customer value | Are customers worth keeping and serving? | Retention quality, service issues, poor-fit clients |
A busy business isn't always a healthy business. If operational and customer indicators aren't connected to financial outcomes, the founder is flying late.
That's why the best business performance indicators don't sit in separate silos. A defect rate matters because it causes returns, delays and wasted labour. Billable utilisation matters because it changes contract profitability. Customer retention matters because replacing lost customers usually costs time and attention that a founder can't spare.
Your Core Financial Health Indicators
Most founders don't need more finance terminology. They need a short list of numbers that tell the truth quickly.
Cash flow indicators that deserve weekly attention
Start with operating cash flow. In plain terms, this shows whether the business's normal trading activity is producing cash. If sales are rising but operating cash stays weak, the business is probably carrying too much stock, collecting invoices too slowly, or funding unprofitable work.
Next is your cash conversion cycle. This measures how long cash stays tied up between paying out for stock or delivery and collecting from customers. Service businesses may have little or no stock, but they still feel this cycle through debtor delays and work in progress.
A simple founder-level view looks like this:
Accounts receivable days tell you how long customers take to pay.
Accounts payable days show how long you take to pay suppliers.
Inventory days matter if you hold stock.
Put them together and you can see where cash is getting stuck.
If debtor timing is a problem, it's worth reviewing effective methods for calculating accounting DSO, especially if your invoice terms and actual cash receipts don't line up with what your reports appear to say.
Profitability indicators that show whether work is worth doing
Gross margin comes first. It tells you whether the work or product itself is priced sensibly after direct costs are stripped out. For service businesses, that usually means labour and direct delivery costs. For stock-based businesses, it includes product cost and directly attributable fulfilment costs.
Then look at EBITDA. This is one of the cleanest indicators of operating performance because it strips away financing and accounting noise and shows whether the core business model works.
For Australian service businesses, top performers typically exceed 19% EBITDA, and managed services agreements should sit at roughly 65% gross margin, based on the industry benchmark discussed by QuoteWerks. If you're under those marks, the usual culprits are underpricing, inefficient delivery, poor scope control, or a sales mix that includes too much low-margin work.
That benchmark is useful because it gives founders something concrete. If EBITDA is lagging, don't jump straight to overhead cuts. First check:
Pricing discipline. Are quotes based on current labour reality or old assumptions?
Scope control. Are small extras being absorbed without charge?
Delivery efficiency. Is the team spending too much time on non-billable fixes or admin?
Client mix. Are “good revenue” clients low-margin clients once delivery effort is counted?
Founder check: Revenue growth that comes with weaker margin quality is not growth you can rely on.
Balance sheet indicators that expose pressure before it hits cash
The balance sheet often gets ignored by owner-operators, but it contains some of the most useful business performance indicators.
Watch accounts receivable days closely. Rising receivable days usually mean collection discipline has softened, invoicing is delayed, or disputes are slowing payment. None of those problems stay on the balance sheet for long. They end up in your cash position.
Keep an eye on accounts payable days too. Stretching suppliers may buy time, but it can also hide a deeper cash problem. If supplier terms are the only reason cash still looks stable, that's not control. That's delayed pain.
For service and trade businesses, I also like project or contract profitability by client, job type or team. It isn't a standard statutory line item, but it often tells the truth faster than the monthly P&L. If one kind of work consistently carries weak margin, that's where pricing and process attention should go first.
Operational KPIs for Service and Inventory Businesses
The financial numbers tell you the outcome. Operational KPIs tell you what caused it.
What inventory-heavy businesses should watch closely
In ecommerce, wholesale, retail and manufacturing, profit often gets trapped in stock long before it disappears from the P&L. The founder sees shelves full of product and assumes that means value. The bank account tells a different story.
The most useful operational measures here are:
Inventory turnover. This shows how quickly stock sells through. Slow turnover usually means cash is tied up for too long.
Stock holding cost. This keeps attention on the carrying burden of inventory, not just the purchase price.
Order fulfilment accuracy. Picking and dispatch errors create credits, returns, labour waste and customer frustration.
Defect or return rate. This points to quality, supplier issues or handling problems.
Purchase order accuracy. Poor buying discipline creates overstocking in some lines and shortages in others.
If you track these alongside gross margin and receivables, patterns emerge quickly. A stock line may look profitable but still hurt cash because it moves slowly or generates too many fulfilment errors.
What service and trade businesses need to measure daily
Service and trade businesses have a different leakage pattern. Cash usually disappears through time. Time underquoted, time not billed, time lost to rework, and time spent fixing avoidable admin errors.
The operational KPIs that matter most are often these:
Billable utilisation rate. How much of available labour is spent on revenue-producing work.
Project profitability. Not just total job revenue, but revenue minus direct labour, subcontractors and delivery cost.
Estimate versus actual hours. This shows whether quoting is grounded in reality.
Rework rate. Every return visit, correction or post-handover fix eats margin.
Job completion cycle time. Delays affect invoicing speed and customer satisfaction.
Client acquisition cost. Useful if the business is spending meaningfully on sales and marketing.
The key is not to track these in isolation. Billable utilisation can look healthy while project profitability is weak because the work is underpriced. Cycle time can improve while rework gets worse because the team is rushing. Good KPI design forces those trade-offs into the open.
Business Type | Primary KPI | What It Measures |
|---|---|---|
Ecommerce retailer | Inventory turnover | How quickly stock converts into sales |
Wholesale distributor | Order fulfilment accuracy | Whether dispatch and delivery are right first time |
Manufacturer | Defect rate | Product quality and waste exposure |
Trade business | Estimate versus actual hours | Accuracy of quoting and labour control |
Agency or consultancy | Billable utilisation rate | Share of team capacity earning revenue |
Managed service provider | Contract profitability | Margin quality by agreement or client |
If a KPI can't be linked back to cash, margin, or capacity, it's probably interesting rather than useful.
A strong operating dashboard is different for each business model, but the principle stays the same. Track the behaviours and process signals that shape the financial result before month-end tells you you've got a problem.
How to Choose and Set Meaningful KPIs
A messy dashboard usually starts with a simple mistake. The business measures what's easy to pull from software instead of what helps the owner make decisions.
Start with the decision, not the data
Pick the decision first. Then choose the KPI.
If the goal is to free up cash, start with debtor days, invoice turnaround time, overdue amounts and stock ageing. If the goal is to lift margin, focus on pricing recovery, project profitability, utilisation or waste. If the goal is to reduce founder overload, measure approval bottlenecks, handoff delays and repeat manual tasks.
Keep the first dashboard tight. Most SMEs are better served by 3 to 5 core indicators than a giant reporting pack. You can always expand later once the business uses the information.
A practical selection test helps:
Relevant. Does this measure connect to a real business goal?
Actionable. Can someone change the result within a reasonable period?
Owned. Does one person or team know they're responsible for it?
Timely. Is the data available often enough to influence decisions?
Clear. Can everyone understand what good and bad look like?
For a straightforward explanation of how metrics become KPIs only when they're tied to outcomes, the Elyx AI manual for performance data is a useful reference. For more practical finance and operations thinking specifically for founders, Nexist's broader business insights library is also worth browsing.
Use leading and lagging indicators together
Lagging indicators report the result after the fact. Revenue, profit and net cash position sit here. They matter, but they arrive late.
Leading indicators signal what is likely to happen next. Invoicing speed, quote acceptance quality, rework, utilisation, stock ageing and debtor follow-up discipline all fit here.
A workable KPI set usually mixes both:
One or two lagging indicators that tell you the score.
Two or three leading indicators that explain where the score is heading.
A target and review cadence so the KPI doesn't become passive reporting.
Without that mix, founders drift into rear-view management. They review last month's numbers, agree that something needs attention, then wait another month to see if anything changed.
Creating Your Business Scorecard and Avoiding Pitfalls
A KPI only becomes useful when it's visible enough to drive action.
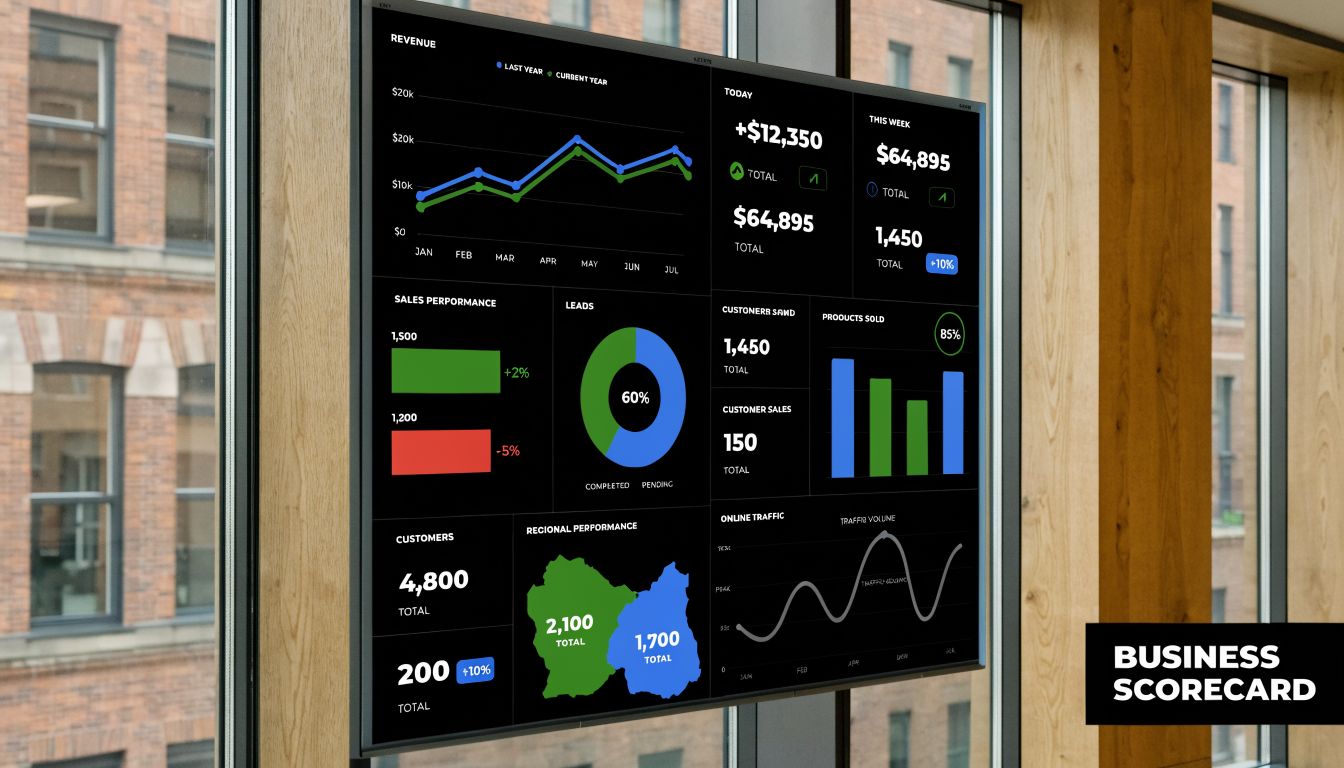
What a useful scorecard looks like
For most SMEs, a one-page scorecard works better than a deep reporting pack. The founder should be able to open it and answer four questions quickly:
Cash. Are we tighter or stronger than expected?
Margin. Is the work we're doing worth the effort?
Operations. Where is friction showing up?
Action. What needs to change this week?
That scorecard might live in Xero, a BI dashboard, a spreadsheet, or a custom reporting layer. The tool matters less than the routine. If no one reviews it consistently, it's decoration.
I'd rather see a simple scorecard reviewed every week than an advanced dashboard nobody trusts. That's one reason many founders eventually bring in structured support from a virtual CFO or operations-focused finance partner such as Nexist, because implementation discipline is usually the hard part, not the concept.
The mistakes that make KPI tracking useless
Most KPI systems fail for predictable reasons.
Vanity metrics take over. Website traffic, social followers or total leads can look impressive while cash worsens.
Targets are unrealistic or missing. Without a target, a KPI becomes trivia.
Data sits in silos. Stock data, finance data and delivery data don't talk to each other, so no one sees the complete story.
Nobody owns the number. If accountability is vague, action is vague too.
The team tracks data but changes nothing. This is the most common failure.
A dashboard should create a conversation about decisions, not admiration for reporting.
Sometimes it helps to see how other operators think about dashboard reviews in practice:
A good scorecard meeting is short and direct. What moved. Why it moved. What action follows. If that final step is missing, the KPI system hasn't done its job.
Your Actionable Roadmap to Financial Clarity
Most founders don't need a grand transformation first. They need a sequence they can follow.
Quick wins this week
Start by calculating a few essentials. Work out receivable days. Review overdue debtors. Check whether invoices are going out immediately after delivery or sitting in draft. If you carry stock, identify your slow-moving lines and ask whether they still deserve cash allocation.
Then choose a small first KPI set. One cash indicator, one margin indicator, one operational indicator. That's enough to start changing behaviour.
What to build next
Your next move is a weekly scorecard. Keep it on one page. Include trends, targets and owner actions. If the same issue appears for several weeks, it's no longer a reporting issue. It's a systems issue.
That's where automation starts to matter. Post-May 2025 ATO digital reporting rules and Xero-AI integrations have made automated, real-time KPI reporting more important, and 62% of SMEs cite manual KPI tracking as a major time-sink. Used properly, AI-driven SOPs can reclaim 20+ hours per week and improve forecasting accuracy by over 25%, as stated in the verified guidance provided for this article. For time-poor founders, that changes the game from reactive reporting to timely intervention.

Longer term, connect finance, operations and workflow data so your dashboard updates with minimal manual handling. That's usually where a virtual CFO earns their keep. They don't just pick the metrics. They help build the process, reporting rhythm and accountability around them. If you want to understand the practitioner behind that kind of finance-first operational work, you can read more about Neha Malhotra's approach.
The goal isn't more measurement. It's better control. Better control of cash. Better control of margins. Better control of your time.
If you want help turning scattered numbers into a practical scorecard and a finance system your team will use, Nexist works with Australian founders to tighten cash flow, lift margins, streamline reporting and put business performance indicators into day-to-day action.
Published via Outrank app